be57d0bd3bb6f740854091c28f1ffc3d.ppt
- Количество слайдов: 31


World energy economy at a glance Uri Barenholz Weizmann institute of science December, 2011

What do we mean when we talk about Energy?
![Energy Units a. Joule [J] a. 1[Newton]*1[meter] b. Example - lifting a chocolate bar](https://present5.com/presentation/be57d0bd3bb6f740854091c28f1ffc3d/image-3.jpg "Energy Units a. Joule [J] a. 1[Newton]*1[meter] b. Example - lifting a chocolate bar")
Energy Units a. Joule [J] a. 1[Newton]*1[meter] b. Example - lifting a chocolate bar to a height of 1[m] b. (Kilo) Calorie [Cal] a. Heating 1 Liter of water by 1 degree Centigrade b. equals 4, 185 [J] c. Human at rest consumes 1[Cal] per kg per hour
 per day?")
So, how many calories do you burn (resting) per day?
![So, how many calories do you burn (resting) per day? 70[kg]*1[Cal/kgh]*24[h/d]~=1700[Cal/d]](https://present5.com/presentation/be57d0bd3bb6f740854091c28f1ffc3d/image-5.jpg "So, how many calories do you burn (resting) per day? 70[kg]*1[Cal/kgh]*24[h/d]~=1700[Cal/d]")
So, how many calories do you burn (resting) per day? 70[kg]*1[Cal/kgh]*24[h/d]~=1700[Cal/d]
![Power - Energy flux a. Watt [W] = 1[J/Sec] b. Horse power [HP] ~=](https://present5.com/presentation/be57d0bd3bb6f740854091c28f1ffc3d/image-6.jpg "Power - Energy flux a. Watt [W] = 1[J/Sec] b. Horse power [HP] ~=")
Power - Energy flux a. Watt [W] = 1[J/Sec] b. Horse power [HP] ~= 740 [W] a. Average car has ~ 100[HP] = 74[k. W] c. k. Wh = the energy when providing 1[k. W] for 1[Hour] a. 3, 600, 000 [J]

So, what is your power consumption?
![So, what is your power consumption? 70[kg]*1[Cal/h]*4185[J/Cal]*1/3600[h/Sec]~=80[W]](https://present5.com/presentation/be57d0bd3bb6f740854091c28f1ffc3d/image-8.jpg "So, what is your power consumption? 70[kg]*1[Cal/h]*4185[J/Cal]*1/3600[h/Sec]~=80[W]")
So, what is your power consumption? 70[kg]*1[Cal/h]*4185[J/Cal]*1/3600[h/Sec]~=80[W]

Efficiency a. Muscle efficiency ~ 20% b. Internal combustion engine ~ 20% c. Turbines (Gas/steam) ~ 40%

How many calories you burn when climbing one floor?
![How many calories you burn when climbing one floor? 70[kg]*10[N/kg]*3[m]*5*1/4185[Cal/J]~=2. 5[Cal]](https://present5.com/presentation/be57d0bd3bb6f740854091c28f1ffc3d/image-11.jpg "How many calories you burn when climbing one floor? 70[kg]*10[N/kg]*3[m]*5*1/4185[Cal/J]~=2. 5[Cal]")
How many calories you burn when climbing one floor? 70[kg]*10[N/kg]*3[m]*5*1/4185[Cal/J]~=2. 5[Cal]
![Content and Cost a. Fuel ~ 9000[Cal/L] -> 0. 1$ per k. Wh b.](https://present5.com/presentation/be57d0bd3bb6f740854091c28f1ffc3d/image-12.jpg "Content and Cost a. Fuel ~ 9000[Cal/L] -> 0. 1$ per k. Wh b.")
Content and Cost a. Fuel ~ 9000[Cal/L] -> 0. 1$ per k. Wh b. Canola oil ~ 8000[Cal/L] -> 0. 1$ per k. Wh c. Electricity - 0. 15$ per k. Wh
![World energy consumption a. Consumed resources: a. 474*1018[J] (As of 2008) b. 15[TW] c.](https://present5.com/presentation/be57d0bd3bb6f740854091c28f1ffc3d/image-13.jpg "World energy consumption a. Consumed resources: a. 474*1018[J] (As of 2008) b. 15[TW] c.")
World energy consumption a. Consumed resources: a. 474*1018[J] (As of 2008) b. 15[TW] c. 2200[W] (Per person)

Consumption by usage a. Agriculture and industrial use: 37% b. Transportation: 20% c. Residential: 11% d. Commercial: 5% e. Lost in generation and transmission: 27%
![How much does an average car account for? Assuming 20, 000 [km/year]](https://present5.com/presentation/be57d0bd3bb6f740854091c28f1ffc3d/image-15.jpg "How much does an average car account for? Assuming 20, 000 [km/year]")
How much does an average car account for? Assuming 20, 000 [km/year]

How much does your electricity bill account for? Assuming 600 ILS bill

Side note - use air conditioning for heating a. Air conditioning transfers heat energy from outside indoors. b. Has "efficiency" of more than 100%! a. modern air conditioners have ~ 350% efficiency.

World energy sources a. Oil - 33% b. Coal - 27% c. Gas - 21% d. Nuclear - 6% e. Hydroelectric - 2. 5% f. Other (mostly biomass for heating) ~ 10%
![Fossil and non-renewable fuels a. Oil reservoirs - 200 Billion [m 3] a. Assuming](https://present5.com/presentation/be57d0bd3bb6f740854091c28f1ffc3d/image-19.jpg "Fossil and non-renewable fuels a. Oil reservoirs - 200 Billion [m 3] a. Assuming")
Fossil and non-renewable fuels a. Oil reservoirs - 200 Billion [m 3] a. Assuming constant consumption will suffice till 2050 b. Coal - 900 Billion [m 3] a. Assuming constant consumption will suffice till 2150 c. Gas/Uranium - we have enough.
 By country/region: a. US - 18% • China - 17% •")
Energy consumers (2008) By country/region: a. US - 18% • China - 17% • EU - 14% • India, Africa - 5% each Power per capita: a. US/Canada ~ 10[k. W] • EU/Israel ~ 4. 5[k. W] • Germany/Japan ~ 6[k. W] • China ~ 1. 5[k. W] • India ~ 0. 7[k. W] • Bangladesh ~ 0. 2[k. W]

The promise of renewable energy

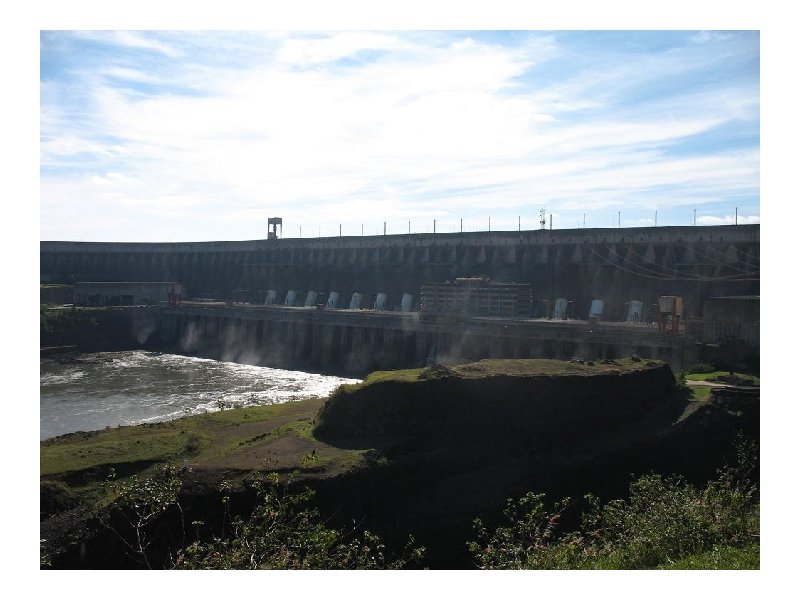
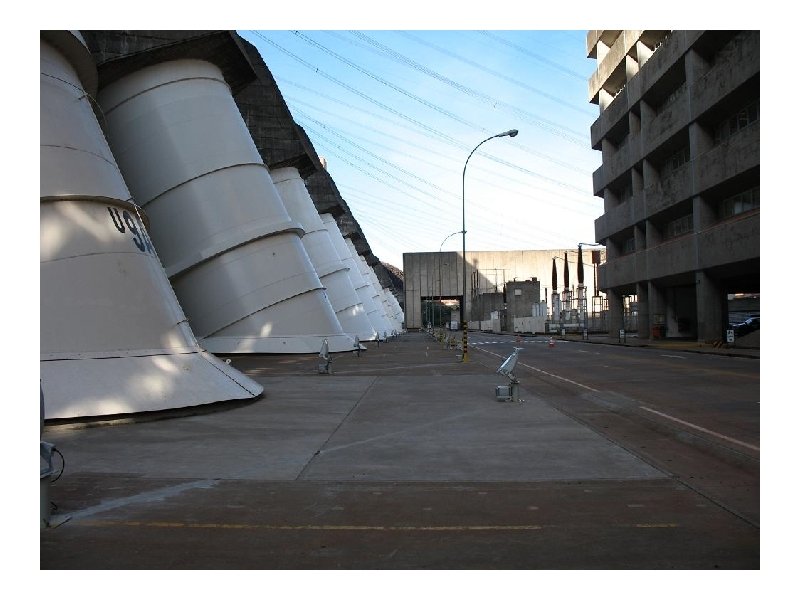
Hydroelectricity

The dead sea canal potential
![World hydroelectricity a. Installed capacity: 770[GW] a. 90% of renewable energy electricity production. b.](https://present5.com/presentation/be57d0bd3bb6f740854091c28f1ffc3d/image-24.jpg "World hydroelectricity a. Installed capacity: 770[GW] a. 90% of renewable energy electricity production. b.")
World hydroelectricity a. Installed capacity: 770[GW] a. 90% of renewable energy electricity production. b. 20% of world electricity production.

Wind power
![World wind power a. Installed capacity - 200[GW] a. Actual production is ~ 20%](https://present5.com/presentation/be57d0bd3bb6f740854091c28f1ffc3d/image-28.jpg "World wind power a. Installed capacity - 200[GW] a. Actual production is ~ 20%")
World wind power a. Installed capacity - 200[GW] a. Actual production is ~ 20% due to intermittency. b. 2. 5% of world electricity production.

Solar energy

Geothermal installed capacity of 10 GW for electricity. about 28 GW used for heating. considered sustainable. US Philippines and Indonesia are largest.

Thank you
be57d0bd3bb6f740854091c28f1ffc3d.ppt