6ad4b712f54d506db4c0e2fd09087919.ppt
- Количество слайдов: 86


Why the Public Sector needs GOOD HRM?

Questions Which cricketer holds the record for most amount of ducks in ODIs? Which Batsmen has been Run out the most in ODIs?

Ducks 29 Run outs 41 3

A Brain was on Auction whose Brain fetched the best price? • • Doctor Lawyer Politician Teacher Policeman Public Servant HR Manager 4

The Brain that fetched the best price • Teacher • Why? ? 5

Comments from Senior Public Servants There is NO HRM We have no HR Managers Training is non existent Training needs to be linked to performance People are not rewarded for performance No sharing of knowledge No grooming, mentoring or Coaching ? ? ? 6

HR IN THE PUBLIC SECTOR? 7

STRUCTURE 1. The Political, economic, tech and social Environment around us 2. what to expect in the next 1 - 5 y? 3. How good HR can help the Public Sector

Sri Lanka 2020 $150 B Economy? Services Hub Services % of GDP 59. 2% • Wholesale/Retail trade 21. 5% • Transport and communication 13% • Banking and Insurance 11% • Hotels /Restaurants 1. 0% New opportunities for Jobs will be in the tourism, education, financial services and manufacturing sector

Population Pyramid 2008, 2010, 2025 & 2050 Aging Population, gender balance. Shrinking population

Population Growth in Sri Lanka In year 1871, 2. 4 Million 54 years In year 1925, 4. 8 Million 35 years In year 1960, 9. 6 Million 43 years In year 2003, 19. 2 Million In year 2013, 20. 89 Million Very Disciplined society 10 years 10 y – 1. 7 11
 Age")
Change of the Age Structure in Sri Lanka Year 70 Age group (%) Age 60+ Age 15 -59 Age <15 60 1971 6. 3 54. 7 39 50 1981 6. 6 58. 2 35. 2 2001 9. 2 64. 5 26. 3 2012 12. 2 62. 0 25. 8 2016 14. 5 64. 2 21. 3 20 2021 16. 8 63. 8 19. 4 10 2031 20. 7 63. 2 16. 1 0 2041 24. 8 60. 0 15. 2 40 30 1971 1981 Age 60+ 2001 2012 2016 Age 15 -59 2021 2031 2041 Age <15 12

EDUCATION LEVELS Increase in skills has a direct impact on poverty alleviation

Education Attainment in Sri Lanka has fallen behind Korea and Malaysia (comparison of 1960, 1980, 2000, 2010) Sri Lanka in 1960 s had a higher educational attainment than Malaysia and Korea. a But in 2010 Sri Lanka is behind. Sri Lanka Malaysia Title of Presentation 14

Compared to other countries with similar levels of development, Sri Lanka spends a much lower share of its income on education. Public Education Expenditure as % of Total Government Expenditure 40 Thailand 35 Korea, Rep. 30 25 South Africa Mexico Malaysia Indonesi a 20 15 Chile 10 Sri Lanka Brazil 5 0 -5 0 10, 000 20, 000 30, 000 GDP per Capita, PPP 15

Education Spend % GDP South Asia 2. 1 Sri Lanka 1. 4 India 3. 4 Pakistan 2. 1 Increase to 6% by 2020
 Innovation Index Sri Lanka 3. 63 3. 06 Thailand")
Competitiveness Country Knowledge Economy Index(KEI) Innovation Index Sri Lanka 3. 63 3. 06 Thailand 5. 21 5. 95 Malaysia 6. 10 6. 91 Korea Rep. 7. 97 8. 80 Hong Kong 8. 52 9. 10

OVERALL EMPLOYEE RELATIONS CLIMATE IN-COUNTRY Impacts FDI DIFFICULT PHILS SOUTH KOREA SRI LANKA EASY INDONESIA MALAYSIA SINGAPORE PAKISTAN EASY THAILAND SITUATION WITHIN companies FR DIFFICULT INDIA BANGLADESH

Top 10 Jobs in demand for 2015 1. Software and Web Developers 2. Accountants and Auditors 3. Marketing Specialists 4. Bankers and Risk Managers 5. Civil Service 6. Human Resource Specialists 7. Sales Representatives 8. Engineers (industrial and mechanical) 9. Network and System Administrators 10. Mobile and Social Media Experts *People 2015

What are the sectors you like to join? 19 -24 y 1. Banki ng 2. Accou nting Servic 1. Telecoms 2. Banking 3. FMCG MNCs 4. Public Sector 5. Manufacturing 6. Technology 7. BPOs 8. Garments 9. MNC Pharmaceuticals 10. Military 2010 Profile of the group AL’s, Professionally qualified and Graduates

What employees look for from a 1. Salary company 2. Incentives 3. Car 4. Training 5. Company Reputation 6. Technology Environment 7. Flexi work hours 8. Career Advancement 9. Respect from the Boss 10. Benefits- Mobile Phone, medical 11. Oversees travel Copasia 2016

Workforce Challenges ØOver 250, 000 students sit for the GCE A/L. Only 9% or 25, 000 students get admissions to the university leaving out 225, 000 students ØNearly 60% of the students who sit for the exam satisfy the minimum requirement. That is around 150, 000 students ØNo. of graduates per year is around 12, 000 to 13, 000 What happens to the rest? 22
 8, 000 7, 000 6, 900")
Graduates per Year (breakup of the 12, 000) 8, 000 7, 000 6, 900 41. 00% 6, 000 5, 000 4, 000 2, 700 3, 000 17. 00% 2, 000 1, 300 1, 000 340 8. 00% 1, 100 2. 00% 6. 00% 211 1. 00% 65 0. 39% 58 0. 35% Art Studies Commerce & MGT studies Law Engineering Medicine Architecture & Quatity Survey Dental Surgery Veterinary Science Between 1980 and 2012, Sri Lanka's life expectancy at birth increased by 7. 0 years, mean years of schooling increased by 2. 3 years and expected years of schooling increased by 2. 7 years. We need more seats 23

Employment by Discipline Art External 56. 9% 12. 6% 35. 8% Other 22. 0% 68. 4% Engineering 23. 8% 8. 6% 95. 1% Medicine 65. 0% 31. 5% 3. 3% 15. 1% 18. 4% 22. 0% 4. 9% 89. 9% Management Arts 27. 7% Employed Under employed 5. 5% Unemployed 19. 5% No Response 48. 6% Science 68. 7% 8. 1% 22. 6% Agriculture 69. 5% 7. 3% 23. 2% 0. 0% 20. 0% 40. 0% 60. 0% 80. 0% 100. 0% 120. 0%

Gender Ratio in Sri Lanka Males Females 140 120 100 80 60 40 * Census 2012 =94. 3 20 0 1971 1981 2001 2011 Female participation in the labour market is very low despite Women are now better educated and ready to take on roles 25

Participation gap World Female labour participation rate Male labour participation rate East Asia South Asia Sri Lanka 48% 4% 48% 64% 4% 33% 2% 65% 38% 8% 54% 73% 5% 22% 75% 4% 21% 78% 4% 18% 81% 4% 15% Employed PUBLIC Unemployed Inactive

Women earn more degrees than men 59% 54% 57% 66% G 20 EU 2 OECD Sri Lanka PUBLIC

Advancement gap: Women in top management Women holds 1 in 5 Fortune 500 CEOs Senior management roles globally 35% Norway PUBLIC 3% 11% UK Senior Management. World 15% 6% Asia 5% Sri Lanka

Technology Trends • 4. 5 Billion page views a day on YOUTUBE. Sri Lanka? • Facebook has over 1 Billion active users (SL 1. 8) • Over 35 million banking customers globally are managing their money on cell phones • Mobile wallet last year was predicted to be worth $12. 5 Billion. • In Kenya 18 million people moved 20% of their GDP via simple text messages • 550+ million devices are connected to the internet. By 2020 it will be 20 billion****. • 150 Mil Apple Ipads (tablets) have been sold by the end of March • Smartphones are turning governments upside down and becoming a tool to engage talent and do business *****

TECHNOLOGY • • • Will give you the Reach at very low cost Low cost access to areas with labour cost arbitrage Gen Y cannot live without it Commerce is dependant on it Will help Remove repetitive, routine, and mundane jobs Social Media is a way of life Critical for reputation management Is driving Channel migration Improves Access to Customers Mobile Cash will be a way of life The next 5 years –the Internet & Social Media revolution will transform how we do Business.

Workforce with Different Values Traditionalist § Conformity § Stability § Upward mobility § Security § Economic success Born 1928 -1945 © 2008 The RBL Group. All Rights Reserved Boomer § Personal and social expression § Idealism § Health and wellness § Youth Born 1946 -1964/5 Generation X § Free agency and independence § Street-smarts § Friendship § Cynicism § Anti institution Born 1965/6 -1976 -80 Generation Y § Hope about future § Collaboration § Social activism § Goal oriented § Tolerance for diversity § Family centricity Born 1980 -2000 31
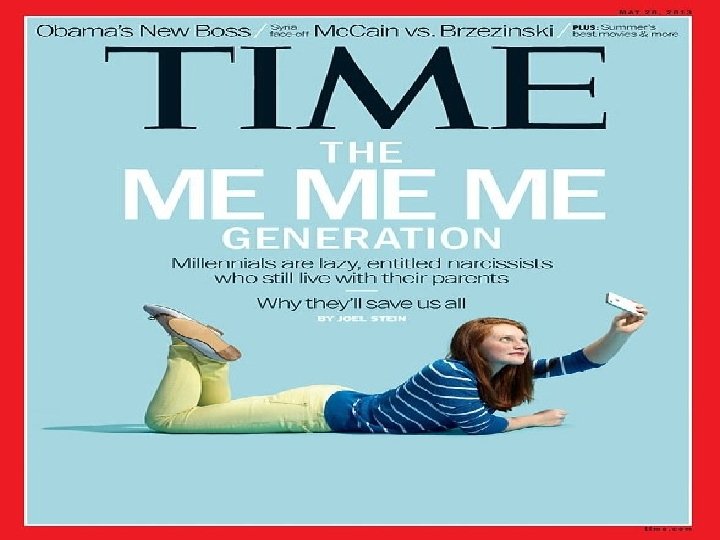

Who are Millennials? v The group of individuals who are born between 1980 and early 2000 s. v. Millennials are an impatient bunch: They’re hyper-connected, tech savvy, entrepreneurial, and collaborative.

Entitled and Hardworking v Millennials are strongly motivated to do interesting work but not repetitive work and will be extremely frustrated by unnecessary work. v They have a strong desire to contribute and will be more engaged about the work, if they are being encouraged by the manager by providing specific opportunities. v Millennials think they should be allowed to make their own hours at work. They prefer a flexible approach such that, as long as the work gets done, the amount of time spent in the office shouldn’t matter.

In Conclusion… q Millennials, who have come of age with the text message and social media: favor fast-paced work environments, want quick promotions, and aren’t fans of traditional office rules and hierarchies. q Millennials want to do interesting work with people they enjoy, for which they are well paid, and still have enough time to live their lives as well as their work.

what to expect next 1 - 5 y?

What to expect Retirement Age Increasingly in every market and country we will see people delaying retirement and staying longer in the workforce. This can choke the pipeline for young people More women in the workplace This decade will see continuing focus on not only bringing more female bodies into the workplace, but rather bringing a female influence as well. This might be the biggest change in corporate culture in a century. Mismatch in Skills For many years, the number of engineers has been declining (especially civil and mechanical engineers). The number of legal and accounting graduates has been increasing, but the number of jobs available for them has been flat, leading to more and more young people working in careers for which they were never formally trained. Over the next decade, nearly 30% adults will obtain a college degree, but 60% of the new jobs will require knowledge beyond a college degree.

What to expect Significant increase in startups and small businesses Both unemployed young people and an older generation looking for post-career alternative working options will fuel a new wave of startup businesses. Flexible working arrangements We will continue to see the breakdown of the 'traditional' office, with 'normal' office hours. People develop 'portfolio careers' or have multiple consulting engagements at a time. The in bound of skilled talent will play a much bigger role in shaping the skilled work force, especially for emerging markets. Life span of skills will get shorter by the day

What to expect Job losses among knowledge workers and professionals, due to artificial intelligence automating complex but essentially repetitive/rigid jobs - the increase in computing power will continue at pace this next decade, and that will push computers ever closer to real artificial intelligence. Lastly, Intergenerational Conflicts in the work place Multiple generations will have to learn to work together.

Why HR What do you mean by HRM? What is Good HR?


HRM

“How much more does a A performer generate annually than a C performer? ” Mean of responses from 410 corporate officers Source: Mc. Kinsey’s War for Talent survey of 410 corporate officers in 35 large US companies 67% 49% 40% Increased productivity in operation roles Increased profit in CEO roles Increased revenue in sales roles

4. Talent should match people and positions Match key players to key positions Key positions C B A Key Players © 2008 The RBL Group. All Rights Reserved * B C A * * 45

Salary Temperature Index • I am not currently looking for a new job (20 - 0) • Our rewards reinforce a high performing culture. (0 -10) • I receive ongoing development that helps me to achieve my yearly objectives and realize potential. (0 -10) • I don’t think the market salaries are higher (20 - 0) • I don’t feel the top management is over paid. (10 - 0) • There is a clear relationship between performance and Pay - (0 - 20) • Our pay structure is transparent in intent and simple in design (0 -10) (Maximum Total 100)

Salary Temperature Index • • Below 40 40 - 60 65 - 80 81 - 100 - - BAILED Out Looking Out Happy Zone Tango Zone

People don’t join companies only fro the Cash and Perks. . EVP Cop. Asia 2015 Reputation of the Organization / Support from Supervisor 39% Pay, Perks & Benefits - 31% Training & Development Culture/Work Practices/ Opportunities Processes 13% 15% n & Benefits

WHAT ARE THE GOOD HR PRACTICES THAT THE PUBLIC SECTOR NEEDS?

Good HR 1 ENTRY 2 Recruitment, Selection, Induction and job fit Performance Management • Job Profiles & Advertisements • Performance Apprisals and Rewards • Objective Setting Business Execution • Recruitment Tools Management Processes Functional & Technical Excellence Specialist Skills 4 Leadership Accessing Potential Learning & Development Talent Management • Continuous Self Development • Talent Review • Management Development • Career Planning • leadership Development *for IMPACT Build round these four buckets • Succession Planning • Talent Retention 3

1 © 2008 The RBL Group. All Rights Reserved HIRE THE RIGHT TALENT 51

To get Hired. . What Employers look for when Hiring? Qualifications- 40% The balance 60% Technology Literacy* Values Attitudes Ability to learn and grow* Ability to communicate effectively* Self confidence Cop Asia Survey Sri Lanka survey 2014

1. Performance Management Does your Institution tie pay to performance? 10% Y 69% N 10% ? ? ?
")
PERFORMANCE MANAGEMENT Framework Mission & Values CEO Objectives Development Planning (Skills, Knowledge & Competencies) Career/Succession Planning HOD Objectives = Company = department Individual Objectives/Targets Performance Review June and Dec Performance Rewarding T N ME RE INCE NTIV ES

2. PERFORMANCE MANAGEMENT REWARDS

WHY REWARDS? A robust Rewards strategy can drive desired Results and impact the results positively

Compensation Strategy Maintain a base pay at 50 th percentile of market & use variable pay to push total earnings to the 65 th percentile and 75 th percentile for high performing staff. Basic Pay 1 2 Variable Pay Performance Based Variable Reward Methodology Individual Performance Functional Performance Company Performance 50 th 3 Total Cash 75 th Grade A 50 th Grade B

Executive M 4 Scale Rs 71, 000 Achieving SUSTAINED PERFORMANCE Rs 90, 000 OUTSTANDING Rs 53, 000 EXCEEDING Rs 40, 000
")
3. TALENT MANAGEMENT (Attract, Retain , Develop and Motivate)

3. TALENT MANAGEMENT RETENTION OF TALENT

Engagement and Attrition Employee Engagement High Engagement / No Maintenance High Engagement / Low Maintenance Constant Monitoring and Maintenance Low Engagement / High Maintenance Time Spent in the Organization

To stay hired Your next Promotion depends on; management judgement measured by: • • • Performance in current role Speak with Impact- get your message across Analytical ability- resolve problems Emotional Maturity Strategic thinking – see the big picture Manage others

4. TALENT DEVELOPMENT

CAREER PATH – ACCOUNTANCY Graduates • CEO • CFO • Finance Manager C JOBS • Chief Accountant • Director SENIOR MANAGER • Planning Manager MANAGER ENTRY • Financial Controller • Management Accountant • Senior Finance Manager • Financial Analyst • Treasurer • Management Trainee • Accounts Clarks DW

Talent = competence * commitment * contribution Contribution Person Competence © 2008 The RBL Group. All Rights Reserved Commitment 65

Critical Career Passages in a Large Business Organisation
 • Work related knowledge, skills, tools and processes. Behavioral")
Talent Development Knowledge (Hard Skills) • Work related knowledge, skills, tools and processes. Behavioral (Soft Skills) • Employees’ selfconfidence, awareness, intuition, motivation, leadership and creative thinking. SUCCESS Problem Human Resource Development (HRD) programs’ focus. ‘ 67

Grow/Build Talent Train or Develop talent through education, formal job training, job rotation, job assignments, and action learning. 30 – 50 – 20 30: Replace training with action learning • Invest in action learning, . . . attended by teams who work on similar issues with a focus on applying content to making progress on real business problem • Invest in skills based experiences. . . attended by individuals at a particular level in the organization with a focus on the skills required at that level 50: Work experience • Have coaching for leaders • Use temporary project assignments, e. g. , task teams, community leadership, etc. around geography, business, people, etc. • Use full time development assignments within company and outside company • Give visibility opportunities, e. g. , presentation to senior management 20: Life experience • Engage in non-work leadership (club, association) • Encourage lifetime learning • Share experiences

Training vs Development top 200 Executives in 50 large US Companies Formal training Feedback & mentoring On-the-job training COMPANY values H 80 70 60 Ways jobs are structured Special projects 50 Speed of job moves 40 Traditional external training 30 Formal performance evaluation Role models 360° feedback Traditional internal training 20 Individual learning Non-traditional learning programs 10 0 10 Mentoring Development plans Outside testing 0 Job rotation Total strengths & weaknesses Informal coaching & feedback 20 30 40 50 60 70 EMPLOYEE Values 80 90 H Source: How Executives Grow

Performance/Potential Matrix Potential >=2 steps >=1 step Right for or untested in current role Shows high potential and strong ambition to pursue personal growth opportunities but current performance level does not match ability Shows good potential and desire for personal growth but current performance level does not match ability Shows some potential or potential may be unproven Performance does not match and may have lost some momentum Meeting Objectives Shows high potential and strong ambition to pursue personal growth opportunities Is performing well in current role but may need continued support to maintain & enhance this Shows good potential and desire for personal growth and is performing well in current role - needs to be given continued support to maximise contribution Shows some potential or potential may be unproven Is performing well in current role but requires continued support to maintain performance Exceeding objectives Shows high potential and is excelling in current role currently challenging the organisation to provide growth opportunities. Shows good potential and desire for personal growth and is excelling in current role Shows some potential or potential may be unproven Excelling in current role but not demanding growth opportunities Excelling & challenging to drive business results

MY MESSAGE TO YOU “career/professional development is employee owned, manager facilitated and organisation supported” SELF Ownership Individuals take responsibility for their own in- role development planning and career planning. MANAGER Facilitation Line Managers provide support by identifying gaps and how to close them. They are accountable for this and rewarded accordingly ORG-Support Organisation/HR provide processes, information, tools, and resources to employees to support their in role development planning and career planning. DW *Companies do not have money to train everyone, self development i

Technology is re-inventing education Educating Yourself to expand the brain free…. . Khan Academy- Library of over 4100 educational videos Khanacademy. org Wikiversity- Open educational resources En. wikiversity. org TED Talks- Videos of more than 1400 talks from the world’s greatest thinkers ted. com Companies are saving millions by using these resources

Khanacademy. org Salman Amin "Sal" Khan is the founder of the Khan Academy, a free online education platform and nonprofit organization. His videos have been viewed over 300 million times

 TREAT others like you would like to be treated… 2)")
So: Stay Focused: 1) TREAT others like you would like to be treated… 2) DO / BE your BEST, with PASSION, engaged… 3) ATTITUDE is more important than everything… 4) DECIDE!!! It’s better to be wrong than to do nothing! 5) Embrace the CHANGE / CHALLENGE…. 6) Keep LEARNING!!! This is what keeps YOU ALIVE Success 1 st ….

Q&A 76

Thank you 77
 Car - 8 - 20 million")
Perks and Benefits CEO (MBA+FPQ+ 10 y GME) Car - 8 - 20 million Housing 100, 000 p. m Entertainment- 20, 000 p. m Club- Rs 100, 000 p. a Professional Memberships Laptop, Loans and Mobile Holiday Travel I y Medical UL and Life Cover 3 -5 Publication- Time or Fortune HOF (MBA+FPQ+5 SME) Car - 5 - 10 million Housing/utilities 50, 000 p. m Entertainment- 15, 000 p. m Club- Rs 75, 000 p. a Professional Memberships Laptop. Loans and Mobile Holiday pay Medical OPD 20, K SHE 100 K Life Cover Rs 1 -3 m Publications- Time or Fortune Source; Cornucopia Survey 2015 Industry in line?

Perks and Benefits Manager Car - 3 - 7 million Utilities 5, 000 to 20, 000 p. m Entertainment- 5, 000 p. m Club- Rs 25, 000 p. a - 75, 000 p. a 1 Professional Membership Mobile Holiday Pay Medical OPD 20 k , SHE 75, 000 and Life Cover 1 -2 m Industry in line? Executive Car Loan 200 k- 4 million Club- Rs 5, 000 - 20, 000 p. a 1 Professional Membership Official Mobile Medical OPD 10, K SHE 50 K Life Cover Rs. 5 -2 m Exam Reimbursement Source; Cornucopia Survey 2015

What to expect Job losses among knowledge workers and professionals, due to artificial intelligence automating complex but essentially repetitive/rigid jobs - the increase in computing power will continue at pace this next decade, and that will push computers ever closer to real artificial intelligence. Lastly, Intergenerational Conflicts in the work place Multiple generations will have to learn to work together.

Wage Increases- SL 50 th • • 2012 2013 2014 2015 10% 11% 09% 08% 65 Th 12% 10%

Graduates per Year 8, 000 7, 000 6, 900 41. 00% 6, 000 5, 000 4, 000 2, 700 3, 000 17. 00% 2, 000 1, 300 1, 000 340 8. 00% 1, 100 2. 00% 6. 00% 211 1. 00% 65 0. 39% 58 0. 35% Art Studies Commerce & MGT studies Law Engineering Medicine Architecture & Quatity Survey Dental Surgery Veterinary Science Between 1980 and 2012, Sri Lanka's life expectancy at birth increased by 7. 0 years, mean years of schooling increased by 2. 3 years and expected years of schooling increased by 2. 7 years. We need more seats 82

Workforce Challenges ØOver 250, 000 students sit for the GCE A/L. Only 9% or 25, 000 students get admissions to the university leaving out 225, 000 students ØNearly 60% of the students who sit for the exam satisfy the minimum requirement. That is around 150, 000 students ØNo. of graduates per year is around 12, 000 to 13, 000 83

What to expect Retirement Age Increasingly in every market and country we will see people delaying retirement and staying longer in the workforce. This can choke the pipeline for young people More women in the workplace This decade will see continuing focus on not only bringing more female bodies into the workplace, but rather bringing a female influence as well. This might be the biggest change in corporate culture in a century. Mismatch in Skills For many years, the number of engineers has been declining (especially civil and mechanical engineers). The number of legal and accounting graduates has been increasing, but the number of jobs available for them has been flat, leading to more and more young people working in careers for which they were never formally trained. Over the next decade, nearly 30% adults will obtain a college degree, but 60% of the new jobs will require knowledge beyond a college degree.

What to expect Significant increase in startups and small businesses Both unemployed young people and an older generation looking for post-career alternative working options will fuel a new wave of startup businesses. Flexible working arrangements We will continue to see the breakdown of the 'traditional' office, with 'normal' office hours. People develop 'portfolio careers' or have multiple consulting engagements at a time. The in bound of skilled talent will play a much bigger role in shaping the skilled work force, especially for emerging markets. Life span of skills will get shorter by the day
 50 th • • CEO- ? ?")
Compensation Practices -FP Regular Scales for (Rs) 50 th • • CEO- ? ? ? HOD- 400, 000 pm HOS - 300, 000 pm SM - 200, 000 pm Mgr- 150, 000 pm AM 70, 000 pm MT/Exe- 50, 000 pm Top Salaries 75 th • CEO- ? ? ? • CMO/HOF 800, 000 pm • SM 600, 000 pm • Mgr 300, 000 pm
6ad4b712f54d506db4c0e2fd09087919.ppt