Tonutti Moscow oct2013.pptx
- Количество слайдов: 44


Why and how to publish scientific papers in international journals: goals, tools, impacts, parameters Prof. PIETRO TONUTTI SCUOLA SUPERIORE SANT’ANNA, PISA; ITALY

“Publish or Perish” This phrase is of course exaggerated But realistically, however good your research is or may be, and however important your next paper will be (and everyone believes that their next paper will be their best), success in most areas of science rests on what you have published

• The real pleasure of science is DISCOVERY and if the discovery is not reported/communicated/diffused has no or limited meaning/value -While science is (mainly) a personal activity, its ultimate success depends on collec efforts, on their achievements and interactions of a vast (international) community o scientists nowadays working in all Continents. -Progress in science depends on sharing ideas, technological developments and scientific discoveries, all of which depends on communication and dialogue between scientists across the world. -Communication through publications is essential for advancements in science, but i is equally important for individuals. For most scientists publication is an essential par of a scientific career (promotions, grants) and related-options (e. g. to be invited to participate in International conferences, give seminars, lecturing as visiting professor -The problem is that it is not just publishing that is important, it is also what, when and how you publish

• Our reserach and scientific discoveries must be read by the largest number of scientists/colleagues. • How can we reach them? How can a scientist be aware of the new research and discoveries in the specific field of interest? • In the past: The collection of abstracts (big books, time-consuming procedure)

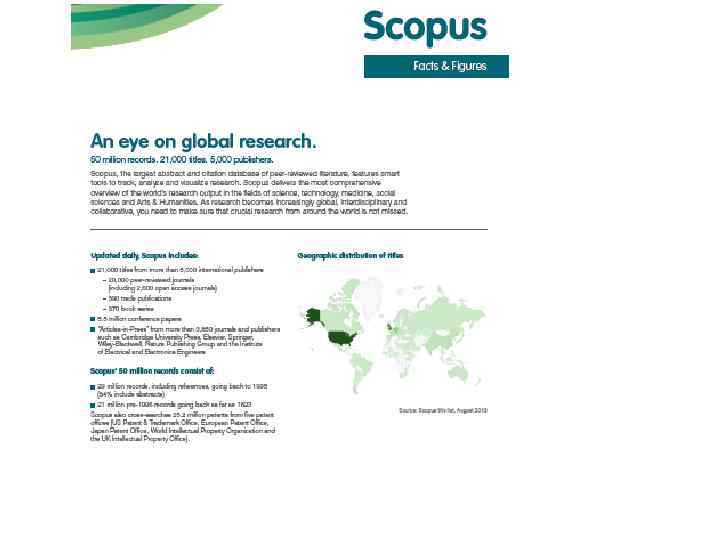
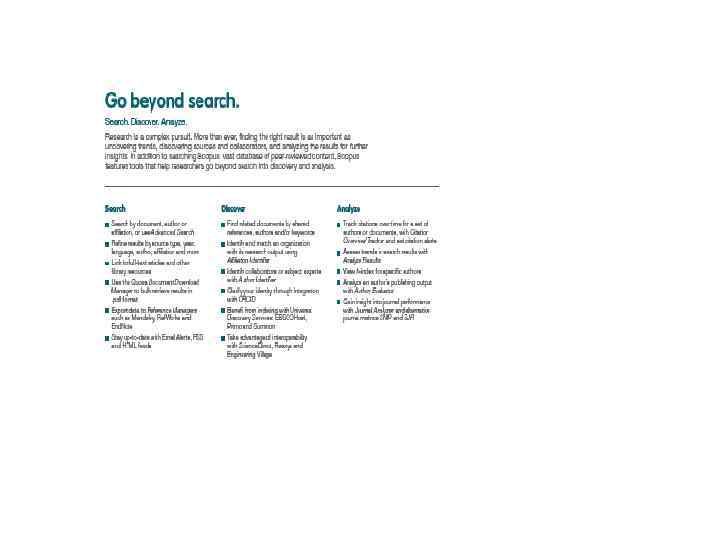
• Nowadays: Databases to be consulted online, quick search, a huge amount of data A number of databases are availbale (some of them specilalized in specific areas/topics), few of them covering most if not all scientific disciplines: - ISI Web of Science - Scopus
 Web of Science® provides researchers, administrators, faculty, and students")
Web of Science (Thomson Reuters) Web of Science® provides researchers, administrators, faculty, and students with quick, powerful access to the world's leading citation databases. Authoritative, multidisciplinary content covers over 12, 000 of the highest impact journals worldwide, including Open Access journals and over 150, 000 conference proceedings. You'll find current and retrospective coverage in the sciences, social sciences, arts, and humanities, with coverage to 1900. Overcome information overload and focus on essential data across more than 250 disciplines.

The QUALITY of the JOURNALS THE IMPACT FACTOR, IF In a given year, the impact factor of a journal is the average number of citations received per paper published in that journal during the two preceding years. The JCR (Journal Citation Report) provides quantitative tools for ranking, evaluating, categorizing, and comparing journals. The impact factor is one of these; it is a measure of the frequency with which the "average article" in a journal has been cited in a particular year or period. The annual JCR impact factor is a ratio between citations and recent citable items published. Thus, the impact factor of a journal is calculated by dividing the number of current year citations to the source items published in that journal during the previous two years Calculation for journal impact factor. A= total cites in 2012 B= 2012 cites to articles published in 2010 -11 (this is a subset of A) C= number of articles published in 2010 -11 D= B/C = 2012 impact factor

THE IMPACT FACTOR, IF A correct way to use IF is , as its creator (Eugene Garfield in the 1970’s) intended, a TOOL for research libraries to judge the relative merit of scientific journals to intelligently spend their limited subscription budget. It must be considered a measure of the overall journal quality. The IF is NOT (and should not be used for) a measure of the quality of individual papers and to rank international scientists solely or mainly by the weight conferred by the IF of the journal in which they publish is a mistake. In other words, rating papers on the average ranking of the journal in which they were published is inappropriate considering that: A) It is Discipline dependent, i. e. , it is largerly influenced by the size of the community in a specific field of science

ISI JOURNAL CITATION REPORT Thomson Reuters The impact Factor is, obviously, different when comparing Different journals dealing with different topics and classified In different Subject categories or even Subject sub-categories

Subject Category Number of journals AGRICULTURAL ECONOMICS AND POLICY 15 AGRICULTURAL ENGINEERING 12 AGRICULTURE, DAIRY & ANIMAL SCIENCE 54 AGRICULTURE, MULTIDISCIPLINARY 57 AGRONOMY Median Impact factor (IF) 78 0. 763 1. 075 Aggregate IF 1. 090 3. 160 0. 818 1. 333 0. 638 1. 468 0. 796 1. 482 ECOLOGY 136 1. 940 3. 185 ENTOMOLOGY 187 0. 884 1. 384 FOOD SCIENCE & TECHNOLOGY 124 1. 207 1. 947 HORTICULTURE 32 0. 745 1. 310 PLANT SCIENCE 197 1. 287 2. 639
 It is Discipline dependent, in other words it is")
THE IMPACT FACTOR, IF A) It is Discipline dependent, in other words it is largerly influenced by the size of the community in a specific field of science B) IF is affected by the speed at which papers is published and by the vitality of the domain This means that it is not recommended to compare IF between disciplines and it must be used wisely when applied in funding, appointments, promotions, considerations. (For the Abuse of the IF for promotion and the quality of the research, see DORA, The San Francisco Declaration on Research Assessment at http: //am. ascb. org/dora/) On the other hand, publishing in journal with high IF, besides the prestige (e. g. Science, Nature – Journal with high IF are “selective” characterized by acceptance rates low, less than 10%), represents a good option (in general higher than that of journals with low IF) for the published paper to be read and, possibly cited
 The “h-index” (Citation Index) It")
A more reliable parameter to evaluate articles (and authors) The “h-index” (Citation Index) It represents the number of items that have at least "h" citations. For example, an h-index of 20 means there are 20 items that have 20 citations or more. This metric is useful because it discounts the disproportionate weight of highly cited papers or papers that have not yet been cited. Calculating the h-index Value - The h-index factor is based on the depth of years of your product subscription and your selected timespan. Items that do not appear on the Results page will not be factored into the calculation. If your subscription depth is 10 years, then the h-index value is based on this depth even though a particular author may have published articles more than 10 years ago. Moreover, the calculation only includes items in your product database - books and articles in non-covered journals are not included.
 use of IF and h index")
Exemple of (appropriate? ) use of IF and h index

v. Qr RANKING

v. Qr 2004 -2010 Assessment - Indicators Weight Quality of research products (14 scientific areas) 0, 5 Ability to attract external resources 0, 1 International mobility (In/Out) 0, 1 Internationalization 0, 1 Advanced education courses 0, 1 Financial resources available 0, 05 Improvement 0, 05
 Published items in each year Citations in")
RESEARCH UNIVERSITY (ISI-Wo. S CITATIONS AND PUBLICATIONS) Published items in each year Citations in each year The Scuola Superiore Sant’Anna scientific performances

How the assessment of the Quality of Research Products has been carried out?

The objective of bibliometric criteria • Based on the percentage definition of the grades of research products contained in the Call for VQR: – Excellent: the publication is in the highest 20% of the quality ranking shared by the international scientific community (weight 1); – Good: the publication is in the 60% - 80% segment (weight 0. 8); – Acceptable: the publication is in the 50% - 60% segment (weight 0. 5); – Limited: the publication is in the lowest 50% (weight 0) the objective of bibliometric criteria can be defined as follows: An article chosen randomly in a homogeneous subset of all articles worldwide (as an example, a subject category ISI Wo. S) has a probability of being ranked as excellent, good, acceptable, limited equal to 0. 2, 0. 1, 0. 5, respectively 20
 1/6 1. Given")
ANVUR proposal: Use bibliometry, # of citations (and informed peer review) 1/6 1. Given the article and the journal that published it, identify the Subject Category in ISI Web of Science Compute the cumulative distribution of the IF of all journals in the SC 3. Divide the distribution into 4 zones, characterised by probabilities 0. 2, 0. 1, 0. 5 4. Compute the cumulative distribution of the # of citations for the chosen SC 5. Divide the distribution into 4 zones, characterised by probabilities 0. 2, 0. 1, 0. 5 6. We have now 2 classifications for each paper and the possible cases are represented in a 4 x 4 matrix B C A A B B C C A Citations 2. Bibliometry (IF, …) D D D When both classification w. r. t. bibliometry and citations is the same, the final class is obvious 21
 2/6 1. What")
ANVUR proposal: Use bibliometry, # of citations (and informed peer review) 2/6 1. What if the 2 classifications are different ? Citations – For papers published in 2004 -2008, when the citation impact is (almost) completly developed, we weigh more the classification based on citations For papers published in 2009 -2010, when the citation impact is not completly developed we weigh more the classification based on Bibliometry (IF, …) bibliometry A B C D Old articles A A A B IR C IR D IR A B IR D A IR C D A IR IR D Recent articles Citations – A B A C A D A IR B IR IR C IR IR D D D 22

Area 07, Agricultural Sciences and Veterinary NATIONAL RANKING Large Universities Medium Universities Small Universities Scuola Superiore Sant’Anna Università di Pisa

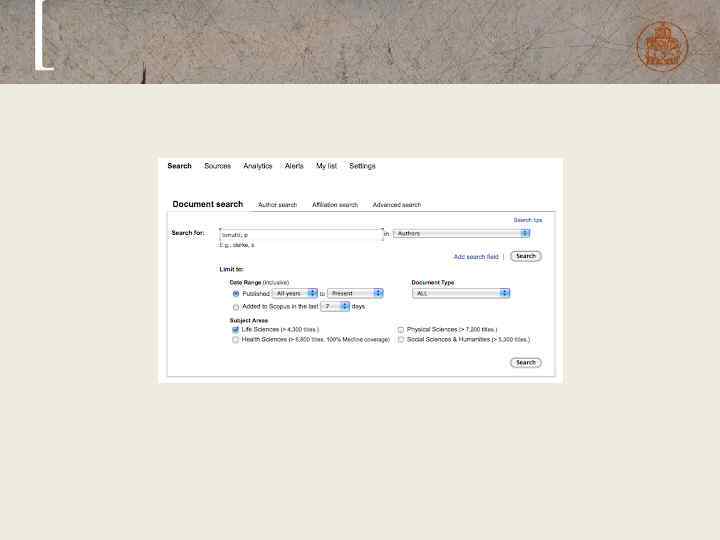
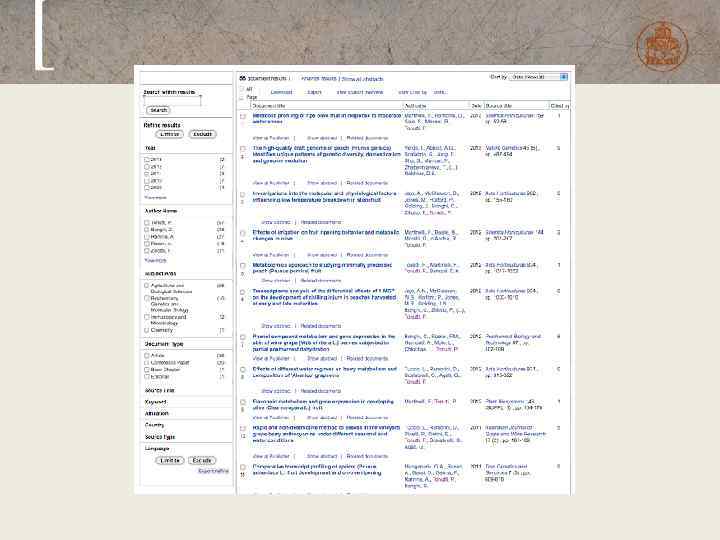
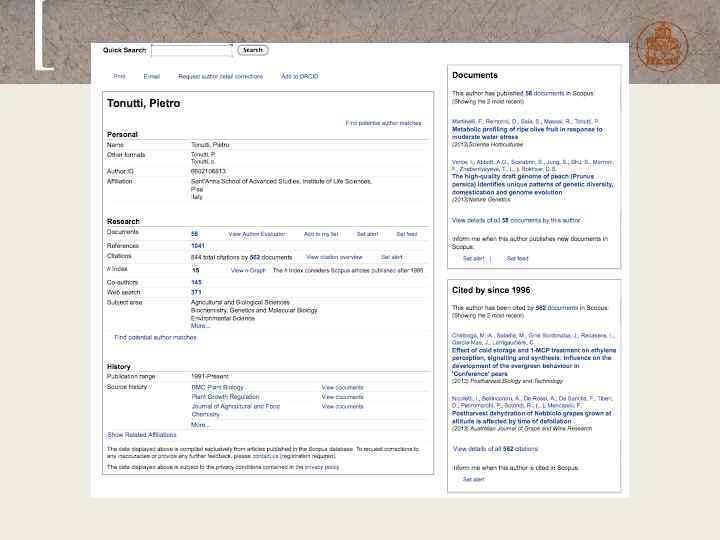
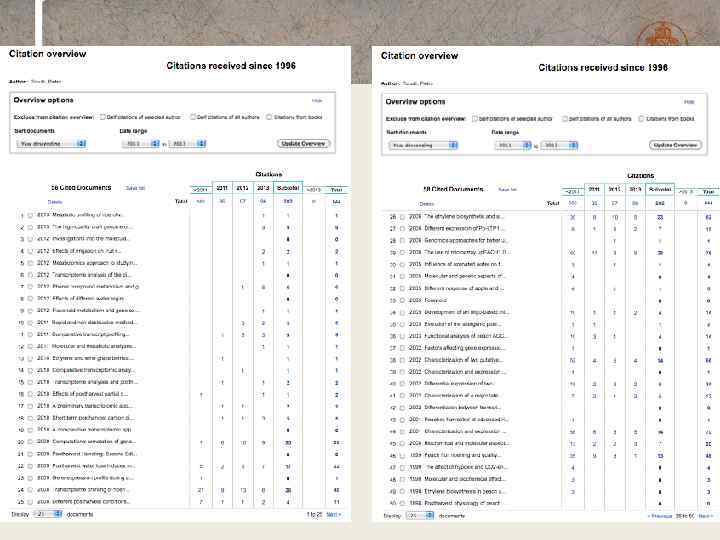
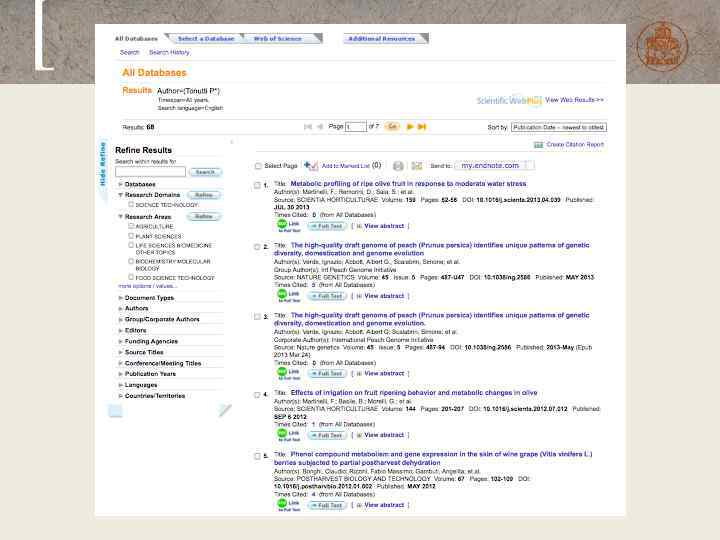
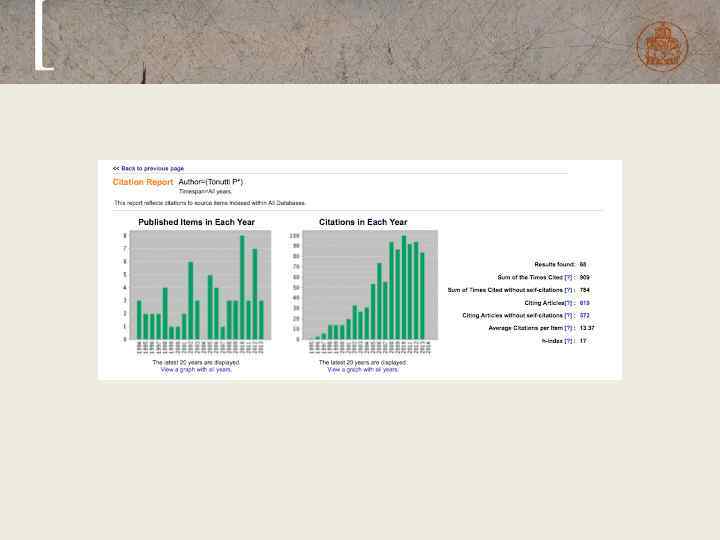
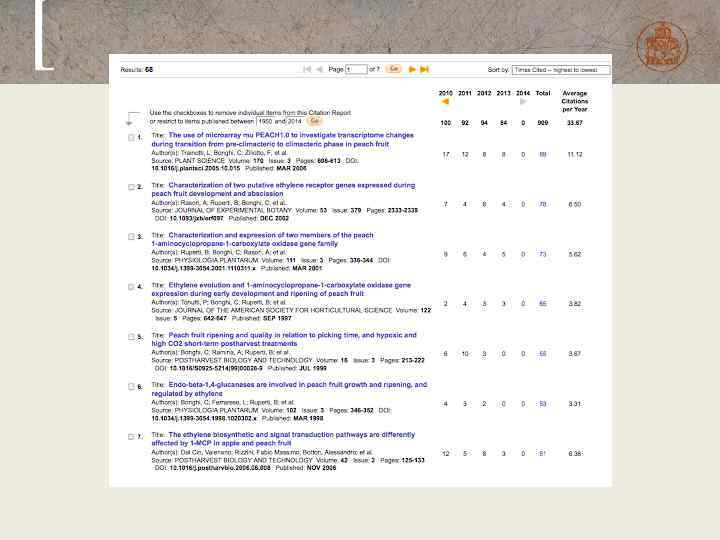
• For this evaluation procedure, Impact Factors and h index have been “extracted” from the Scopus and/or ISI Web of Science databases Example of using these databases 24

Steps and guide-lines for preparing and publishing a paper in Peer-reviewed journals Publishing flowchart: 1. Organize your data in “publication quality” graphs, tables, photographs 2. Evaluate the quality of your data 3. Choose the Journal 4. Read the instruction for authors 5. Search the Journal for articles on similar subjects: the authors are likely to be the reviewers of your own paper! 6. Choose the title of your manuscript (you will change it later…) 7. Authorship! 8. DO NOT write the abstract first! 9. Write the Introduction 10. Write the Results 11. Write the Discussion (evaluate if merging results+discussion is a good choice) 12. Write the Materials & Methods 13. Write figure legends 14. Type the references list 15. Submit the manuscript (usually online) 16. Suggest/exclude reviewers 17. Read the comments of the editor & reviewers 18. Revise the ms and resubmit OR Submit to a different Journal

Make a concept sheet

Preparing your manuscript 1. DO NOT write the abstract first! 2. Write the Introduction 3. Write the Results 4. Write the Discussion (evaluate if merging results+discussion is a good choice) 5. Write the Materials & Methods 6. Now you can write the Abstract! 7. Write figure legends 8. Type the references list

The INTRODUCTION 1. Describe the “state of art” in the field (What is the problem? ) 2. Present the nature and scope of the experiments (Who are the main contributors? Why is it interesting? 3. Briefly describe the principal results of the investigation (no suspense, please) (What novel thing will you reveal? ) The “Result” Section 1. Introduce briefly each experiment description with the reasons behind the decision to carry out the experiment 2. Describe the experiment, but avoid details about the methods used. 3. DO NOT discuss the results, but explain how the forthcoming experiment is logically linked to the previous one 4. You should be ready to distribute materials (antibodies, cell lines) that you produced so that others can replicate your experiments

The “Discussion” session 1. The “Discussion” should not be too long and verbose 2. Discuss your data in relation to other published evidence, in favour or against your findings 3. Extract principles, relationships, generalizations 4. Present analysis, model or theory 5. Try to summarize your conclusions with a graphical model The “Materials & Methods” section 1. The “materials” first 2. Methods should be described in detail when a new method is used 3. Methods should be described at least to make clear the principle of the method when a “WELL KNOWN” method is used 4. Remember that the methods should be described so that others can replicate your experiments

The Abstract -Try for one sentence each on motive, method, key results, conclusions -Do not exceed 3 sentences on any one

Publishing flowchart: 1. Organize your data in “publication quality” graphs, tables, photographs 2. Evaluate the quality of your data 3. Choose the Journal 4. Read the instruction for authors 5. Search the Journal for the topics and articles on similar subjects: the authors are likely to be the reviewers of your own paper! 6. Choose the title of your manuscript (you will change it later…) 7. Authorship! 8. DO NOT write the abstract first! 9. Write the Introduction 10. Write the Results 11. Write the Discussion (evaluate if merging results+discussion is a good choice) 12. Write the Materials & Methods 13. Write figure legends 14. Type the references list 15. Submit the manuscript (usually online) 16. Suggest/exclude reviewers 17. Read the comments of the editor & reviewers 18. Revise the ms and resubmit OR Submit to a different Journal

Postharvest Biology and Technology An International Journal The journal is devoted exclusively to the publication of original papers and review articles on biological and technological postharvest research. This includes the areas of postharvest storage, treatments and underpinning mechanisms, quality evaluation, packaging, handling and distribution of fresh food crops, but excluding research on grains and forage. Articles on the postharvest treatment of fresh products as affecting the eventual quality of processed product may be included, but articles on food processing will not be considered. Papers based on fundamental and interdisciplinary research will be particularly encouraged. These disciplines include genomics and molecular biology, entomology, plant physiology, plant pathology, chemistry, engineering, modelling, advanced technology and economics.

Question asked a PBT reviewer for a manuscript evaluation/acceptance by the Editor 1. Does the subject fall within the general scope of the journal? 2. Is this a new and original contribution? (for review articles this need not necessarily apply. ) 3. Are interpretations and conclusions sound, justified by the data and consistent with the objectives? If the answers to the above three points are positive, then please continue with the following. 4. Does the title clearly reflect its contents? 5. Is the abstract sufficiently informative, especially when read in isolation? 6. Are appropriate keywords given? 7. Is the statement of objectives of the article adequate and appropriate in view of the subject matter? 8. Is the description of materials and methods sufficiently informative to allow replication of the experiment? 9. Are the results clearly presented? 10. Is the organization of the article satisfactory (e. g. no discussion in Results)? 11. Is the article structured in agreement with the Guide for Authors? 12. Does the content justify the length? 13. Are the figures and tables all necessary, complete (e. g. titles) and clearly presented? 14. Are the references adequate and in agreement with the Guide for Authors? 15. Is the English correct and understandable to a multidisciplinary and

Few general considerations/suggestions as conclusion -Publishing in journals covered by the main databases (Scopus, ISI Web of Science, etc. ) is an advantage in terms of spreading the information and make the scientific discoveries available to the international community A) It is often most valuable to look at impact factors within a given field and to publish in the best journal (= high IF) in that field without worring too much about how its Impact factor compares with other areas of research DO NOT FORGET: The acceptance of the very best journals depends not only on very good work but also on its likely interest for a broad readership and/or dealing with a moving rapidly areas of research (the general interest in some cases prevails , in the evaluation process, on the quality of the experiments B) Be realistic and practical about when submitting a paper. Go for a good journal which is likely to be read by those in your field and which publishes high-quality work (this mostly characterizes Journals with high IF)
 Check how long they take to publish by")
Few general considerations/suggestions as conclusion C) Check how long they take to publish by comparing the submission date on the papers with the publication date D) Find out whether any cost of pubblication is applied E) Check the editorial board of the Journal (does it include people who are likely to know your field and make a fair and informed judgement of your work? Search the Journal for articles on similar subjects: the authors are likely to be the reviewers of your own paper

…and considering in particular the IF and the quality evaluation assessement of a scientist • The IF is an index of Journal’s quality • The IF is NOT an index of an article quality • The IF is NOT an index of Scientist’s quality • It is NOT correct to sum the IF of the papers of a Scientist to obtain an index of its ability in research • The number of citations of a specific paper is a better indicator of the quality of that paper • The sum of citation of the papers a scientist have published in the past 10 years is a good indicator of the quality of the scientist

Thank you for your attention……
Tonutti Moscow oct2013.pptx