

8cf47a3ed1643f2ab7a7cb9f9cc5c2d4.ppt
- Количество слайдов: 25
 What is the Greenhouse Effect? How is the temperature of the Earth maintained? What is the Carbon Cycle?
 The Earth’s Energy Balance Greenhouse effect Our atmospheric gases trap and return a major portion of the heat radiating from the Earth. It is a natural, necessary process. 3. 1
 Data in watts
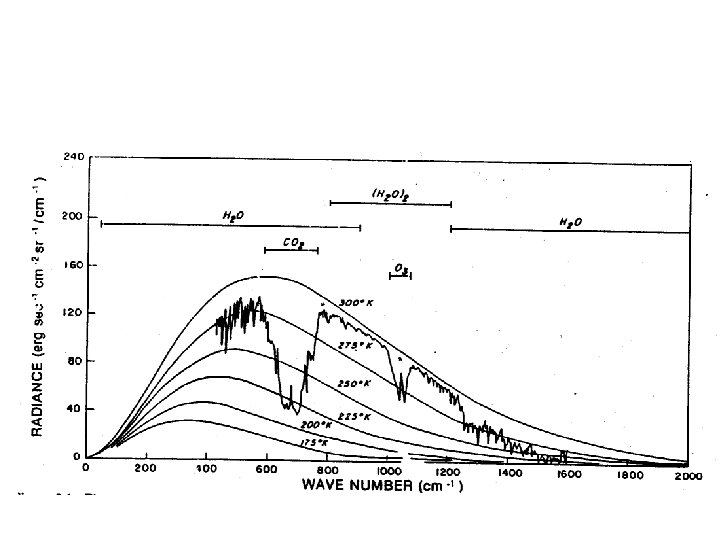
 = 1______ wavelength (mm) 3.") The infrared spectrum for CO 2 Wavenumber (mm– 1) = 1______ wavelength (mm) 3. 4
The infrared spectrum for CO 2 Wavenumber (mm– 1) = 1______ wavelength (mm) 3. 4
 Climate Forcing/Feedback How does Earth stay Comfortable for Us? • Gaia Hypothesis – Biological and Physical Processes Produce Homeostasis • Negative is Good – Feedback control • Positive is Bad – Oscillate out of control
 http: //www. southtexascollege. edu/nilsson/4_GB_Lecture_figs_f/4_GB_16_Homeostasis_Fig_f/Homeostasis_Temp. Control. GIF
 http: //apollo. lsc. vsc. edu/classes/met 130/notes/chapter 16/graphics/neg_feed. free. gif Edited DEH
 http: //apollo. lsc. vsc. edu/classes/met 130/notes/chapter 16/graphics/pos_feed. free. gif
 Ice-Albedo Positive Feedback Temperature increases Less Ice on Surface More Solar Energy Absorbed and less Reflected – Albedo lower
 The carbon cycle 3. 5
 CO 2 emission sources by end use: 3. 5
 Ways to reduce CO 2 Emissions • Where is the Biggest Target? • Where are the Easy Targets?
 Ways to reduce CO 2 Emissions Power Sector • Energy Efficiency – use less • Switch from Coal to Natural Gas -50% red. • Renewable Energy – Solar electric – Solar Thermal – Wind – driven by solar heating of earth – Hydropower – related to solar – Bio. Fuels – solar energy capture • Plant based • Algae based
 Combined Heat and Power • Use “waste heat” • 90 -95% total efficiency 1/3 the CO 2 • Over 200 College and University systems – Yale 60 Megawatt – Electricity – Steam and hot water
 How do scientists study climate? • • Collect data, historical and paleo. Consider physical mechanisms at work Develop models and test them Limitations of science – Can’t prove a positive – Eliminate possibilities – What remains is accepted
 Why is there still a ? • Correlation does not PROVE Causation • Climate Models (GCM’s) Still Imperfect – Cloud Impacts Undertain • Wishful Thinking
 Climate Models are used to predict annual global mean surface temperatures. Test Models with Historical Data Blue bands = predicted temperature range using natural processes Pink bands = temperature range including human influence Black line= observed temperature 3. 9
 Models can also be used to predict future global temperatures. Black line = data for the 20 th century Other lines = projected 21 st century temperatures based on different socioeconomic assumptions 3. 9
 Limitations of Models • Assume linear change • Assume same mechanisms of climate continue to function • Role of clouds not known with certainty • Polar Vortex Collapse • Gulf Stream (Thermo-haline circulation) • Air Transport in Troposphere – Convection cell position
 certified the") Kyoto Protocol – 1997 Conference • Intergovernmental Panel on Climate Change (IPCC) certified the scientific basis of the greenhouse effect. • Kyoto Protocol established goals to stabilize and reduce atmospheric greenhouse gases. • Emission targets set to reduce emissions of six greenhouse gases from 1990 levels. (CO 2, CH 4, NO, HFCs, PFCs, and SF 6) • Trading of emission credits allowed. 3. 11
Kyoto Protocol – 1997 Conference • Intergovernmental Panel on Climate Change (IPCC) certified the scientific basis of the greenhouse effect. • Kyoto Protocol established goals to stabilize and reduce atmospheric greenhouse gases. • Emission targets set to reduce emissions of six greenhouse gases from 1990 levels. (CO 2, CH 4, NO, HFCs, PFCs, and SF 6) • Trading of emission credits allowed. 3. 11
 The Kyoto mechanisms • Emissions trading – known as “the carbon market" • Clean development mechanism (CDM) – Polluters can reduce emissions in developing countries and get credit. • Joint implementation (JI). – Eg. USA could buy forests in Brazil and get credit for carbon sinks
 The Kyoto mechanisms • • Registry System – Record transactions Annual Reports Compliance System Adaptation Fund – Money to help poor countries adapt to Climate Change
 • Copenhagen Meeting – Kyoto expires in 2012 –") Where are we today? (2009) • Copenhagen Meeting – Kyoto expires in 2012 – Kyoto goals not met – US, China, India, and Australia never signed – Need to move forward with new agreement – Can the US-China-India- and Australia join? • Meeting begins with real optimism!
Where are we today? (2009) • Copenhagen Meeting – Kyoto expires in 2012 – Kyoto goals not met – US, China, India, and Australia never signed – Need to move forward with new agreement – Can the US-China-India- and Australia join? • Meeting begins with real optimism!
 Fairness? 3/15/2018 25