

2b2135125d2923f21fb21a3c5f1dcfe3.ppt
- Количество слайдов: 114
 What is Text-Mining? l “…finding interesting regularities in large textual datasets…” (adapted from Usama Fayad) l l …where interesting means: non-trivial, hidden, previously unknown and potentially useful “…finding semantic and abstract information from the surface form of textual data…”
 l l l Abstract concepts") Why dealing with Text is Tough? (M. Hearst 97) l l l Abstract concepts are difficult to represent “Countless” combinations of subtle, abstract relationships among concepts Many ways to represent similar concepts l l E. g. space ship, flying saucer, UFO Concepts are difficult to visualize High dimensionality Tens or hundreds of thousands of features
Why dealing with Text is Tough? (M. Hearst 97) l l l Abstract concepts are difficult to represent “Countless” combinations of subtle, abstract relationships among concepts Many ways to represent similar concepts l l E. g. space ship, flying saucer, UFO Concepts are difficult to visualize High dimensionality Tens or hundreds of thousands of features
 l Highly redundant data l") Why dealing with Text is Easy? (M. Hearst 97) l Highly redundant data l l …most of the methods count on this property Just about any simple algorithm can get “good” results for simple tasks: l l l Pull out “important” phrases Find “meaningfully” related words Create some sort of summary from documents
Why dealing with Text is Easy? (M. Hearst 97) l Highly redundant data l l …most of the methods count on this property Just about any simple algorithm can get “good” results for simple tasks: l l l Pull out “important” phrases Find “meaningfully” related words Create some sort of summary from documents
 Who is in the text analysis arena? Knowledge Rep. & Reasoning / Tagging Search & DB Computational Linguistics Data Analysis
 What dimensions are in text analytics? l Three major dimensions of text analytics: l Representations l l Techniques l l …from character-level to first-order theories …from manual work, over learning to reasoning Tasks l …from search, over (un-, semi-) supervised learning, to visualization, summarization, translation …
 How dimensions fit to research areas? NLP Inf. Retrieval SW / Web 2. 0 ML/Text-Mining Sharing of ideas, intuitions, methods and data Politics Scientific work Represent. Tasks Techniques
 Broader context: Web Science http: //webscience. org/
 Text-Mining How do we represent text?
 Words (stop-words,") Levels of text representations l l l Character (character n-grams and sequences) Words (stop-words, stemming, lemmatization) Phrases (word n-grams, proximity features) Part-of-speech tags Taxonomies / thesauri Vector-space model Language models Full-parsing Cross-modality Collaborative tagging / Web 2. 0 Templates / Frames Ontologies / First order theories
Levels of text representations l l l Character (character n-grams and sequences) Words (stop-words, stemming, lemmatization) Phrases (word n-grams, proximity features) Part-of-speech tags Taxonomies / thesauri Vector-space model Language models Full-parsing Cross-modality Collaborative tagging / Web 2. 0 Templates / Frames Ontologies / First order theories
 Levels of text representations l l l l l Character Words Phrases Part-of-speech tags Taxonomies / thesauri Vector-space model Language models Full-parsing Cross-modality
 Character level l Character level representation of a text consists from sequences of characters… l l l …a document is represented by a frequency distribution of sequences Usually we deal with contiguous strings… …each character sequence of length 1, 2, 3, … represent a feature with its frequency
 Good and bad sides l Representation has several important strengths: l l …it is very robust since avoids language morphology l (useful for e. g. language identification) …it captures simple patterns on character level l (useful for e. g. spam detection, copy detection) …because of redundancy in text data it could be used for many analytic tasks l (learning, clustering, search) l It is used as a basis for “string kernels” in combination with SVM for capturing complex character sequence patterns …for deeper semantic tasks, the representation is too weak
 Levels of text representations l l l l l Character Words Phrases Part-of-speech tags Taxonomies / thesauri Vector-space model Language models Full-parsing Cross-modality
 Word level l The most common representation of text used for many techniques l l …there are many tokenization software packages which split text into the words Important to know: l Word is well defined unit in western languages – e. g. Chinese has different notion of semantic unit
 Words Properties l Relations among word surface forms and their senses: l Homonomy: same form, but different meaning (e. g. bank: river bank, financial institution) l Polysemy: same form, related meaning (e. g. bank: blood bank, financial institution) l Synonymy: different form, same meaning (e. g. singer, vocalist) l Hyponymy: one word denotes a subclass of an another (e. g. breakfast, meal) l Word frequencies in texts have power distribution: l …small number of very frequent words l …big number of low frequency words
 Stop-words l Stop-words are words that from non-linguistic view do not carry information l l l …they have mainly functional role …usually we remove them to help the methods to perform better Stop words are language dependent – examples: l English: A, ABOUT, ABOVE, ACROSS, AFTER, AGAIN, AGAINST, ALL, ALMOST, ALONE, ALONG, ALREADY, . . . l Dutch: de, en, van, ik, te, dat, die, in, een, hij, het, niet, zijn, is, was, op, aan, met, als, voor, had, er, maar, om, hem, dan, zou, of, wat, mijn, men, dit, zo, . . . l Slovenian: A, AHA, ALI, AMPAK, BAJE, BODISI, BOJDA, BRŽKONE, BRŽČAS, BREZ, CELO, DA, DO, . . .
 Word character level normalization l Hassle which we usually avoid: l l Since we have plenty of character encodings in use, it is often nontrivial to identify a word and write it in unique form …e. g. in Unicode the same word could be written in many ways – canonization of words:
 l l Different forms of the same word are usually problematic for") Stemming (1/2) l l Different forms of the same word are usually problematic for text data analysis, because they have different spelling and similar meaning (e. g. learns, learned, learning, …) Stemming is a process of transforming a word into its stem (normalized form) l …stemming provides an inexpensive mechanism to merge
Stemming (1/2) l l Different forms of the same word are usually problematic for text data analysis, because they have different spelling and similar meaning (e. g. learns, learned, learning, …) Stemming is a process of transforming a word into its stem (normalized form) l …stemming provides an inexpensive mechanism to merge
 l For English is mostly used Porter stemmer at http: //www. tartarus.") Stemming (2/2) l For English is mostly used Porter stemmer at http: //www. tartarus. org/~martin/Porter. Stemmer/ l Example cascade rules used in English Porter stemmer l ATIONAL -> ATE relational -> relate l TIONAL -> TION conditional -> condition l ENCI -> ENCE valenci -> valence l ANCI -> ANCE hesitanci -> hesitance l IZER -> IZE digitizer -> digitize l ABLI -> ABLE conformabli -> conformable l ALLI -> AL radicalli -> radical l ENTLI -> ENT differentli -> different l ELI -> E vileli -> vile l OUSLI -> OUS analogousli -> analogous
Stemming (2/2) l For English is mostly used Porter stemmer at http: //www. tartarus. org/~martin/Porter. Stemmer/ l Example cascade rules used in English Porter stemmer l ATIONAL -> ATE relational -> relate l TIONAL -> TION conditional -> condition l ENCI -> ENCE valenci -> valence l ANCI -> ANCE hesitanci -> hesitance l IZER -> IZE digitizer -> digitize l ABLI -> ABLE conformabli -> conformable l ALLI -> AL radicalli -> radical l ENTLI -> ENT differentli -> different l ELI -> E vileli -> vile l OUSLI -> OUS analogousli -> analogous
 Levels of text representations l l l l l Character Words Phrases Part-of-speech tags Taxonomies / thesauri Vector-space model Language models Full-parsing Cross-modality
 Phrase level l l Instead of having just single words we can deal with phrases We use two types of phrases: l l Phrases as frequent contiguous word sequences Phrases as frequent non-contiguous word sequences …both types of phrases could be identified by simple dynamic programming algorithm The main effect of using phrases is to more precisely identify sense
 Google n-gram corpus l In September 2006 Google announced availability of n-gram corpus: l l http: //googleresearch. blogspot. com/2006/08/all-our-n-gramare-belong-to-you. html#links Some statistics of the corpus: l File sizes: approx. 24 GB compressed (gzip'ed) text files l Number of tokens: 1, 024, 908, 267, 229 l Number of sentences: 95, 119, 665, 584 l Number of unigrams: 13, 588, 391 l Number of bigrams: 314, 843, 401 l Number of trigrams: 977, 069, 902 l Number of fourgrams: 1, 313, 818, 354 l Number of fivegrams: 1, 176, 470, 663
 Example: Google n-grams l ceramics collectables collectibles 55 ceramics collectables fine 130 ceramics collected by 52 ceramics collectible pottery 50 ceramics collectibles cooking 45 ceramics collection , 144 ceramics collection. 247 ceramics collection 120 ceramics collection and 43 ceramics collection at 52 ceramics collection is 68 ceramics collection of 76 ceramics collection | 59 ceramics collections , 66 ceramics collections. 60 ceramics combined with 46 ceramics come from 69 ceramics comes from 660 ceramics community , 109 ceramics community. 212 ceramics community for 61 ceramics companies. 53 ceramics companies consultants 173 ceramics company ! 4432 ceramics company , 133 ceramics company. 92 ceramics company 41 ceramics company facing 145 ceramics company in 181 ceramics company started 137 ceramics company that 87 ceramics component ( 76 ceramics composed of 85 l serve as the incoming 92 serve as the incubator 99 serve as the independent 794 serve as the index 223 serve as the indication 72 serve as the indicator 120 serve as the indicators 45 serve as the indispensable 111 serve as the indispensible 40 serve as the individual 234 serve as the industrial 52 serve as the industry 607 serve as the info 42 serve as the informal 102 serve as the information 838 serve as the informational 41 serve as the infrastructure 500 serve as the initial 5331 serve as the initiating 125 serve as the initiation 63 serve as the initiator 81 serve as the injector 56 serve as the inlet 41 serve as the inner 87 serve as the input 1323 serve as the inputs 189 serve as the insertion 49 serve as the insourced 67 serve as the inspection 43 serve as the inspector 66 serve as the inspiration 1390 serve as the installation 136 serve as the institute 187
 Levels of text representations l l l l l Character Words Phrases Part-of-speech tags Taxonomies / thesauri Vector-space model Language models Full-parsing Cross-modality
 Part-of-Speech level l By introducing part-of-speech tags we introduce word-types enabling to differentiate words functions l l l For text-analysis part-of-speech information is used mainly for “information extraction” where we are interested in e. g. named entities which are “noun phrases” Another possible use is reduction of the vocabulary (features) l …it is known that nouns carry most of the information in text documents Part-of-Speech taggers are usually learned by HMM algorithm on manually tagged data
 Part-of-Speech Table http: //www. englishclub. com/grammar/parts-of-speech_1. htm
 Part-of-Speech examples http: //www. englishclub. com/grammar/parts-of-speech_2. htm
 Levels of text representations l l l l l Character Words Phrases Part-of-speech tags Taxonomies / thesauri Vector-space model Language models Full-parsing Cross-modality
 Taxonomies/thesaurus level l Thesaurus has a main function to connect different surface word forms with the same meaning into one sense (synonyms) l l l …additionally we often use hypernym relation to relate general-to-specific word senses …by using synonyms and hypernym relation we compact the feature vectors The most commonly used general thesaurus is Word. Net which exists in many other languages (e. g. Euro. Word. Net) l http: //www. illc. uva. nl/Euro. Word. Net/
 Word. Net – database of lexical relations l Word. Net is the most well developed and widely used lexical database for English l l …it consist from 4 databases (nouns, verbs, adjectives, and adverbs) Each database consists from sense entries – each sense consists from a set of synonyms, e. g. : l l l musician, instrumentalist, player person, individual, someone life form, organism, being Category Unique Forms Number of Senses Noun 94474 116317 Verb 10319 22066 Adjective 20170 29881 Adverb 4546 5677
 Word. Net – excerpt from the graph sense relation sense 26 relations 116 k senses
 Word. Net relations l l Each Word. Net entry is connected with other entries in the graph through relations Relations in the database of nouns: Relation Definition Example Hypernym From lower to higher concepts breakfast -> meal Hyponym From concepts to subordinates meal -> lunch Has-Member From groups to their members faculty -> professor Member-Of From members to their groups copilot -> crew Has-Part From wholes to parts table -> leg Part-Of From parts to wholes course -> meal Antonym Opposites leader -> follower
 Levels of text representations l l l l l Character Words Phrases Part-of-speech tags Taxonomies / thesauri Vector-space model Language models Full-parsing Cross-modality
 Vector-space model level l The most common way to deal with documents is first to transform them into sparse numeric vectors and then deal with them with linear algebra operations l l …by this, we forget everything about the linguistic structure within the text …this is sometimes called “structural curse” because this way of forgetting about the structure doesn’t harm efficiency of solving many relevant problems This representation is referred to also as “Bag-Of-Words” or “Vector-Space-Model” Typical tasks on vector-space-model are classification, clustering, visualization etc.
 Bag-of-words document representation
 Word weighting l l l In the bag-of-words representation each word is represented as a separate variable having numeric weight (importance) The most popular weighting schema is normalized word frequency TFIDF: Tf(w) – term frequency (number of word occurrences in a document) Df(w) – document frequency (number of documents containing the word) N – number of all documents Tf. Idf(w) – relative importance of the word in the document The word is more important if it appears several times in a target document The word is more important if it appears in less documents
 Example document and its vector representation l l TRUMP MAKES BID FOR CONTROL OF RESORTS Casino owner and real estate Donald Trump has offered to acquire all Class B common shares of Resorts International Inc, a spokesman for Trump said. The estate of late Resorts chairman James M. Crosby owns 340, 783 of the 752, 297 Class B shares. Resorts also has about 6, 432, 000 Class A common shares outstanding. Each Class B share has 100 times the voting power of a Class A share, giving the Class B stock about 93 pct of Resorts' voting power. [RESORTS: 0. 624] [CLASS: 0. 487] [TRUMP: 0. 367] [VOTING: 0. 171] [ESTATE: 0. 166] [POWER: 0. 134] [CROSBY: 0. 134] [CASINO: 0. 119] [DEVELOPER: 0. 118] [SHARES: 0. 117] [OWNER: 0. 102] [DONALD: 0. 097] [COMMON: 0. 093] [GIVING: 0. 081] [OWNS: 0. 080] [MAKES: 0. 078] [TIMES: 0. 075] [SHARE: 0. 072] [JAMES: 0. 070] [REAL: 0. 068] [CONTROL: 0. 065] [ACQUIRE: 0. 064] [OFFERED: 0. 063] [BID: 0. 063] [LATE: 0. 062] [OUTSTANDING: 0. 056] [SPOKESMAN: 0. 049] [CHAIRMAN: 0. 049] [INTERNATIONAL: 0. 041] [STOCK: 0. 035] [YORK: 0. 035] [PCT: 0. 022] [MARCH: 0. 011] Original text Bag-of-Words representation (high dimensional sparse vector)
 Similarity between document vectors l l Each document is represented as a vector of weights D =
 Levels of text representations l l l l l Character Words Phrases Part-of-speech tags Taxonomies / thesauri Vector-space model Language models Full-parsing Cross-modality
 Language model level l Language modeling is about determining probability of a sequence of words l The task typically gets reduced to the estimating probabilities of a next word given two previous words (trigram model): Frequencies of word sequences l It has many applications including speech recognition, OCR, handwriting recognition, machine translation and spelling correction
 Levels of text representations l l l l l Character Words Phrases Part-of-speech tags Taxonomies / thesauri Vector-space model Language models Full-parsing Cross-modality
 Full-parsing level l Parsing provides maximum structural information per sentence On the input we get a sentence, on the output we generate a parse tree For most of the methods dealing with the text data the information in parse trees is too complex
 Levels of text representations l l l l l Character Words Phrases Part-of-speech tags Taxonomies / thesauri Vector-space model Language models Full-parsing Cross-modality
 Cross-modality level l l It is very often the case that objects are represented with different data types: l Text documents l Multilingual texts documents l Images l Video l Social networks l Sensor networks …the question is how to create mappings between different representation so that we can benefit using more information about the same objects
 Example: Aligning text with audio, images and video l The word “tie” has several representations (http: //www. answers. com/tie&r=67) l l Textual Multilingual text l l l Audio Image: l l l (tie, kravata, krawatte, …) http: //images. google. com/images? hl=en&q=necktie Video (movie on the right) Out of each representation we can get set of features and the idea is to correlate them l KCCA (Kernel Correlation Analysis) method generates mappings between different representations into “modality neutral” data representation Basic image SIFT features (constituents for visual word) Visual word for the tie
 Text-Mining Typical tasks on text
 Supervised Learning
 Document Categorization Task l l l Given: set of documents labeled with content categories The goal: to build a model which would automatically assign right content categories to new unlabeled documents. Content categories can be: l unstructured (e. g. , Reuters) or l structured (e. g. , Yahoo, DMoz, Medline)
 unlabeled document") Document categorization ? ? ? Machine learning labeled documents document category (label) unlabeled document
Document categorization ? ? ? Machine learning labeled documents document category (label) unlabeled document
 Algorithms for learning document classifiers l Popular algorithms for text categorization: l l l l Support Vector Machines Logistic Regression Perceptron algorithm Naive Bayesian classifier Winnow algorithm Nearest Neighbour. .
 Measuring success – Model quality estimation The truth, and. . the whole truth l l l Classification accuracy Break-even point (precision=recall) F-measure (precision, recall)
 Reuters dataset – Categorization to flat categories l l Documents classified by editors into one or more categories Publicly available dataset of Reuters news mainly from 1987: l l 120 categories giving the document content, such as: earn, acquire, corn, rice, jobs, oilseeds, gold, coffee, housing, income, . . . …from 2000 is available new dataset of 830, 000 Reuters documents available for research
") Distribution of documents (Reuters 21578)
Distribution of documents (Reuters 21578)
 Subproblem") System architecture Web Feature construction vectors of n-grams labeled documents (from Yahoo! hierarchy) Subproblem definition Feature selection Classifier construction ? ? Document Classifier unlabeled document category (label)
System architecture Web Feature construction vectors of n-grams labeled documents (from Yahoo! hierarchy) Subproblem definition Feature selection Classifier construction ? ? Document Classifier unlabeled document category (label)
 Active Learning
 Active Learning l l l We use this methods whenever hand-labeled data are rare or expensive to obtain Interactive method Requests only labeling of “interesting” objects Much less human work needed for the same result compared to arbitrary labeling examples performance l Teacher Data & passive student labels query active student label Active student asking smart questions Passive student asking random questions number of questions
 l l Maximum margin ratio") Some approaches to Active Learning l Uncertainty sampling (efficient) l l Maximum margin ratio change l l select example with the largest predicted impact on the margin size if selected (Tong & Koller 2000 Stanford) Monte Carlo Estimation of Error Reduction l l select example closest to the decision hyperplane (or the one with classification probability closest to P=0. 5) (Tong & Koller 2000 Stanford) select example that reinforces our current beliefs (Roy & Mc. Callum 2001, CMU) Random sampling as baseline
Some approaches to Active Learning l Uncertainty sampling (efficient) l l Maximum margin ratio change l l select example with the largest predicted impact on the margin size if selected (Tong & Koller 2000 Stanford) Monte Carlo Estimation of Error Reduction l l select example closest to the decision hyperplane (or the one with classification probability closest to P=0. 5) (Tong & Koller 2000 Stanford) select example that reinforces our current beliefs (Roy & Mc. Callum 2001, CMU) Random sampling as baseline
 Category with very unbalanced class distribution having 2. 7% of positive examples Uncertainty seems to outperform Margin. Ratio
 Unsupervised Learning
 Document Clustering l l Clustering is a process of finding natural groups in the data in a unsupervised way (no class labels are pre-assigned to documents) Key element is similarity measure l l In document clustering cosine similarity is most widely used Most popular clustering methods are: l l K-Means clustering (flat, hierarchical) Agglomerative hierarchical clustering EM (Gaussian Mixture) …
 K-Means clustering algorithm l Given: l l l set of documents (e. g. TFIDF vectors), distance measure (e. g. cosine) K (number of groups) For each of K groups initialize its centroid with a random document While not converging l l Each document is assigned to the nearest group (represented by its centroid) For each group calculate new centroid (group mass point, average document in the group)
 0, 1, 2, 3, 4, 5, 6, 7,") Example of hierarchical clustering (bisecting k-means) 0, 1, 2, 3, 4, 5, 6, 7, 8, 9, 10, 11 0, 1, 2, 4, 6, 7, 9, 10, 11 3, 5, 8 0, 2, 4, 7, 10, 11 0, 2, 4, 7, 11 10 2, 4, 11 2 0, 7 4 11 1, 6, 9 0 1, 9 1 7 3, 8 6 9 3 5 8
Example of hierarchical clustering (bisecting k-means) 0, 1, 2, 3, 4, 5, 6, 7, 8, 9, 10, 11 0, 1, 2, 4, 6, 7, 9, 10, 11 3, 5, 8 0, 2, 4, 7, 10, 11 0, 2, 4, 7, 11 10 2, 4, 11 2 0, 7 4 11 1, 6, 9 0 1, 9 1 7 3, 8 6 9 3 5 8
 Latent Semantic Indexing l LSI is a statistical technique that attempts to estimate the hidden content structure within documents: l l …it uses linear algebra technique Singular-Value. Decomposition (SVD) …it discovers statistically most significant cooccurrences of terms
 LSI Example Original document-term mantrix d 1 d 2 d 3 d 4 d 5 d 6 cosmonaut 1 0 0 0 astronaut 0 1 0 0 moon 1 1 0 0 car 1 0 0 1 1 0 truck 0 0 0 1 Rescaled document matrix, Reduced into two dimensions High correlation although d 2 and d 3 don’t share any word Correlation matrix d 1 d 2 d 3 d 4 d 5 d 6 Dim 1 1. 62 0. 60 0. 04 0. 97 0. 71 0. 26 Dim 2 0. 46 0. 84 0. 30 1. 00 0. 35 0. 65 d 2 d 3 d 4 d 5 d 1 1. 00 d 2 0. 8 1. 00 d 3 0. 4 0. 9 1. 00 d 4 0. 5 -0. 2 -0. 6 1. 00 d 5 0. 7 0. 2 -0. 3 0. 9 1. 00 d 6 0. 1 -0. 5 -0. 9 0. 7 d 6 1. 00
 Visualization
 Why visualizing text? l l l . . . to have a top level view of the topics in the corpora. . . to see relationships between the topics and objects in the corpora. . . to understand better what’s going on in the corpora. . . to show highly structured nature of textual contents in a simplified way. . . to show main dimensions of highly dimensional space of textual documents. . . because it’s fun!
 theory natural") Example: Visualization of PASCAL project research topics (based on published papers abstracts) theory natural language processing kernel methods multimedia processing
Example: Visualization of PASCAL project research topics (based on published papers abstracts) theory natural language processing kernel methods multimedia processing
 …typical way of doing text visualization l l l By having text in the sparse vector Bag-of-Words representation we usually perform so kind of clustering algorithm identify structure which is then mapped into 2 D or 3 D space (e. g. using MDS) …other typical way of visualization of text is to find frequent co-occurrences of words and phrases which are visualized e. g. as graphs Typical visualization scenarios: l l l Visualization of document collections Visualization of search results Visualization of document timeline
 Graph based visualization l The sketch of the algorithm: 1. 2. 3. 4. Documents are transformed into the bag-of-words sparsevectors representation – Words in the vectors are weighted using TFIDF K-Means clustering algorithm splits the documents into K groups – Each group consists from similar documents – Documents are compared using cosine similarity K groups form a graph: – Groups are nodes in graph; similar groups are linked – Each group is represented by characteristic keywords Using simulated annealing draw a graph
 Graph based visualization of 1700 IST project descriptions into 2 groups
 Graph based visualization of 1700 IST project descriptions into 3 groups
 Graph based visualization of 1700 IST project descriptions into 10 groups
 Graph based visualization of 1700 IST project descriptions into 20 groups
 Tiling based visualization l The sketch of the algorithm: 1. 2. 3. Documents are transformed into the bag-of-words sparsevectors representation – Words in the vectors are weighted using TFIDF Hierarchical top-down two-wise K-Means clustering algorithm builds a hierarchy of clusters – The hierarchy is an artificial equivalent of hierarchical subject index (Yahoo like) The leaf nodes of the hierarchy (bottom level) are used to visualize the documents – Each leaf is represented by characteristic keywords – Each hierarchical binary splits recursively the rectangular area into two sub-areas
 Tiling based visualization of 1700 IST project descriptions into 2 groups
 Tiling based visualization of 1700 IST project descriptions into 3 groups
 Tiling based visualization of 1700 IST project descriptions into 4 groups
 Tiling based visualization of 1700 IST project descriptions into 5 groups
 of 1700 IST project descriptions (60") Tiling visualization (up to 50 documents per group) of 1700 IST project descriptions (60 groups)
Tiling visualization (up to 50 documents per group) of 1700 IST project descriptions (60 groups)
 Web. SOM l Self-Organizing Maps for Internet Exploration l …algorithm that automatically organizes the documents onto a two-dimensional grid so that related documents appear close to each other … based on Kohonen’s Self-Organizing Maps l Demo at http: //websom. hut. fi/websom/ l
 Web. SOM visualization
 Theme. Scape l l Graphically displays images based on word similarities and themes in text Themes within the document spaces appear on the computer screen as a relief map of natural terrain l l l The mountains in indicate where themes are dominant - valleys indicate weak themes Themes close in content will be close visually based on the many relationships within the text spaces Algorithm is based on K-means clustering http: //www. pnl. gov/infoviz/technologies. html
 Theme. Scape Document visualization
 Theme. River topic stream visualization • Theme. River visualization helps users identify time-related patterns, trends, and relationships across a large collection of documents. • The themes in the collection are represented by a "river" that flows left to right through time. • The theme currents narrow or widen to indicate changes in individual theme strength at any point in time. http: //www. pnl. gov/infoviz/technologies. html
 Kartoo. com – visualization of search results http: //kartoo. com/
 Search. Point – re-ranking of search results
 Text. Arc – visualization of word occurrences http: //www. textarc. org/
 News. Map – visualization of news articles http: //www. marumushi. com/apps/newsmap. cfm
 Document Atlas – visualization of document collections and their structure http: //docatlas. ijs. si
") Information Extraction (slides borrowed from William Cohen’s Tutorial on IE)
Information Extraction (slides borrowed from William Cohen’s Tutorial on IE)
 Example: Extracting Job Openings from the Web foodscience. com-Job 2 Job. Title: Ice Cream Guru Employer: foodscience. com Job. Category: Travel/Hospitality Job. Function: Food Services Job. Location: Upper Midwest Contact Phone: 800 -488 -2611 Date. Extracted: January 8, 2001 Source: www. foodscience. com/jobs_midwest. htm Other. Company. Jobs: foodscience. com-Job 1
 Example: IE from Research Papers
 What is “Information Extraction” As a task: Filling slots in a database from sub-segments of text. October 14, 2002, 4: 00 a. m. PT For years, Microsoft Corporation CEO Bill Gates railed against the economic philosophy of open-source software with Orwellian fervor, denouncing its communal licensing as a "cancer" that stifled technological innovation. Today, Microsoft claims to "love" the opensource concept, by which software code is made public to encourage improvement and development by outside programmers. Gates himself says Microsoft will gladly disclose its crown jewels--the coveted code behind the Windows operating system--to select customers. "We can be open source. We love the concept of shared source, " said Bill Veghte, a Microsoft VP. "That's a super-important shift for us in terms of code access. “ Richard Stallman, founder of the Free Software Foundation, countered saying… NAME TITLE ORGANIZATION
 What is “Information Extraction” As a task: Filling slots in a database from sub-segments of text. October 14, 2002, 4: 00 a. m. PT For years, Microsoft Corporation CEO Bill Gates railed against the economic philosophy of open-source software with Orwellian fervor, denouncing its communal licensing as a "cancer" that stifled technological innovation. Today, Microsoft claims to "love" the opensource concept, by which software code is made public to encourage improvement and development by outside programmers. Gates himself says Microsoft will gladly disclose its crown jewels--the coveted code behind the Windows operating system--to select customers. "We can be open source. We love the concept of shared source, " said Bill Veghte, a Microsoft VP. "That's a super-important shift for us in terms of code access. “ Richard Stallman, founder of the Free Software Foundation, countered saying… IE NAME Bill Gates Bill Veghte Richard Stallman TITLE ORGANIZATION CEO Microsoft VP Microsoft founder Free Soft. .
 What is “Information Extraction” As a family of techniques: Information Extraction = segmentation + classification + clustering + association October 14, 2002, 4: 00 a. m. PT For years, Microsoft Corporation CEO Bill Gates railed against the economic philosophy of open-source software with Orwellian fervor, denouncing its communal licensing as a "cancer" that stifled technological innovation. Today, Microsoft claims to "love" the opensource concept, by which software code is made public to encourage improvement and development by outside programmers. Gates himself says Microsoft will gladly disclose its crown jewels--the coveted code behind the Windows operating system--to select customers. "We can be open source. We love the concept of shared source, " said Bill Veghte, a Microsoft VP. "That's a super-important shift for us in terms of code access. “ Richard Stallman, founder of the Free Software Foundation, countered saying… Microsoft Corporation CEO Bill Gates Microsoft aka “named entity Gates extraction” Microsoft Bill Veghte Microsoft VP Richard Stallman founder Free Software Foundation
 What is “Information Extraction” As a family of techniques: Information Extraction = segmentation + classification + association + clustering October 14, 2002, 4: 00 a. m. PT For years, Microsoft Corporation CEO Bill Gates railed against the economic philosophy of open-source software with Orwellian fervor, denouncing its communal licensing as a "cancer" that stifled technological innovation. Today, Microsoft claims to "love" the opensource concept, by which software code is made public to encourage improvement and development by outside programmers. Gates himself says Microsoft will gladly disclose its crown jewels--the coveted code behind the Windows operating system--to select customers. "We can be open source. We love the concept of shared source, " said Bill Veghte, a Microsoft VP. "That's a super-important shift for us in terms of code access. “ Richard Stallman, founder of the Free Software Foundation, countered saying… Microsoft Corporation CEO Bill Gates Microsoft Bill Veghte Microsoft VP Richard Stallman founder Free Software Foundation
 What is “Information Extraction” As a family of techniques: Information Extraction = segmentation + classification + association + clustering October 14, 2002, 4: 00 a. m. PT For years, Microsoft Corporation CEO Bill Gates railed against the economic philosophy of open-source software with Orwellian fervor, denouncing its communal licensing as a "cancer" that stifled technological innovation. Today, Microsoft claims to "love" the opensource concept, by which software code is made public to encourage improvement and development by outside programmers. Gates himself says Microsoft will gladly disclose its crown jewels--the coveted code behind the Windows operating system--to select customers. "We can be open source. We love the concept of shared source, " said Bill Veghte, a Microsoft VP. "That's a super-important shift for us in terms of code access. “ Richard Stallman, founder of the Free Software Foundation, countered saying… Microsoft Corporation CEO Bill Gates Microsoft Bill Veghte Microsoft VP Richard Stallman founder Free Software Foundation
 What is “Information Extraction” As a family of techniques: Information Extraction = segmentation + classification + association + clustering Today, Microsoft claims to "love" the opensource concept, by which software code is made public to encourage improvement and development by outside programmers. Gates himself says Microsoft will gladly disclose its crown jewels--the coveted code behind the Windows operating system--to select customers. "We can be open source. We love the concept of shared source, " said Bill Veghte, a Microsoft VP. "That's a super-important shift for us in terms of code access. “ Richard Stallman, founder of the Free Software Foundation, countered saying… * Microsoft Corporation CEO Bill Gates * Microsoft Bill Veghte * Microsoft VP Richard Stallman founder Free Software Foundation NAME Bill Gates Bill Veghte Richard Stallman For years, Microsoft Corporation CEO Bill Gates railed against the economic philosophy of open-source software with Orwellian fervor, denouncing its communal licensing as a "cancer" that stifled technological innovation. TITLE ORGANIZATION CEO Microsoft VP Microsoft founder Free Soft. . October 14, 2002, 4: 00 a. m. PT
 Typical approaches to IE l Hand-built rules/models for extraction l l l …usually extended regexp rules …GATE system from U. Sheffield (http: //gate. ac. uk/) Machine learning used on manually labelled data: l l Classification problem on sliding window l …examples are taken from sliding window l …models classify short segments of text such as title, name, institution, … l …limitation of sliding window because it does not take into account sequential nature of text Training stochastic finite state machines (e. g. HMM) l …probabilistic reconstruction of parsing sequence
 Link-Analysis How to analyze graphs in the Web context?
 What is Link Analysis? l Link Analysis is exploring associations between the objects l …most characteristic for the area is graph representation of the data l Category of graphs which attract recently the most interest are the ones which are generated by some social process (social networks) – this would include web l Synonyms for Link Analysis or at least very related areas are Graph Mining, Network Analysis, Social Network Analysis l In the next slides we’ll present some of the typical definitions, ideas and algorithms
 What is Power Law? l Power law describes relations between the objects in the network l l l …it is very characteristic for the networks generated within some kind of social process …it describes scale invariance found in many natural phenomena (including physics, biology, sociology, economy and linguistics) In Link Analysis we usually deal with power law distributed graphs
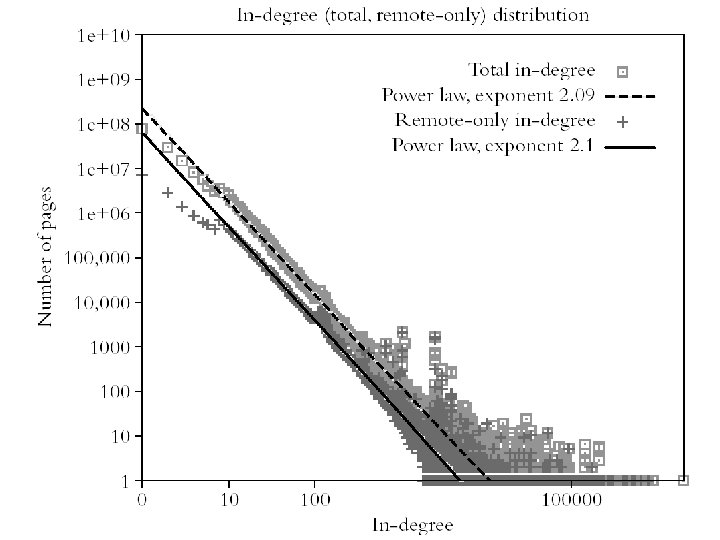
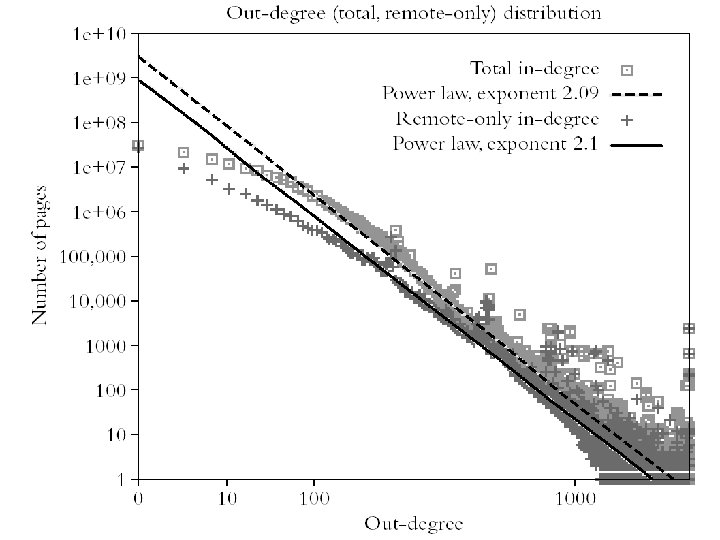
 Power-Law on the Web l In the context of Web the power-law appears in many cases: l l l Web pages sizes Web page connectivity Web connected components’ size Web page access statistics Web Browsing behavior Formally, power law describing web page degrees are: (This property has been preserved as the Web has grown)
 Small World Networks l Empirical observation for the Web-Graph is that the diameter of the Web-Graph is small relative to the size of the network l l l …this property is called “Small World” …formally, small-world networks have diameter exponentially smaller then the size By simulation it was shown that for the Websize of 1 B pages the diameter is approx. 19 steps l …empirical studies confirmed the findings
 Structure of the Web – “Bow Tie” model l In November 1999 large scale study using Alta. Vista crawls in the size of over 200 M nodes and 1. 5 B links reported “bow tie” structure of web links l …we suspect, because of the scale free nature of the Web, this structure is still preserved
 TENDRILS – disconnected components reachable only via directed path from IN and OUT but not from and to core IN – consisting from pages that can reach core via directed path, but cannot be reached from the core SCC - Strongly Connected component where pages can reach other via directed paths OUT – consisting from pages that can be reached from the core via directed path, but cannot reach core in a similar way
 Modeling the Web Growth l Links/Edges in the Web-Graph are not created at random l l l …probability that a new page gets attached to one of the more popular pages is higher then to a one of the less popular pages Intuition: “rich gets richer” or “winners takes all” Simple algorithm “Preferential Attachment Model” (Barabasi, Albert) efficiently simulates Web. Growth
 at time 0 At") “Preferential Attachment Model” Algorithm l l M 0 vertices (pages) at time 0 At each time step new vertex (page) is generated with m≤ M 0 edges to m random vertices l l …probability for selection a vertex for the edge is proportional to its degree …after t time steps, the network has M 0+t vertices (pages) and mt edges l …probability that a vertex has connectivity k follows the power-law
“Preferential Attachment Model” Algorithm l l M 0 vertices (pages) at time 0 At each time step new vertex (page) is generated with m≤ M 0 edges to m random vertices l l …probability for selection a vertex for the edge is proportional to its degree …after t time steps, the network has M 0+t vertices (pages) and mt edges l …probability that a vertex has connectivity k follows the power-law
 Estimating importance of the web pages l Two main approaches, both based on eigenvector decomposition of the graph adjacency matrix l l Hubs and Authorities (HITS) Page. Rank – used by Google
 Hubs and Authorities l Intuition behind HITS is that each web page has two natures: l l l …being good content page (authority weight) …being good hub (hub weight) …and the idea behind the algorithm: l l …good authority page is pointed to by good hub pages …good hub page is pointing to good authority pages
 “Hubs and authorities exhibit what could be called a") Hubs and Authorities (Kleinberg 1998) “Hubs and authorities exhibit what could be called a mutually reinforcing relationship” Iterative relaxation: Hubs Authorities
Hubs and Authorities (Kleinberg 1998) “Hubs and authorities exhibit what could be called a mutually reinforcing relationship” Iterative relaxation: Hubs Authorities
 Page. Rank l Page. Rank was developed by the founders of the Google in 1998 l l l …its basic intuition is to calculate primal eigenvector of the graph adjacency matrix …each page gets a value which corresponds to the importance of the node within the network Page. Rank can be computed effectively by an iterative procedure