

cb22bf752cfd5fad6c82e141e11cd6ab.ppt
- Количество слайдов: 34
 Wet Deposition of Mercury In The U. S. Results from the NADP Mercury Deposition Network, 1996 -2004 David Gay Illinois State Water Survey, Champaign, IL, dgay@uiuc. edu 217. 244. 0462
 Goal of this Presentation…. o o To introduce you to the Mercury Deposition Network. Show what we know about the deposition of mercury.
 What is the Mercury Deposition Network? o A Cooperative Research Program n n o Part of National Atmospheric Deposition Network 92 sites Federal, State, Local and Tribal Governments members, private organizations Measuring wet deposition of mercury Our Charge: n to determine if trends exist in wet deposition of mercury over time
 Federal Agency Members
 University Members
 Tribal Organizations
 Other Organizations and States
 Why monitor Mercury in Precipitation?
 Why monitor Mercury in Precipitation? o o Atmospheric transport and deposition is the dominant pathway to most aquatic ecosystems. Between 50 and 75% of the mercury input to lakes and streams is by wet deposition (probably less in the West).
 From Ellen’s Presentation…. . Mercury Emissions Contribute to Exposure to Mercury Lake Ocean Atmospheric deposition Fishing Emissions to the Air Emissions and Speciation • • Wet and Dry Deposition Atmospheric Transport and Deposition methylation Mercury transforms into methylmercury in soils and water, then can bioaccumulate in fish Ecosystem Transport, Methylation, and Bioaccumulation • commercial • recreationa l • subsistenc Humans and e wildlife affected primarily by eating contaminated fish Consumption Patters Impacts • Best documented impacts on the developing fetus: impaired motor and cognitive skills • Possible cardiovascular, immune, and reproductive system impacts Human Exposure The primary pathway of human exposure to mercury in the U. S. is through eating contaminated fish. Power plants emit approximately 48 tons of mercury and are the largest source of mercury emissions in the U. S. (approximately 41%).
 How Mercury is Wet Deposited RGM Hgp Hgo Hgp RGM
 Atmospheric Mercury Species Abundance Hg 0 – Elemental Mercury RGM – Reactive Gaseous Mercury Hgp – Particulate Bound Mercury 1. 4 -1. 8 ng/m 3 Typical Atm. Mercury Species Abundance
 How Mercury is Wet Deposited Hgo oxidation RGM
 o Picture of the sampler here
") MDN Sites (2005)
MDN Sites (2005)
 What the Data Show….
 Mercury Concentrations in Precipitation 2003
 Mercury Concentrations in Precipitation Mercury Wet Deposition, 2003
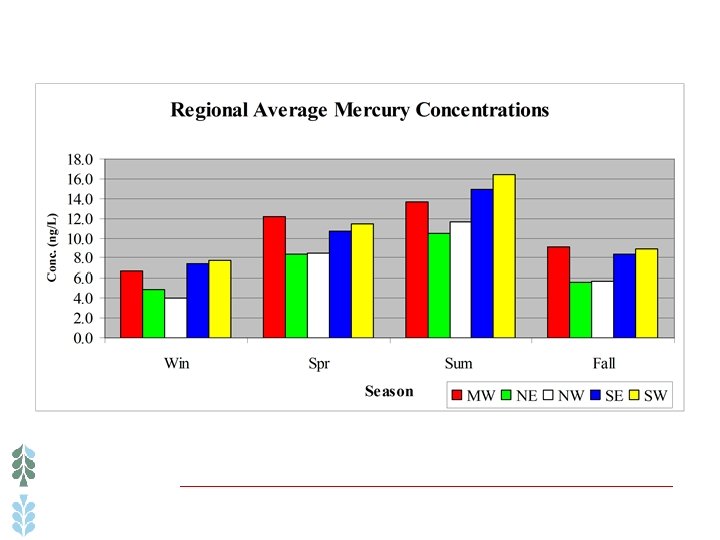
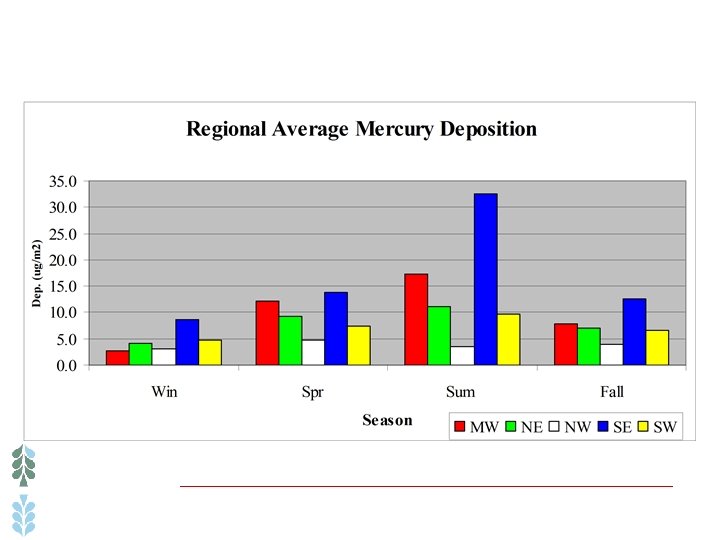
 Possible Reasons for High Mercury Deposition in the Summer o o o Higher rainfall amounts Higher temperatures Higher oxidant levels Southerly air flow Strong thunderstorms Higher emissions (ocean)
 Seigneur and others, ES&T, 2004, V 38, 555 -569 WET DEPOSITION Modeled and Measured
 Trends In Wet Deposition
 n n n 5 years of data") Trends o Seasonal Kendall and Sen’s (non-parametric) n n n 5 years of data for 4 seasons Run seasonally Very small, slight changes, but n none significant
Trends o Seasonal Kendall and Sen’s (non-parametric) n n n 5 years of data for 4 seasons Run seasonally Very small, slight changes, but n none significant
 Dry Deposition
 Measurements of Dry Deposition ? • Very few measurements • Very few calculations of dry deposition
 Modeling Deposition DRY DEPOSITION Seigneur and others, ES&T, 2004, V 38, 555 -569
 Plans for Dry Deposition Manually Operated Mercury Species Sampling Monitoring station for manually-operated sampling system EPA Method IO-5 Gold-Trap Method for Hg 0 i Sampling box for manual system
 Automated Hg Speciation PHg RGM Hg 0 Methods are: -Lab Tested -Widely used -QA challenged -EPA Accepted
 Future Directions for MDN o o Expand network coverage in the western U. S. , southern Canada, and Mexico Provide “before” and “after” mercury deposition data related to future controls on mercury emissions Develop better methods to monitor dry deposition of mercury Monitor additional trace metals
 Wet Deposition of Mercury In The U. S. Results from the NADP Mercury Deposition Network, 1996 -2004 David Gay Illinois State Water Survey, Champaign, IL, dgay@uiuc. edu 217. 244. 0462
 Anthropogenic Sources of Mercury o o Coal combustion Incineration n o o o Medical Trash Cremation Industrial emissions (chlor-alkali) Cement production (Hg in lime) Hg use in gold and silver mining (amalgam formation) Mining of Hg Automobile Recycling Mercury in Landfills n Fluorescent lamps dental amalgams (also in sewers) Thermometers Batteries Discarded electrical switches n Other carbon fossil fuels (gas/oil/diesel)? n n o Others will surface
 Naturally enriched ores/soils n n") Natural Sources of Mercury o o Volcanoes (St. Helens) Naturally enriched ores/soils n n o o Soils and rocks (0. 5 ppm in crust) Evaporation n n o o o Plate tectonic boundaries Cinnabar (Hg. S), taconite, others Soils Fresh water and OCEANS Natural forest fires (wood fire places? ) Mine tailings Tree bark, volatilization from rocks?
Natural Sources of Mercury o o Volcanoes (St. Helens) Naturally enriched ores/soils n n o o Soils and rocks (0. 5 ppm in crust) Evaporation n n o o o Plate tectonic boundaries Cinnabar (Hg. S), taconite, others Soils Fresh water and OCEANS Natural forest fires (wood fire places? ) Mine tailings Tree bark, volatilization from rocks?
 Many Mercury Sources o o o Coal combustion Incineration Industrial emissions n n o Mercury in Landfills n n o (chlor-alkali) Cement production (lime) Hg use in mining and Mining of Hg Automobile Recycling Fluorescent lamps dental amalgams (also in sewers) Thermometers, batteries electrical switches Taconite o o Volcanoes (St. Helens) Enriched ores/soils n n o o Soils and rocks (0. 5 ppm in crust) Evaporation n n o Soils Fresh water and Oceans Forest fires n o Tectonic (plate) boundaries Cinnabar (Hg. S), taconite, others (wood fire places? ) Tree bark, volatilization from rocks?