b8c6a4bb40a808efa45fbcaf5436d56b.ppt
- Количество слайдов: 46
 Week # 3 MR Chapter 3 • Tutorial #3 • MR #3. 1, 3. 5, 3. 9, 3. 12. • To be discussed on Feb 7, 2018. • By either volunteer or class list. MARTIN RHODES (2008) Introduction to Particle Technology , 2 nd Edition. Publisher John Wiley & Son, Chichester, West Sussex, England.
") Settling of a suspension of particles Equation (3. 5)
Settling of a suspension of particles Equation (3. 5)
 Ufs") Equation (3. 6) Ufs
Equation (3. 6) Ufs
 Re < 0. 3: Re > 500:") Batch settling Equation (3. 20) Re < 0. 3: Re > 500:
Batch settling Equation (3. 20) Re < 0. 3: Re > 500:
 Equation (*): A maximum is observed at") Khan & Richardson Archimedes number, Ar: (*) Equation (*): A maximum is observed at e = (n/(n+1); Inflection point at e = (n-1)/(n+1)
Khan & Richardson Archimedes number, Ar: (*) Equation (*): A maximum is observed at e = (n/(n+1); Inflection point at e = (n-1)/(n+1)
 • Sharp interfaces in sedimentation Variation of dimensionless setting flux with suspension concentration Re. P<0. 3, n=4. 65
 Concentration interface in sedimentation UPS 1, UPS 2 are particle volumetric flux Ups = Up * C =Up * (1 -e) (a) The gradient of the curve at concentration C is the velocity of a layer of suspension of this concentration. (b) The slope of a chord joining two points at concentration C 1 and C 2 is the velocity of discontinuity or interface between suspensions of these concentrations.
 • The batch settling test C 2 C 3 Determination of interface and layer velocities from a batch flux plot C 2
 Type 1 batch settling. Zones A, B and S are zones of constant concentration. Zone A is a clear liquid; zone B is a suspension of concentration equal to the initial suspension concentration; zone S is a suspension of settled bed or sediment concentration
 Change in positions of interface AB, BS and AS with time in Type 1 batch settling
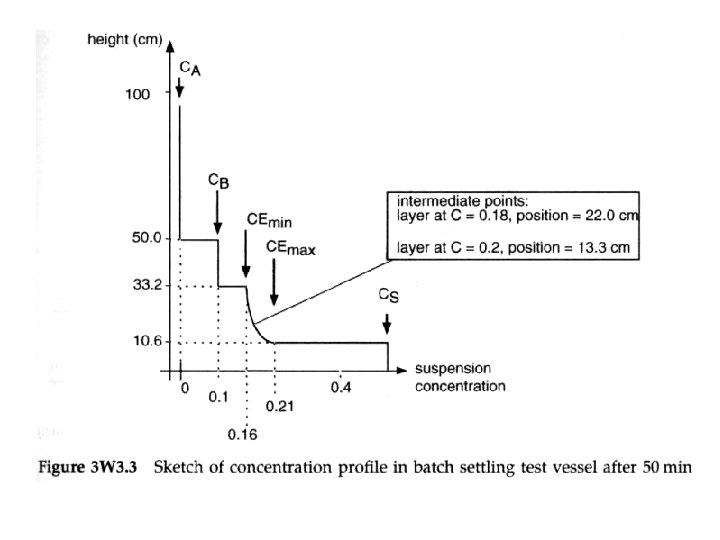
 S Type 2 batch settling. Zones A, B and S are zones of constant concentration. Zone A is clear liquid; zone B is a suspension of concentration equal to the initial suspension concentration; zone S is a suspension of settled bed concentration. Zone E is a zone of variable concentration.
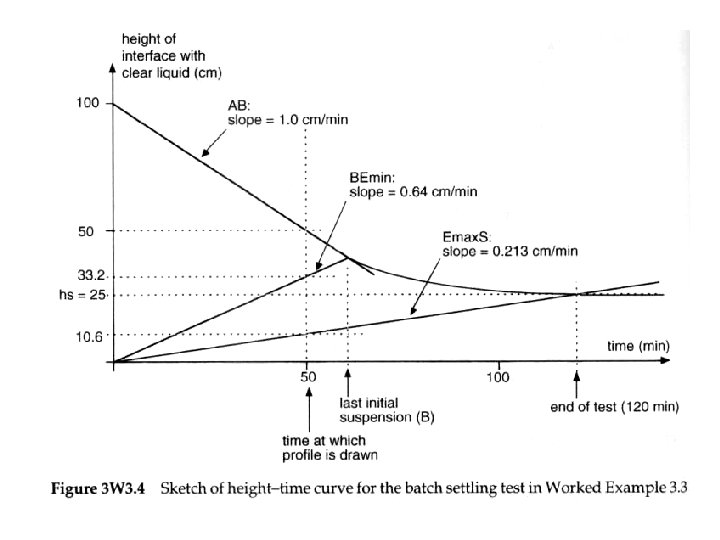
 Change in positions of interface AB, BEmin, Emax. S and AS with time in Type 2 batch settling
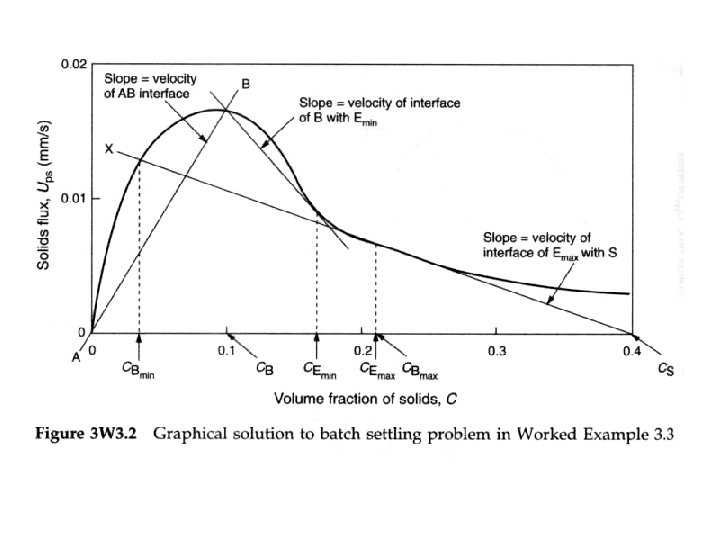
 Determining if settling will be Type 1 or Type 2. A line through CS tangent to the flux curve gives CB 1 and CB 2. Type 2 settling occurs when initial suspension concentration is between CB 1 and CB 2.
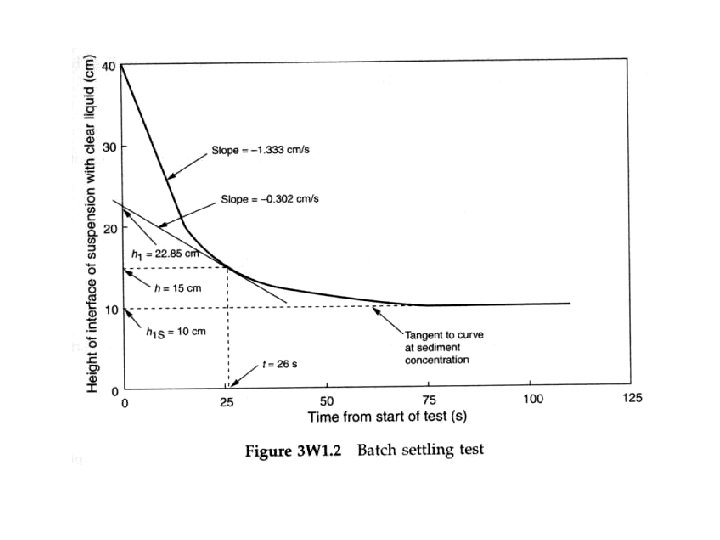
 • Relationship between the Height-Time curve and the flux plot Analysis of batch settling test
 Analysis of batch settling; relative velocities of a plane of concentration C and the particles in the plane
 Volume of particles which have passed through this plane in time t
 Continuous settling • Settling of a suspension in a flowing fluid Continuous settling; downflow only
 ** Upward flow of a particle suspension in a vessel gives") Equation (3. 41) ** Upward flow of a particle suspension in a vessel gives total downward particle flux. (1 -e) **
Equation (3. 41) ** Upward flow of a particle suspension in a vessel gives total downward particle flux. (1 -e) **
 Total flux plot for settling in downward flow
 Total flux plot for settling in upward flow
 A real thickener, combining") • A real thickener (with upflow and downflow sections) A real thickener, combining upflow and downflow (F, L and V are volumes; CF, CL and CV are concentrations)
• A real thickener (with upflow and downflow sections) A real thickener, combining upflow and downflow (F, L and V are volumes; CF, CL and CV are concentrations)
 Total flux plot for a thickener at critical loading
 Total flux plot for an underloaded thickener
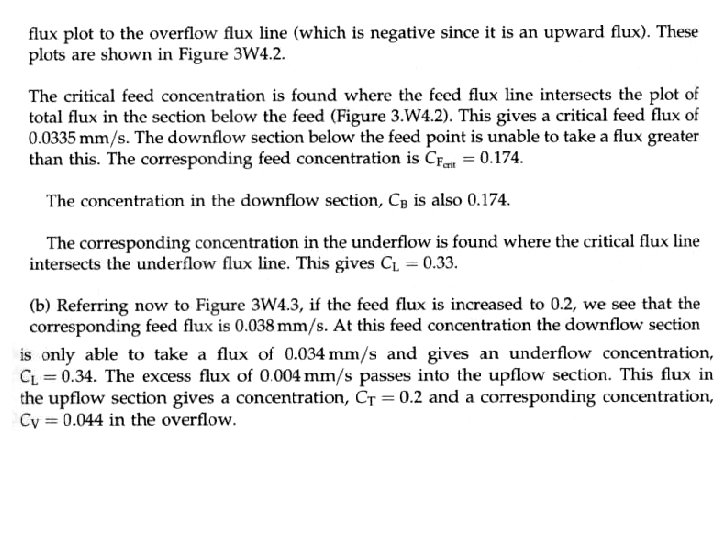
 Total flux plot for an overloaded thickener
 Alternative total flux plot shape; thickener at critical loading
 Alternative total flux plot shape; Overloaded thickener
 26
26