c6537caf35879c6b11477b0a027b9db7.ppt
- Количество слайдов: 35


Web Based Fumigation Monitoring For Stored Product Protection M 2 M Fumigation & Io. T Glennon, D. , Caravello, A. , Ottmar, S. , Wells, I. 11 th IWCSPP 2014 Chiang Mai, THAILAND OP 5. 14

Why Are ALL Fumigation Gas Measurements Wrong Unless they Have Pressure, Temperature & Flow Correction?

“If you are not monitoring you are not fumigating. ” Dosage is not concentration No reaction is 100% quantitative conversion Leakage from the structure…IS IT SEALED? Sorption of gas from free space onto product & packaging

10 -25% Total Error MB Quarantine Fumes FOIA USDA Data* Ø Different Temp and Pressure on Day of Calibration Vs. Day of USE? • a 1% error is observed for every 3 C uncorrected temperature change • a fixed error of 1% for every 7. 6 mm change in pressure • Errors can easily be 4 g/M 3 which is 7% in a 35 g/M 3 fumigation. Ø Thermoconductivity monitors give a 12 g/M 3 FALSE response for every 1% of CO 2 present. • Reading of higher levels than actually present leads to under-dosage Ø Pump draw rates change sample pressures which changes sample density. • Different sample line lengths change pump pressure changing gas density
 reading(g/m")
Shanghai CIQ Quarantine Fumigation 20 -30% Error with Thermoconductivity Monitor (NO P&T Correction) reading(g/m 3) start time 11/5/2008 11/5/2008 11/5/2008 12: 00 12: 13 13: 40 14: 35 14: 40 14: 50 15: 10 15: 20 15: 30 15: 40 Duration Container 26 hours 20 hours 23 mins 27 hours 40 mins 22 hours 40 mins 28 hours 35 mins 28 hours 40 mins 23 hours 10 mins 29 hours 20 mins 35 mins 45 mins Position 温度 011031 022435 228489 011031 336106 401681 bottom top bottom middle bottom 22℃ 22℃ 23℃ 23℃ MB 3000 MB-Contain. IR ZR-A 43 63 34 58 41 35 62 123 41 85 82 55. 9 88. 3 42. 2 87. 2 56. 3 47. 2 72. 6 147. 2 55. 7 109. 2 109. 4 42. 8 63. 4 34. 2 59. 0 40. 9 34. 8 61. 6 124. 0 40. 6 83. 9 81. 3 测试结果对比图 MB 300 浓度 g/m 3 MB-Contain. IR ZR-A 160 140 120 100 80 60 40 20 0 1 2 3 4 5 6 7 8 9 10 11
 & Internet of Things (Io. T) Nest Dropcam")
Machine to Machine (M 2 M) & Internet of Things (Io. T) Nest Dropcam

Encrypted, Flexible , Secure Data Transmission

Secured, Encrypted Website

400 Series Monitor Spectros Instruments’ Monitors are calibrated to absolute laws of physics PV=n. RT (Validate Any Time) with precise molar concentrations and compensate for ambient Pressure , Gas Flow &Temperature with onboard sensors.

Diagnostic Screen Zone length > Active zone, purge, or press. check > IR detector output, volts Detector noise figure > IR measurement units > Sample concentration, in IR detector (Bench) Modbus packet traffic appears here, when RS 485 is enabled and active. Concentration at ambient P&T and STP System temperatures System pressures Exit Diag screen Change since last re-zero Change since last P check Clear Modbus data Initiate Purge cycle Current fault code Concentration Detector comp (Flagged with “F”) correction due since last zero to temperature Switch to next zone Toggle pump on/off Press to store current as zero 400 Series

MBContain. IR APPROVED

PH 3 Australia

European Union PH 3

Peru CH 3 Br

India Multi-Billion Dollar, Multinational Consumer Product. Pharmaceutical Corporation CH 3 Br
 测试结果对比图 MB 300 浓度 g/m 3 200 MB-Contain. IR")
People’s Republic of China (CIQ) 测试结果对比图 MB 300 浓度 g/m 3 200 MB-Contain. IR ZR-A 100 0 1 CH 3 Br 2 3 4 5 6 7 8 9 10 11


Shanghai CIQ Quarantine Fumigation

United States of America SO 2 F 2

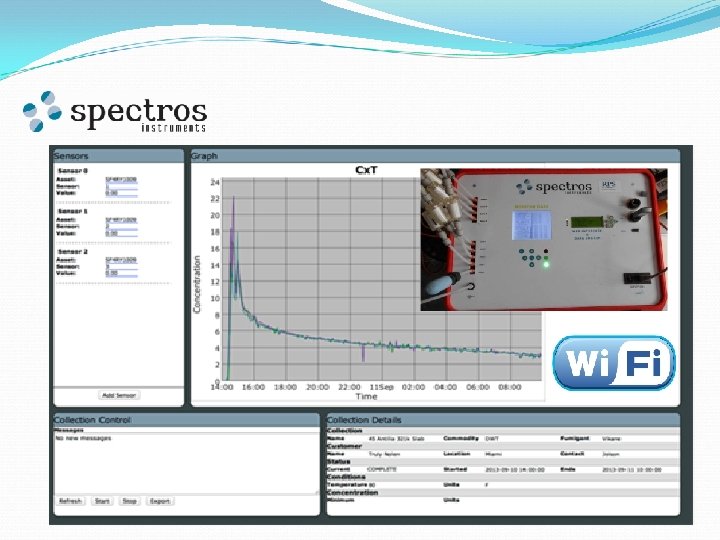
Wi. Fi Device and IP Address Recognized Device IP Address

Warehouse SF Fumigation Gas Added


Solar Powered Remote Phosphine Monitor Cellular & Satellite 17 D Airport Road • Hopedale, MA 01747 • Tel: 508 -478 -1648 • Fax: 508 -590 -0262 www. Spectros. Instruments. com

400 Series Sleep Mode Operation Overview • Continuous on Mains • 20 W Draw on Battery @13 V with Inverter Load Output is approximately 30 amp hours continuous. Now with Sleep Mode have multiple of this…… • Duration of the “sleep” period in hours (1 -255 hours). • During sleep mode, the pump and IR bench are turned off, and the green LED is flashed every 10 seconds. • A status box indicates the time remaining to the next check.
 High Range PH")
PM 400= PH 3 0 ppm to 10, 000 ppm (1%) High Range PH 3 Low Range PH 3

Low Level Phosphine Concentration: A Profile Survey System

Possibilities In-Transit Fumigations

APPROVED Paperless Recorder PM 400

PM 400: A PH 3 Sensor Platform Temperatur e %RH High Range PH 3 Grain Level Low Range PH 3

Electronic Notebook: Traceable to Compliance USA Federal Register 21 CFR Part 11 Calibrated Fumigant Gas Cylinder Spectros Monitors Pressure, Temperature, Flows Remote Calibration Verification Onsite Proof of Compliance Encrypted Transfer of Data Like “Bank Transfer” Use of M 2 M & Io. T Government Enforcement PROOF

Government Agency Encrypted Code AGENCY CONTROLS THEIR DATA ON THEIR WEBSITEOF FUMIGATION DATA STEP 1: Fumigation Collects (Cx. T Secured Data) STEP 2: Defined Cx. T has Certificate Pass/Fail TRACEABLE TO CERTIFIED CALIBRATION GAS STEP 3: Good Fumigation gets Notification to Agency Protected Server (ENCRYPTED) STEP 4: Governing Agency Issues THEIR TRACKING # (Unique and No Way to Counterfeit) STEP 5: This # Used by Brokers/Forwarders/Shipping Companies USA FEDERAL REGISTER: Electronic Notebook 21 CFR Part 11

Poor Fumigation Monitoring = Increased Pest Resistance! Vs. 5 M 1 ISP

Solutions Exists! Does the Will Exist? Thank You Dennis Glennon Ph. D. Chief Technology Officer Spectros Instruments, Inc. 17 D Airport Road Hopedale, MA USA Office 508. 478. 1648 Direct 508. 579. 6301 dglennon@spectrosinstruments. com
c6537caf35879c6b11477b0a027b9db7.ppt