

5e640331d9997abd72041c5db679e63d.ppt
- Количество слайдов: 48
 Wealth and Inheritance in the Long Run Thomas Piketty Paris School of Economics LIS Lecture, July 4 th 2012
 • There are two ways to become rich: either through one’s own work, or through inheritance • In Ancien Regime societies, as well as in 19 C and early 20 C, it was obvious to everybody that the inheritance channel was important • Inheritance and successors were everywhere in the 19 C literature: Balzac, Jane Austen, etc. • Inheritance flows were huge not only in novels; but also in 19 C tax data: major economic, social and political issue
 • Question: Does inheritance belong to the past? Did modern growth kill the inheritance channel? E. g. due to the natural rise of human capital and meritocracy? • This lecture answers « NO » to this question: I show that inherited wealth will probably play as big a role in 21 C capitalism as it did in 19 C capitalism Lecture based upon T. Piketty, « On the long run evolution of inheritance: France 1820 -2050 » , QJE 2011 (available on line at piketty. pse. ens. fr) and on on-going similar work on US, UK, Germany and Italy


 • An annual inheritance flow around 20%-25% of disposable income is a very large flow • E. g. it is much larger than the annual flow of new savings (typically around 10%-15% of disposable income), which itself comes in part from the return to inheritance (it’s easier to save if you have inherited your house & have no rent to pay) • An annual inheritance flow around 20%-25% of disposable income means that total, cumulated inherited wealth represents the vast majority of aggregate wealth (typically above 80%-90% of aggregate wealth), and vastly dominates self-made wealth
 • Main lesson: with g low & r>g, inheritance is bound to dominate new wealth; the past eats up the future g = growth rate of national income and output r = rate of return to wealth = (interest + dividend + rent + profits + capital gains etc. )/(net financial + real estate wealth) • Intuition: with r>g & g low (say r=4%-5% vs g=1%-2%) (=19 C & 21 C), wealth coming from the past is being capitalized faster than growth; heirs just need to save a fraction g/r of the return to inherited wealth • It is only in countries and time periods with g exceptionally high that self-made wealth dominates inherited wealth (Europe in 1950 s-70 s or China today)
 The return of wealth (Be careful with « human") This lecture: two issues (1) The return of wealth (Be careful with « human capital » illusion: human k did not replace old-style financial & real estate wealth) (2) The return of inherited wealth (Be careful with « war of ages » illusion: the war of ages did not replace class war; inter-generational inequality did not replace intra-generational inequality) (=continuation of « World Top Incomes Database » project)
This lecture: two issues (1) The return of wealth (Be careful with « human capital » illusion: human k did not replace old-style financial & real estate wealth) (2) The return of inherited wealth (Be careful with « war of ages » illusion: the war of ages did not replace class war; inter-generational inequality did not replace intra-generational inequality) (=continuation of « World Top Incomes Database » project)
 1. The return of wealth • The « human capital » illusion: « in today’s modern economies, what matters is human capital and education, not old-style financial or real estate wealth » • Technocractic model : Parsons, Galbraith, Becker (unidimensional class structure based upon human K) • But the share of old-style capital income (rent, interest, dividend, etc. ) in national income is the same in 2010 as in 1910 (about 30%), and the aggregate wealth-income ratio is also the same in 2010 as in 1910 (about 600%) • Today in France, Italy, UK: β = W/Y ≈ 600% Per adult national income Y ≈ 35 000€ Per adult private wealth W ≈ 200 000€ (wealth = financial assets + real estate assets – financial liabilities) (on average, households own wealth equal to about 6 years of income)


 • There are sevreal long-run effects explaining the return of high wealth-income ratios : - it took a long time to recover from world war shocks (1913 stock mkt & real estate capitalization recovered during 2000 s) - financial deregulation & tax competition → rising capital shares and wealth-income ratios - growth slowdown in rich countries: r > g → rise of wealth-income and inheritance-income ratios + rise of wealth inequality (amplifying mechanism) (r = rate of return to wealth, g = productivity growth + pop growth) • Aggregate effect: Harrod-Domar-Solow formula: β* = s/g (β* = wealth-income ratio, s = saving rate) (i. e. s=10%, g=2% → β*=500%; if g=1%, then β*=1000%) (i. e. if we save 10% of income each year, then in the long run we accumulate 5 years of income if growth rate is 2%) → highly unstable process if growth rate is low
 2. The return of inherited wealth • In principle, one could very well observe a return of wealth without a return of inherited wealth • I. e. it could be that the rise of aggregate wealthincome ratio is due mostly to the rise of life-cycle wealth (pension funds) • Modigliani life-cycle theory: people save for their old days and die with zero wealth, so that inheritance flows are small
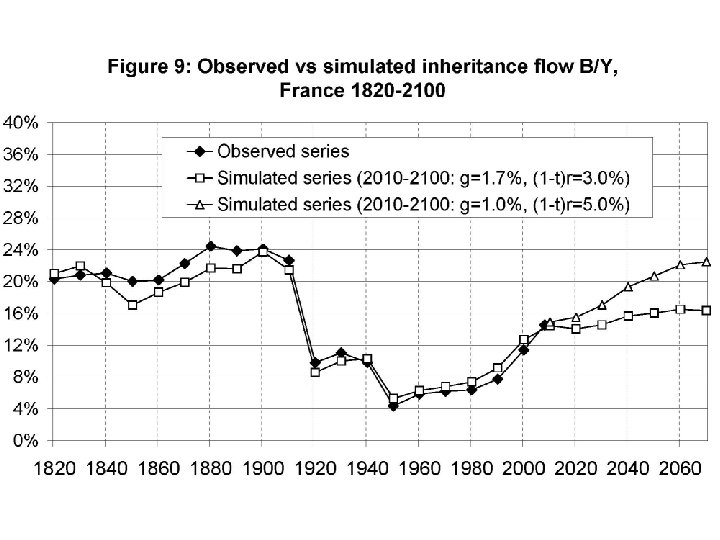
 • However the Modigliani story happens to be partly wrong (except in the 50 s-60 s, when there’s not much left to inherit…): pension wealth is a limited part of wealth (<5% in France… but 30% in the UK) • Bequest flow-national income ratio B/Y = µ m W/Y (with m = mortality rate, µ = relative wealth of decedents) • B/Y has almost returned to 1910 level, both because of W/Y and of µ • Dynastic model: µ = (D-A)/H, m=1/(D-A), so that µ m = 1/H and B/Y = β/H (A = adulthood = 20, H = parenthood = 30, D =death = 60 -80) • General saving model: with g low & r>g, B/Y → β/H → with β=600% & H=generation length=30 years, then B/Y≈20%, i. e. annual inheritance flow ≈ 20% national income


 Table 2: Raw age-wealth-at-death profiles in France, 18202008 20 -29 30 -39 40 -49 50 -59 60 -69 70 -79 80+ 1827 50% 63% 73% 100% 113% 114% 122% 1857 57% 58% 86% 100% 141% 125% 154% 1887 45% 33% 63% 100% 152% 213% 225% 1902 26% 57% 78% 100% 172% 176% 233% 1912 23% 54% 74% 100% 158% 176% 237% 1931 22% 59% 77% 100% 123% 137% 143% 1947 23% 52% 77% 100% 99% 76% 62% 1960 28% 52% 74% 100% 110% 101% 87% 1984 19% 55% 83% 100% 118% 113% 105% 2000 19% 46% 66% 100% 122% 121% 118%
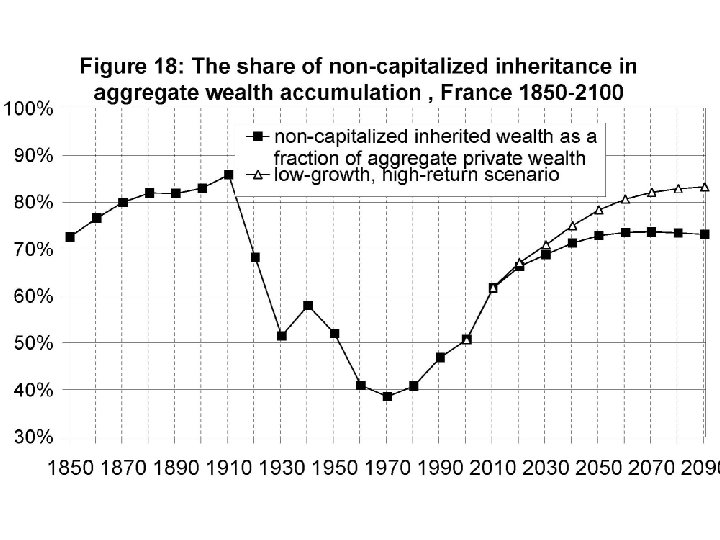
 The share of inherited wealth in total wealth • Modigliani AER 1986, JEP 1988: inheritance = 20% of total U. S. wealth • Kotlikoff-Summers JPE 1981, JEP 1988: inheritance = 80% of total U. S. wealth • Three problems with this controversy: - Bad data - We do not live in a stationary world: life-cycle wealth was much more important in the 1950 s-1970 s than it is today - We do not live in a representative-agent world → new definition of inheritance share → my findings show that the share of inherited wealth has changed a lot over time, but that it is generally much closer to Kotlikoff-Summers (80%) than Modigliani (20%)
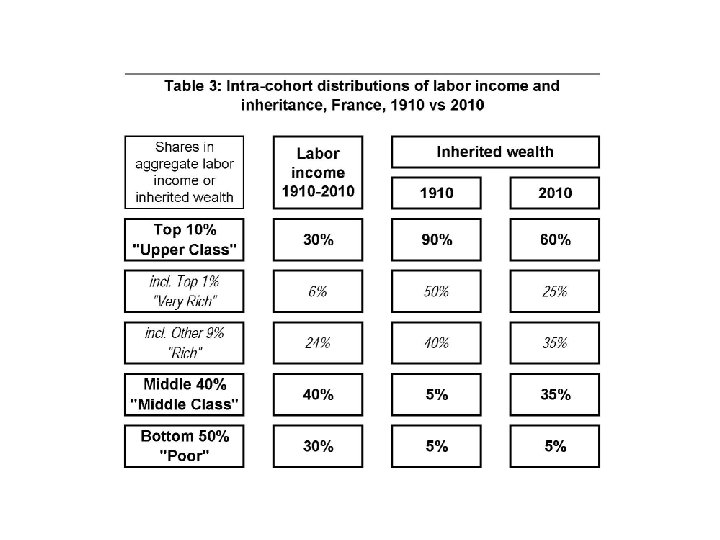
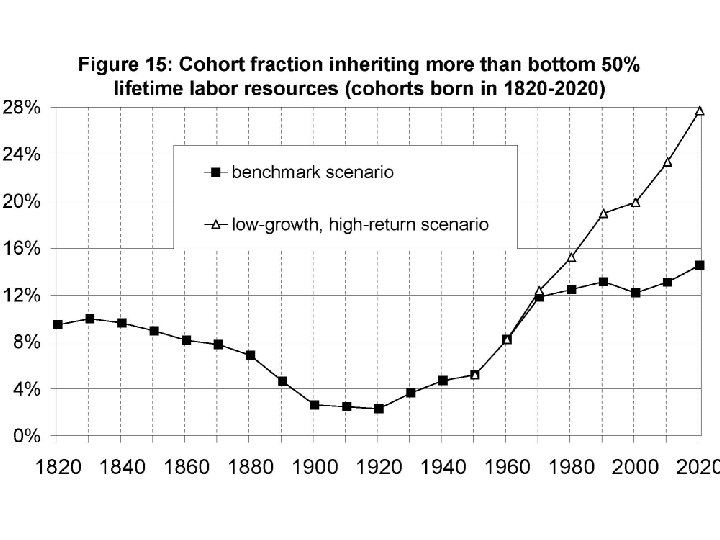
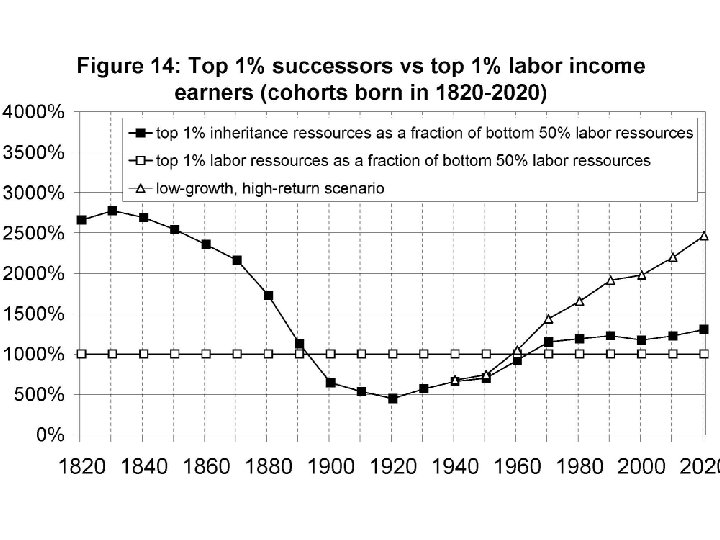
 Back to distributional analysis: macro ratios determine who is the dominant social class • 19 C: top successors dominate top labor earners → rentier society (Balzac, Jane Austen, etc. ) • For cohorts born in 1910 s-1950 s, inheritance did not matter too much → labor-based, meritocratic society • But for cohorts born in the 1970 s-1980 s & after, inheritance matters a lot → 21 c class structure will be intermediate between 19 c rentier society than to 20 c meritocratic society – and possibly closer to the former (more unequal in some dimens. , less in others) • The rise of human capital & meritocracy was an illusion. . especially with a labor-based tax system
 What have we learned? • A world with g low & r>g is gloomy for workers with zero initial wealth… especially if global tax competition drives capital taxes to 0%… especially if top labor incomes take a rising share of aggregate labor income → A world with g=1 -2% (=long-run world technological frontier? ) is not very different from a world with g=0% (Marx-Ricardo) • From a r-vs-g viewpoint, 21 c maybe not too different from 19 c – but still better than Ancien Regime… except that nobody tried to depict AR as meritocratic…
 The meritocratic illusion Democracies rely on meritocratic values: in order to reconcile the principle of political equality with observed socioeconomic inequalities, they need to justify inequality by merit and/or common utility • But effective meritocracy does not come naturally from technical progress & market forces; it requires specific policies & institutions • Two (quasi-)illusions: (1) human K didn’t replace financial K (2) war of ages didn’t replace war of classes • « Meritocratic extremism » : the rise of working rich & the return of inherited wealth can seem contradictory; but they go hand in 21 c discourse: working rich are often viewed as the only cure against the return of inheritance – except of course for bottom 90% workers…
 Convergence vs divergence • Convergence forces do exist: diffusion of knowledge btw countries (fostered by econ & fin integration) & wth countries (fostered by adequate educ institutions) • But divergence forces can be stronger: (1) When top earners set their own pay, there’s no limit to rent extraction → top income shares can diverge (2) The wealth accumulation process contains several divergence forces, especially with r > g → a lot depends on the net-of-tax global rate of return r on large diversified portfolios : if r=5%-6% in 2010 -2050 (=what we observe in 1980 -2010 for large Forbes fortunes, or Abu Dhabi sovereign fund, or Harvard endowment), then global wealth divergence is very likely
") • More competitive & efficient markets won’t help to curb divergence forces: (1) Competition and greed fuel the grabbing hand mechanism; with imperfect information, competitive forces not enough to get pay = marginal product; only confiscatory top rates can calm down top incomes (2) The more efficient the markets, the sharper the capital vs labor distinction; with highly developed k markets, any dull successor can get a high rate of return • r>g = nothing to do with market imperfections • Standard model: r = δ+σg > g (Golden rule) → The important point about capitalism is that r is large (r>g → tax capital, otherwise society is dominated by rentiers), volatile and unpredictable (→ financial crisis)
• More competitive & efficient markets won’t help to curb divergence forces: (1) Competition and greed fuel the grabbing hand mechanism; with imperfect information, competitive forces not enough to get pay = marginal product; only confiscatory top rates can calm down top incomes (2) The more efficient the markets, the sharper the capital vs labor distinction; with highly developed k markets, any dull successor can get a high rate of return • r>g = nothing to do with market imperfections • Standard model: r = δ+σg > g (Golden rule) → The important point about capitalism is that r is large (r>g → tax capital, otherwise society is dominated by rentiers), volatile and unpredictable (→ financial crisis)
 Supplementary slides


 Why did top incomes rise so much? • Hard to account for observed cross-country variations with a pure technological, marginal-product story • One popular view: US today = working rich get their marginal product (globalization, superstars); Europe today (& US 1970 s) = market prices for high skills are distorted downwards (social norms, etc. ) → very naïve view of the top end labor market… & very ideological: we have zero evidence on the marginal product of top executives; it could well be that prices are distorted upwards…
 • A more realistic view: grabbing hand model = marginal products are unobservable; top executives have an obvious incentive to convince shareholders & subordinates that they are worth a lot; no market convergence because constantly changing corporate & job structure (& costs of experimentation → competition not enough) → when pay setters set their own pay, there’s no limit to rent extraction. . . unless confiscatory tax rates at the very top (memo: US top tax rate (1 m$+) 1932 -1980 = 82%) (no more fringe benefits than today) (see Piketty-Saez-Stantcheva, NBER WP 2011)


 The meritocratic illusion Democracies rely on meritocratic values: in order to reconcile the principle of political equality with observed socioeconomic inequalities, they need to justify inequality by merit and/or common utility • But effective meritocracy does not come naturally; it requires specific policies & institutions • Two (quasi-)illusions: (1) human K didn’t replace financial K (2) war of ages didn’t replace war of classes • (1) Technocractic model : Parsons, Galbraith, Becker (unidimensional class structure based upon human K) • But no long run decline of capital share in national income • (2) Lifecycle wealth model: Modigliani • But no long run decline of inherited share in national wealth