

9f207e104f8a1cbdd6e7c40cf80f1d6d.ppt
- Количество слайдов: 16
 Watete, W. P. 1, 2, Kogi-Makau, W. 1, Njoka, J. T. 1, Mac. Opiyo, L. 1 1 University of Nairobi, College of Agriculture and Veterinary Sciences, Kabete 2 Ministry of Agriculture, Livestock and Fisheries, Kenya Corresponding author email address; pwatete@gmail. com
 Poverty levels in pastoral areas seem to be increasing, an indication that poverty reduction strategies being employed are not working. Conventional methods of assessing pastoral poverty are contestable (Devereux, 2007; Tache and Sjaastad, 2010). Why are pastoralists poor? How can pastoral poverty be reduced? This study applied the stages of progress method (Krishna 2010) to establish how pastoral households of northern Kenya have moved into and out of poverty and reasons for the same.
 Pastoral poverty has been on the increase, defying both government and donor poverty reduction strategies. Reasons for increasing pastoral poverty have not been sufficiently understood by all stakeholders. Poverty reduction interventions have therefore failed to achieve their desired outcomes.
 Broad objective: To assess transitory poverty among pastoral households of northern Kenya Specific objectives: To determine how poverty levels among pastoral households of northern Kenya have changed between 1993 and 2013. To establish reasons for household descend into poverty or ascend out of poverty.
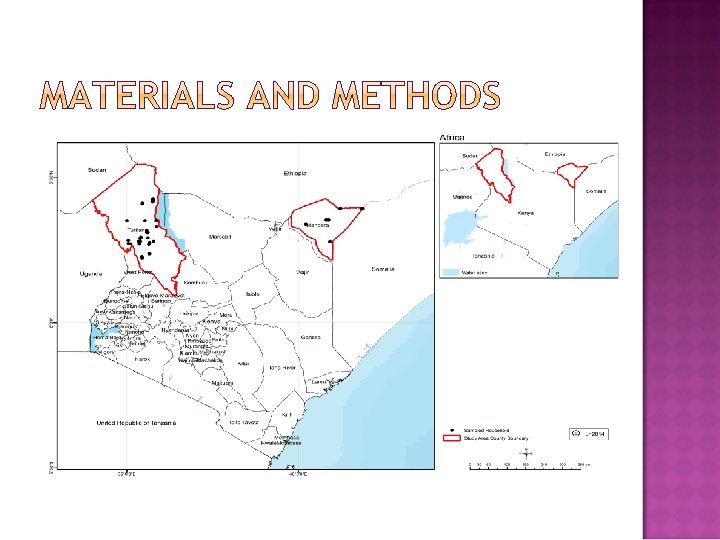
 A survey study was conducted in Turkana and Mandera Counties. The sample households were obtained through multistage sampling: 4 sub Counties in each county (pastoral, agropastoral, off-farm); 30 households per village(354 households in Turkana and 310 households in Mandera) Household interviews were administered to sample households to obtain data on income, expenditure, dominant livelihood strategies and reasons for change in wealth status. In FGD, community members were guided to develop their ‘stages of progress’ scale. Focus group participants were asked to identify well known signifying events that occurred around 1993 and 2003 as a basis of recalling households’ wealth status during the two periods.
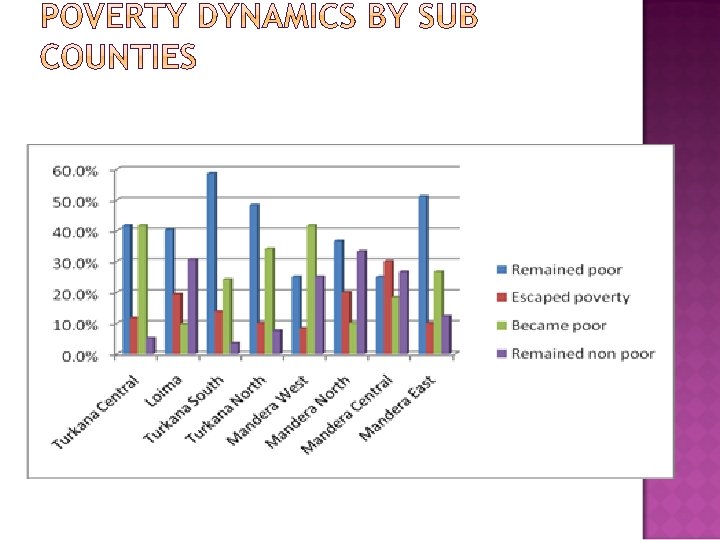
 The participants were then asked to identify the wealth status of sample households in 1993, 2003 and 2013 (Poor, moderate, rich). Sampled households were placed in four categories (remained poor, escaped poverty, became poor, remained non poor)depending on how their wealth status changed between 1993 and 2013. Data was cleaned, coded and entered for analysis using SPSS version 20. Descriptive statistics, Cross tabulations Kruskal Wallis and Mann Whitney tests used to separate variances
 Wealth category Poor Turkana 1. 2. 3. 4. 5. 6. 7. 8. 9. Buys food Buys clothes Buys first goat Increases goats up to 20 Marries Builds a shelter Buys one donkey Buys camel Buys one cow Mandera 1. 2. 3. 4. 5. 6. 7. Rich Increases sheep/goats up to 150 Increases number of camels up to 5 -10 Increases number of cows up to 6 -8 Marries the first wife officially according to Turkana custom Marries out the first daughter 1. 2. 3. 4. Take children to secondary school Buy a farming land along the river Buy a plot in Mandera town Take children to paid tertiary colleges 5. Moderate 1. 2. 3. 4. Afford one meal a day Buy clothes for the family Own few animals (some chicken, 3 goats or 3 sheep) Take children to primary school Make your own makeshift house (Herio) Make an improved better house (Harish) Buy a donkey or young cow 1. 2. 3. 4. 5. Increases number of sheep/goats up to 400 Increases number of camels up to 15 Increases number of cattle up to 15 Increases number of donkeys up to 10 Marries the second wife 1. 2. Buy a second hand vehicle Buy and transport livestock to other markets for sale Make pilgrimage to Mecca Buy modern high class vehicle Settle the family in urban centre 3. 4. 5.
 County Percentage of households per category Remai Escape Becam ned d e non poor poverty poor N (%) (%) Turkana 54 18 19 10 354 Mandera 42 13 17 27 310 96 31 36 37 664 Total
 County Percentage of households per category Escape Becam Remain d e ed non ed poor poverty poor (%) N (%) (%) Turkana 46 14 25 14 354 Mandera 33 18 25 24 310 79 32 50 38 664 Total
 Livelihood Pastoral Agropastoral Off-farm Total Categories of households Ver N y poor Poor Middle Rich (%) (%) 47 20 29 3 202 31 14 53 2 49 19 97 49 83 31 113 2 7 413 664
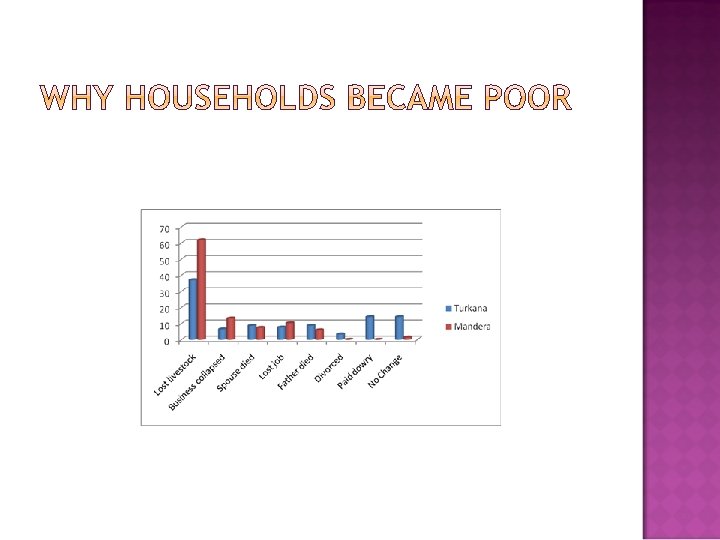
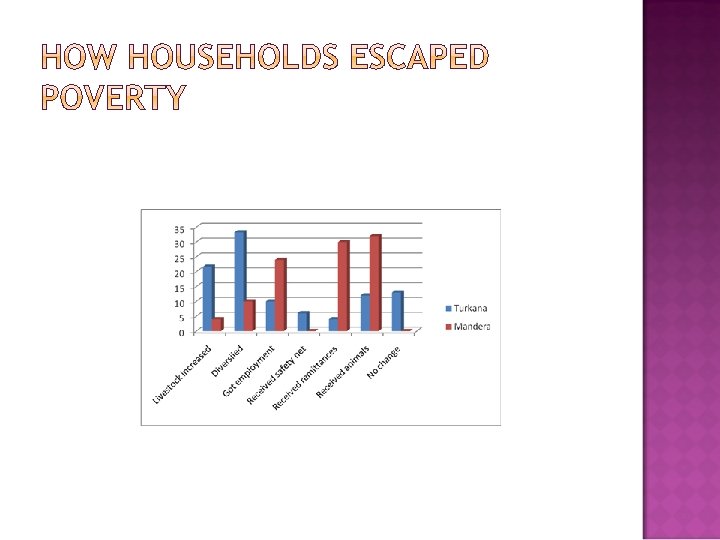
 1. 2. 3. 4. Different pastoral communities follow different pathways out of poverty Conventional methods of assessing poverty tend to exaggerate pastoral poverty Loss of livestock has been a major cause of pauperization among pastoral households of northern Kenya Income diversification and education were important in helping pastoralists of northern Kenya escape poverty
 1. 2. 3. 4. 5. Poverty reduction approaches should be based on community needs; replicating a project from one community to another may not work Use of both quantitative and qualitative poverty assessment methods give a more accurate picture of pastoral poverty Policies that protect and support livestock accumulation should be used to achieve pastoral poverty reduction Both ‘cargo net’ and ‘safety net’ policies should be used to tackle pastoral poverty Livelihood diversification and education are interventions that could help pastoralists escape poverty