

0b2a4ed549644457c015a3cf26d50bda.ppt
- Количество слайдов: 23
 WATER ASSESSMENT AND TESTING Introduction to Watershed Science Merritt College Marc Epstein, Instructor
 Ø Synoptic") WATER MONITORING BASICS Collection of Data Ø Episodic (such as a spill) Ø Synoptic (like snapshot day) Ø Periodic and on a regular basis Ø Continuous over long period of time Consistent collection methods
WATER MONITORING BASICS Collection of Data Ø Episodic (such as a spill) Ø Synoptic (like snapshot day) Ø Periodic and on a regular basis Ø Continuous over long period of time Consistent collection methods
 ANALYSIS DEFINED An investigation into whether a waterbody can support the beneficial uses assigned to it.
 Water quality monitoring is commonly defined as the sampling and analysis of water (lake, stream, river, estuary, or ocean) and conditions of the waterbody.
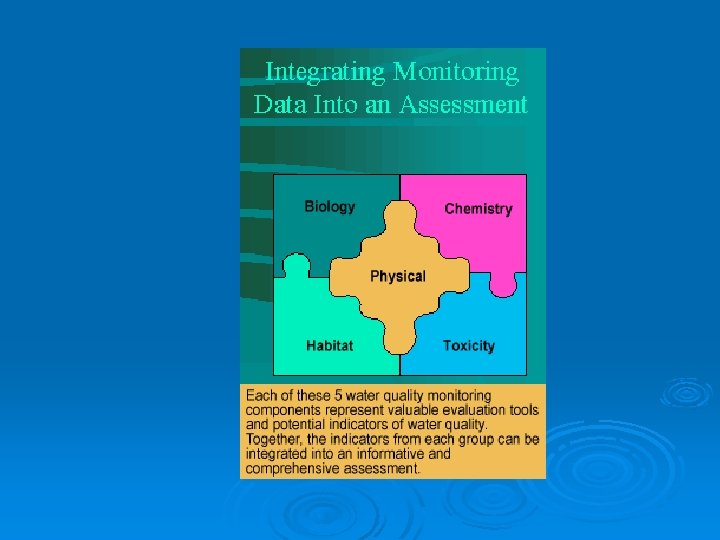
 TYPES OF MONITOING Ø Biological Ø Chemical Ø Physical
 BIOLOGICAL Ø Include measures related to the plant and animal life of the water body, such as: Ø Fish species diversity and abundance; Ø Presence or absence of indicator fishes, aquatic invertebrates, or aquatic plants.
 CHEMICAL Ø Ø Ø Include contaminants such as: Metals Dissolved nutrients Oils Pesticides Chemical properties of the aquatic system such as: Ø Dissolved oxygen Ø Chemical oxygen demand Ø Acid neutralizing capacity Ø
 PHYSICAL Ø Include general conditions such as: Ø Temperature Ø Flow Ø Sediment characteristics Ø Water color Ø Within-channel habitat structure
 A calculation") WHAT IS KWEST MONITORING Ø Ø Ø Total Maximum Daily Load (TMDL) A calculation of the maximum amount of a pollutant that a waterbody can receive and still meet water quality standards, and an allocation of that amount to the pollutant's sources. Water quality standards are set by States, Territories, and Tribes. They identify the uses for each waterbody, for example, drinking water supply, contact recreation (swimming), and aquatic life support (fishing), and the scientific criteria to support that use. A TMDL is the sum of the allowable loads of a single pollutant from all contributing point and nonpoint sources. The calculation must include a margin of safety to ensure that the waterbody can be used for the purposes the State has designated. The calculation must also account for seasonal variation in water quality. (From federal Clean Water Act)
WHAT IS KWEST MONITORING Ø Ø Ø Total Maximum Daily Load (TMDL) A calculation of the maximum amount of a pollutant that a waterbody can receive and still meet water quality standards, and an allocation of that amount to the pollutant's sources. Water quality standards are set by States, Territories, and Tribes. They identify the uses for each waterbody, for example, drinking water supply, contact recreation (swimming), and aquatic life support (fishing), and the scientific criteria to support that use. A TMDL is the sum of the allowable loads of a single pollutant from all contributing point and nonpoint sources. The calculation must include a margin of safety to ensure that the waterbody can be used for the purposes the State has designated. The calculation must also account for seasonal variation in water quality. (From federal Clean Water Act)
 THE BASIC FIVE WATER QUALITY VITAL SIGNS Ø Temperature Ø Dissolved Oxygen Ø p. H Ø Conductivity and Salinity Ø Turbidity
 TEMPERATURE Ø Ø Ø Ø Measure of average kinetic energy of water molecules Affects water chemistry and aquatic organisms Influences: Amount of oxygen that can be dissolved Rate of photosynthesis Metabolic rate of organisms Sensitivity of organisms to toxic waste, parasites, and diseases Timing of reproduction and migration of organisms
 Device Cost Labor Application Limitations Major sources of error TR Bulb") Code (Note a) Device Cost Labor Application Limitations Major sources of error TR Bulb thermometers $5 -20 1 minute Air, Surface water, or sample in jar Low resolution (0. 5 C to 1 C) Inaccurate setting by manufacturer, disconnection of capillary tube from scale, air bubbles in tube TRM U-shaped Min. Max thermometer $25 1 minute Air, incubation chambers Low resolution (1 C). Not recommende d for field use (mercury) Inaccurate setting by manufacturer, disconnection of capillary tube from scale, air bubbles in tube, incomplete resetting TT Digital Thermometer $25 2 min Air, Surface water, inside soil or sediment Needs batteries Inaccurate setting by manufacturer, drift from original setting TT Thermistor probes var Vertical gradients Response depends on length of cable Inaccurate setting by manufacturer, drift from original setting TH Hobo. Temperature Data loggers $60100 10 min (program) 10 min download, plus deployment labor Continuous measurements of temperature in the environment Requires use of computer, need to buy software Inaccurate setting by manufacturer, drift from original setting TTP Sonde/datalogger probe ~$4, 00 0 for entire Sonde 1 min Discrete or continuous measurements Requires use of computer, need to buy software Inaccurate setting by manufacturer, drift from original setting
Code (Note a) Device Cost Labor Application Limitations Major sources of error TR Bulb thermometers $5 -20 1 minute Air, Surface water, or sample in jar Low resolution (0. 5 C to 1 C) Inaccurate setting by manufacturer, disconnection of capillary tube from scale, air bubbles in tube TRM U-shaped Min. Max thermometer $25 1 minute Air, incubation chambers Low resolution (1 C). Not recommende d for field use (mercury) Inaccurate setting by manufacturer, disconnection of capillary tube from scale, air bubbles in tube, incomplete resetting TT Digital Thermometer $25 2 min Air, Surface water, inside soil or sediment Needs batteries Inaccurate setting by manufacturer, drift from original setting TT Thermistor probes var Vertical gradients Response depends on length of cable Inaccurate setting by manufacturer, drift from original setting TH Hobo. Temperature Data loggers $60100 10 min (program) 10 min download, plus deployment labor Continuous measurements of temperature in the environment Requires use of computer, need to buy software Inaccurate setting by manufacturer, drift from original setting TTP Sonde/datalogger probe ~$4, 00 0 for entire Sonde 1 min Discrete or continuous measurements Requires use of computer, need to buy software Inaccurate setting by manufacturer, drift from original setting
 DISSOLVED OXYGEN The amount of oxygen dissolved in water Ø Aquatic organisms need oxygen to survive and grow Ø Ø Ø Consequences of insufficient dissolved oxygen: Death of adults and juveniles Reduction of growth Failure of eggs/larvae to survive Change of species in given water body
 Device Resolutio n (@range) Principle Cost (Note b) Labor Limitations Extent") Code (Note a) Device Resolutio n (@range) Principle Cost (Note b) Labor Limitations Extent of Error (Note c) 1 mg/l (1 -4) 2 mg/l (4 -8) 4 mg/l (8 -12) DOC Colorimetri c Reagent ampoules (Note c) and comparator (e. g. , “CHEMets” by Chemetrics) 1 mg/l (16) 2 mg/l (612) $36/20 tests measure 3 min. DOC Colorimetri c Reagent ampoules (Note d) and comparator (e. g. , “Accu. Vac” by Hach) 0. 2 mg/l (0 -15) $78/25 tests measure 3 min. Leaky seal leads to continuous color development 1 mg/l DOW Titrimetric Modified Winkler Method kit: DO bottle, reagents, vial and syringe for titration 0. 2 mg/l (0 -15) $50 /100 tests measure 8 min. “Sliding” endpoint. 0. 5 mg/l DOE Polarograp hic D. O. meter+electrode 0. 05 -0. 2 mg/l (0 -20) $800 prep/calib. 1 h measure 0. 5 -3 min. Requires expertise and experience 5% DOP Polarographi c Rapid-Pulse probe, for Sonde (e. g. , YSI or Hydrolab) 0. 1 mg/l (020) ~$4, 000 for entire Sonde prep/calib. 2 h Download 1 hr Requires expertise and experience 5%
Code (Note a) Device Resolutio n (@range) Principle Cost (Note b) Labor Limitations Extent of Error (Note c) 1 mg/l (1 -4) 2 mg/l (4 -8) 4 mg/l (8 -12) DOC Colorimetri c Reagent ampoules (Note c) and comparator (e. g. , “CHEMets” by Chemetrics) 1 mg/l (16) 2 mg/l (612) $36/20 tests measure 3 min. DOC Colorimetri c Reagent ampoules (Note d) and comparator (e. g. , “Accu. Vac” by Hach) 0. 2 mg/l (0 -15) $78/25 tests measure 3 min. Leaky seal leads to continuous color development 1 mg/l DOW Titrimetric Modified Winkler Method kit: DO bottle, reagents, vial and syringe for titration 0. 2 mg/l (0 -15) $50 /100 tests measure 8 min. “Sliding” endpoint. 0. 5 mg/l DOE Polarograp hic D. O. meter+electrode 0. 05 -0. 2 mg/l (0 -20) $800 prep/calib. 1 h measure 0. 5 -3 min. Requires expertise and experience 5% DOP Polarographi c Rapid-Pulse probe, for Sonde (e. g. , YSI or Hydrolab) 0. 1 mg/l (020) ~$4, 000 for entire Sonde prep/calib. 2 h Download 1 hr Requires expertise and experience 5%
 p. H Ø Measure of acidic vs. basic – strength of Hydrogen ion Ø Lower value more acidic – Higher value more alkaline Ø Aquatic organisms require narrow p. H Ø Extreme p. H damages fish gills, exoskeleton, and fins Ø Changes in p. H may cause or change chemical reactions http: //waltonfeed. com/old/soaplit. html
 Device Range Resolution (p. H units) Cost Labor Limitations Extent &") Code (Note a) Device Range Resolution (p. H units) Cost Labor Limitations Extent & Sources of Error (p. H units) PHLQ Liquid p. H kit 2 -10 2 $4 /50 tests 2 min Daylight only 2; Aging of indicator PHLQ Liquid p. H kit 5 -10 0. 5 $8 /50 tests 2 min Daylight only 1 Aging of indicator PHST Universal p. H strip (Note b) 1 -14 1 $12 /100 tests 3 min Daylight only 1 Aging of indicator, slow response PHST “Environmental” p. H strip (Note b) 5 -10 0. 5 $12 /100 tests 3 min Daylight only 0. 5 Aging of indicator, slow response PHST “Physiological” p. H strip (Note b) 6. 5 -10 0. 3 $12 /100 tests 3 min Daylight only 0. 3 Aging of indicator slow response r PHEL Pocket meter with dry electrode 1 -14 0. 1 $60 10 min cal, 3 min measure Need to rehydrate 0. 3 Standard buffer drift, slow response PHEL Multi-meter p. H probe 1 -14 0. 1 variable 10 min cal, 3 min measure 0. 3 PHP Sonde/datalogge r probe 1 -14 0. 01 ~$4, 000 for entire Sonde 10 min cal, 3 min measure 0. 1
Code (Note a) Device Range Resolution (p. H units) Cost Labor Limitations Extent & Sources of Error (p. H units) PHLQ Liquid p. H kit 2 -10 2 $4 /50 tests 2 min Daylight only 2; Aging of indicator PHLQ Liquid p. H kit 5 -10 0. 5 $8 /50 tests 2 min Daylight only 1 Aging of indicator PHST Universal p. H strip (Note b) 1 -14 1 $12 /100 tests 3 min Daylight only 1 Aging of indicator, slow response PHST “Environmental” p. H strip (Note b) 5 -10 0. 5 $12 /100 tests 3 min Daylight only 0. 5 Aging of indicator, slow response PHST “Physiological” p. H strip (Note b) 6. 5 -10 0. 3 $12 /100 tests 3 min Daylight only 0. 3 Aging of indicator slow response r PHEL Pocket meter with dry electrode 1 -14 0. 1 $60 10 min cal, 3 min measure Need to rehydrate 0. 3 Standard buffer drift, slow response PHEL Multi-meter p. H probe 1 -14 0. 1 variable 10 min cal, 3 min measure 0. 3 PHP Sonde/datalogge r probe 1 -14 0. 01 ~$4, 000 for entire Sonde 10 min cal, 3 min measure 0. 1
 CONDUCTIVITY / SALINITY Ø Ø Ø Conductivity is the ability of the water to conduct electrical current Salinity is a measure of the amount of salts in the water Salts (solids in dissolved form) break into positively and negatively charged ions Conductivity and salinity increase with the amount of salts in the water Salts affect the quality of water for drinking and irrigation Various species have specific salinity tolerances
 Principle Device Range Resolution Cost Labor Applications Extent & Sources of") Code (Note a) Principle Device Range Resolution Cost Labor Applications Extent & Sources of Error (percent of measured value) EC Electrical conductanc e Conductivit y meter 0 to 200 micro. S 1 micro. S $60 2 min Snowmelt, rainwater 5% uncompensated temperature effect Drift, source of Standard EC Electrical conductanc e Conductivit y meter 0 to 1990 micro. S 10 micro. S $60 2 min Freshwater “ EC Electrical conductanc e Conductivit y meter 0 to 19. 90 mili. S 100 micro. S (0. 1 m. S) $60 2 min Freshwater, Brackish water “ ECP Electrical conductanc e Sonde/data logger probe var ~$4, 000 for entire Sonde 2 min all 5% Drift, source of Standard SAL Electrical conductanc e Salinity probe 2 to 40 ppt (Note b) varies Part of a package $800 or more Brackish and Seawater 5% Drift, source of Standard REF Refractive index Refractome ter 2 -100 ppt (Note c) 1 or 2 ppt $150 1 min Brackish, Seawater, hyp ersaline ponds 10% HYD Specific gravity Hydrometer 16 -40 ppt (Note d) 1 ppt $10 1 min Brackish and Seawater 10% HYD Specific gravity Hydrometer 2 -100 ppt 1 ppt $30 (inc jar) 3 min Brackish, Seawater, hyp ersaline ponds 5 Gravimetric Total dissolved solids (TDS) all 0. 1 mg/l Lab method 5
Code (Note a) Principle Device Range Resolution Cost Labor Applications Extent & Sources of Error (percent of measured value) EC Electrical conductanc e Conductivit y meter 0 to 200 micro. S 1 micro. S $60 2 min Snowmelt, rainwater 5% uncompensated temperature effect Drift, source of Standard EC Electrical conductanc e Conductivit y meter 0 to 1990 micro. S 10 micro. S $60 2 min Freshwater “ EC Electrical conductanc e Conductivit y meter 0 to 19. 90 mili. S 100 micro. S (0. 1 m. S) $60 2 min Freshwater, Brackish water “ ECP Electrical conductanc e Sonde/data logger probe var ~$4, 000 for entire Sonde 2 min all 5% Drift, source of Standard SAL Electrical conductanc e Salinity probe 2 to 40 ppt (Note b) varies Part of a package $800 or more Brackish and Seawater 5% Drift, source of Standard REF Refractive index Refractome ter 2 -100 ppt (Note c) 1 or 2 ppt $150 1 min Brackish, Seawater, hyp ersaline ponds 10% HYD Specific gravity Hydrometer 16 -40 ppt (Note d) 1 ppt $10 1 min Brackish and Seawater 10% HYD Specific gravity Hydrometer 2 -100 ppt 1 ppt $30 (inc jar) 3 min Brackish, Seawater, hyp ersaline ponds 5 Gravimetric Total dissolved solids (TDS) all 0. 1 mg/l Lab method 5
 TURBIDITY Amount of suspended particles including Ø Algae, suspended sediment, and organic matter Ø Ø Ø Ø Suspended particles: Diffuse sunlight – reducing light Absorb heat – Increase temperature Clog fish gills Foul gravel beds Smother fish eggs and benthic insects
 Method name (Parameter, unit) Cost Labor Application Transparency SEC Principle Limitation") Code (Note a) Method name (Parameter, unit) Cost Labor Application Transparency SEC Principle Limitation Murkiness (Note b) None 30 sec Turbidity watch, source ID Transparency Secchi disk (Secchi depth, cm) ~$30 2 min Status of Lakes and pools Need to deploy from above Daylight only 30%; Individual operator’s vision, Extent & Sources of Error Not Applicable Lighting, surface reflection, depth measurements TRT Transparency tube (Transparency, cm) $40 5 min Turbidity in streams Source ID Daylight only 30%; TUJ Transparency match Dual cylinder (Jackson turbidity, JTU) $40 5 min Turbidity in streams Source ID Daylight only 40%; Individual operator’s vision, TUN Light-scattering Nephelometer (Turbidity, NTU) $300 and up 10 min cal 1 min measure Turbidity in streams and lakes, Source ID Error variable, depending on instrument TUN Light-scattering Automated Nephelometer (Turbidity, NTU) $1000 and up Installation, calibration, download. Use with data logger and/or trigger, storm events Fouling of light absorbing surfaces, drift from the calibrated state TSS Gravimetric: Dry Weight per volume of sample aliquot (Note c) Filtration for Total Suspended Solids (TSS, mg/l) $2000 and up 20 min Sediment loads assessments Requires laboratory facility Error variable, depending on operating procedures SSC Gravimetric: Dry Weight per volume (by water weight) of whole sample Filtration for Suspended Sediment Concentration (SSC, mg/l) $2000 and up 20 -60 min Sediment loads assessments Requires laboratory facility Error variable, depending on operating procedures IC Sinking Imhoff Cone Method ~$30 5 min (setup and read) Finer Separation by density Requires cones 30%; Lighting, surface Individual operator’s vision Length measurement, deposition quality of standard, volume measurements identification, volume measurements
Code (Note a) Method name (Parameter, unit) Cost Labor Application Transparency SEC Principle Limitation Murkiness (Note b) None 30 sec Turbidity watch, source ID Transparency Secchi disk (Secchi depth, cm) ~$30 2 min Status of Lakes and pools Need to deploy from above Daylight only 30%; Individual operator’s vision, Extent & Sources of Error Not Applicable Lighting, surface reflection, depth measurements TRT Transparency tube (Transparency, cm) $40 5 min Turbidity in streams Source ID Daylight only 30%; TUJ Transparency match Dual cylinder (Jackson turbidity, JTU) $40 5 min Turbidity in streams Source ID Daylight only 40%; Individual operator’s vision, TUN Light-scattering Nephelometer (Turbidity, NTU) $300 and up 10 min cal 1 min measure Turbidity in streams and lakes, Source ID Error variable, depending on instrument TUN Light-scattering Automated Nephelometer (Turbidity, NTU) $1000 and up Installation, calibration, download. Use with data logger and/or trigger, storm events Fouling of light absorbing surfaces, drift from the calibrated state TSS Gravimetric: Dry Weight per volume of sample aliquot (Note c) Filtration for Total Suspended Solids (TSS, mg/l) $2000 and up 20 min Sediment loads assessments Requires laboratory facility Error variable, depending on operating procedures SSC Gravimetric: Dry Weight per volume (by water weight) of whole sample Filtration for Suspended Sediment Concentration (SSC, mg/l) $2000 and up 20 -60 min Sediment loads assessments Requires laboratory facility Error variable, depending on operating procedures IC Sinking Imhoff Cone Method ~$30 5 min (setup and read) Finer Separation by density Requires cones 30%; Lighting, surface Individual operator’s vision Length measurement, deposition quality of standard, volume measurements identification, volume measurements
 BEYOND THE FIVE BASIC VITAL SIGNS Ø Nitrogen Ø Large amount introduced creates excessive algal growth resulting in depleted dissolved oxygen Ø Phosphate Ø When amounts become elevated algal blooms can occur depleting dissolved oxygen
 Bio-Assessment Ø Survey of benthic aquatic macro invertebrates Ø Survey of physical habitat