

8ebedf355683cc64611a1c1349a7299e.ppt
- Количество слайдов: 20
 Water. Aid Tanzania Policy Programme Finance Strengthening Design, and Delivery of Water Supply and Sanitation Programmes under PRSPs February 2004 Kampala
 The PRS and Water Indicator: Proportion of households with access to safe drinking water (in rural and urban areas). Target: Raise the proportion of the rural population that has access to safe and clean water from 48. 5 percent in 2000 to 55 percent in 2003. Initiative: Rehabilitation of malfunctioning water supply schemes, protection of water sources, and some expansion of new schemes (to be determined by local communities);
 The PRS and Water - Some limitations There are no explicit references to : 1. Affordability 2. Time or distance to source 3. Sanitation indicators or targets 4. Water resources and water for livelihoods
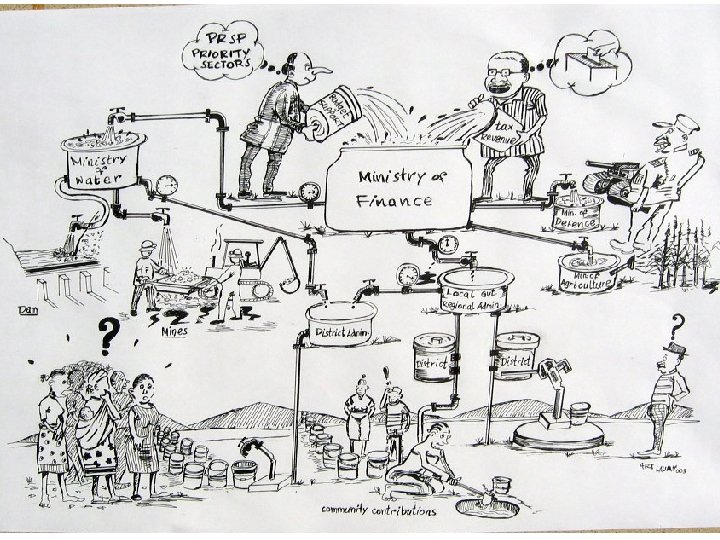
 Analysing policy implementation Public spending on water and sanitation Public Expenditure Review Budget Analysis Expenditure Tracking Composition of spending Public provision of services Benefit Incidence Composition of service providers Detailed impact studies Total consumption of services Livelihood outcomes
 Regional variation in access to improved water sources Percentage of rural households using improved water sources
 Expenditure on water - actual and planned


 Household use of water source by expenditure quintile for rural Tanzania
 Equity and subsidies Piped and Protected Water Supplies • Anything with a tap was ‘piped’ • Household sizes larger for poorer quintiles • Wealthier quintiles buy more water so unit subsidy greater • Piped investments 10 times that of protected investments

") Estimated regional rehabilitation costs against regional coverage (piped + protected)
Estimated regional rehabilitation costs against regional coverage (piped + protected)


 Budget Guidelines 2004/5 Restructuring of Input to Budget Guidelines - District water transfers Increase in rural water supply allocations 2003/4 allocation Tsh 2004/5 allocation Tsh Rural 17. 3 bn 52. 5 bn Urban 21. 3 bn 23. 0 bn Implementation Capacity?
 Budget Guidelines 2004/5… Pro-Poor Targeting - Piped versus protected investments? Sanitation Contentious sub-votes - Lake victoria, DDCA, Other Charges Comparing across sectors The 31% rise in overall ceiling for the water sector is matched by the following rises in other priority sectors; Education +10%, Health +35%, Judiciary +7%, Agriculture +25%, Roads +25%, HIV/AIDS +100% Foreign flexibility?
 Time spent fetching water (to go, wait, collect and return home - not necessarily dry season source)
 Building Blocks From the PRSP: Reform of the public sector (including central and local Government), being supported under PRGF, PSAC-I, Public Service Reform Programme (PSRC) and by other initiatives supported by international partners From the National Water Policy: The new strategy, in conformity with ongoing reforms in the public sector, is for Government to change its role from being implementer to a regulator, facilitator and coordinator.
") Main drinking water supply for households 1991 -2000. (HBS)
Main drinking water supply for households 1991 -2000. (HBS)