8fea7679871482867ddb504124f44423.ppt
- Количество слайдов: 37


Waste Management in the UK Ken Sherwood November 2016

§ CIWM § Waste Statistics in the UK § UK drivers, targets and policies § Issues

About CIWM § Founded 1898 § Royal Charter from HM Queen 2002 § Approx 7, 000 Members § 10 Regional/National Centres § Members in all Sectors of the Industry § Independently Funded

CIWM activities § Scientific and Technical § Publications § Education and Training § Government Liaison § Commercial Activities – CIWM Enterprises Ltd § Major Exhibitions of Plant & Equipment

CIWM activities § Annual Conference § Seminars & Workshops § Vocational Training Courses § Qualifying Courses § Library § Careers Advice § ISWA national member

Special Interest Groups § § § § § Biological Treatment Hazardous waste Healthcare waste Waste Regulation Thermal Treatment Waste Prevention Collection, cleansing and recycling Waste strategy Health & Safety

The distribution of waste arising in England by the key sectors, Defra 2014
, Defra 2010")
Composition of Household waste (by weight), Defra 2010

Household Waste Recycled by Material 10, 000 Household waste recycled by material: England, 2000 -01 to 200910 (tonnes) 9, 000 8, 000 7, 000 Other Co-mingled 6, 000 Plastics Cans 5, 000 4, 000 Textiles Scrap metals and white goods Compost 3, 000 Glass Paper and card 2, 000 1, 000 0 2000 -1 2001 -2 2002 -3 2003 -4 2004 -5 2005 -6 2006 -7 2007 -8 2008 -9 2009 -10

Municipal Waste recycling rates in 32 European countries, 2001 an 2010 §

United Kingdom Municipal Waste Management 2008/9 Recycled/ composted 36% Other 1% Incineration with Ef. W 10% Landfill 53%

United Kingdom Municipal Waste Management 2011/12 Recycled/ Composted 42%

Local Authority collected waste England 2014/15 Recycled/ Composted 42%

Municipal Waste generation and treatment in EU 1995 - 2010

Municipal waste landfilling rates in 32 European countries, 2001 and 2010

The decline of UK landfill since the late 1990’s– where will it end?

Lessons Learnt 17

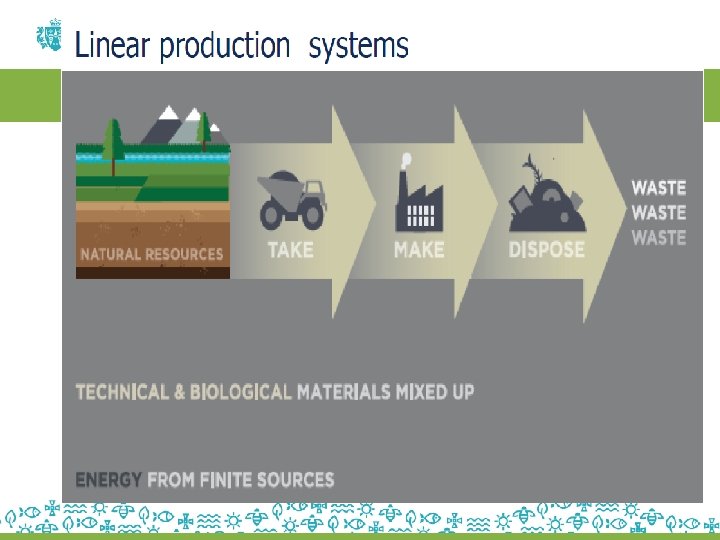
Waste Hierarchy 18

Growth Opportunities § Waste and Recycling Sector employs over 150, 000 § 37% increase by 2020 § 70% recycling target => 50, 000 jobs § Waste and recycling sector = £ 11 bn/yr
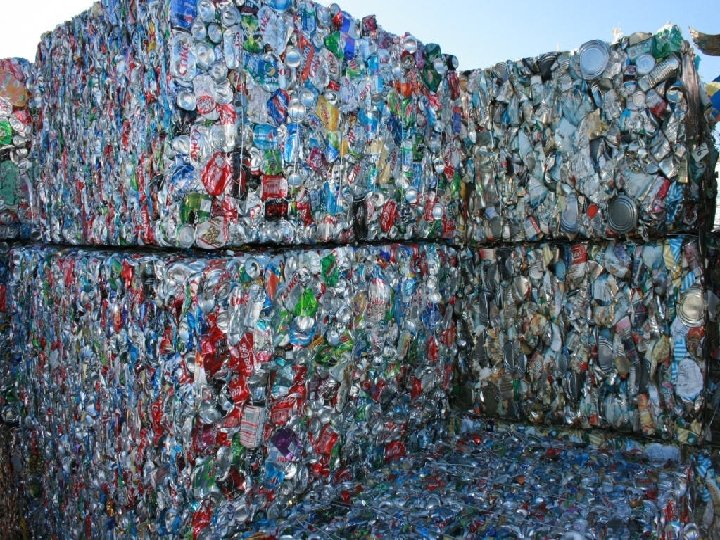

Steel Can Prices 2006 -2016

Aluminium Can Prices 2016

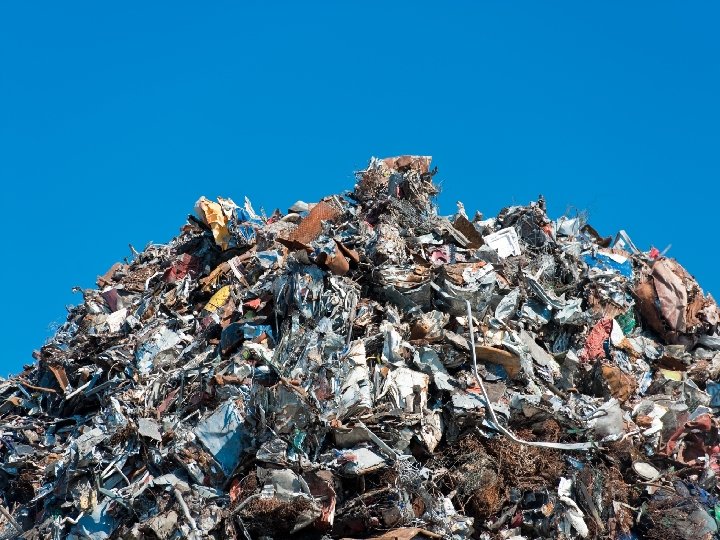
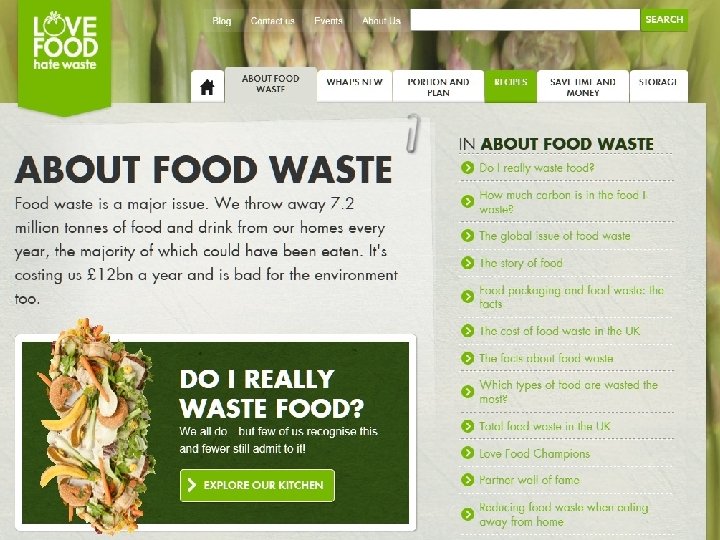
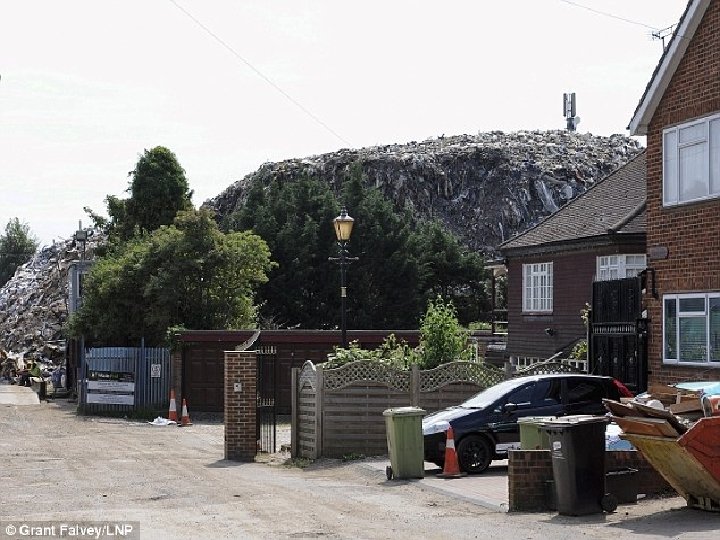
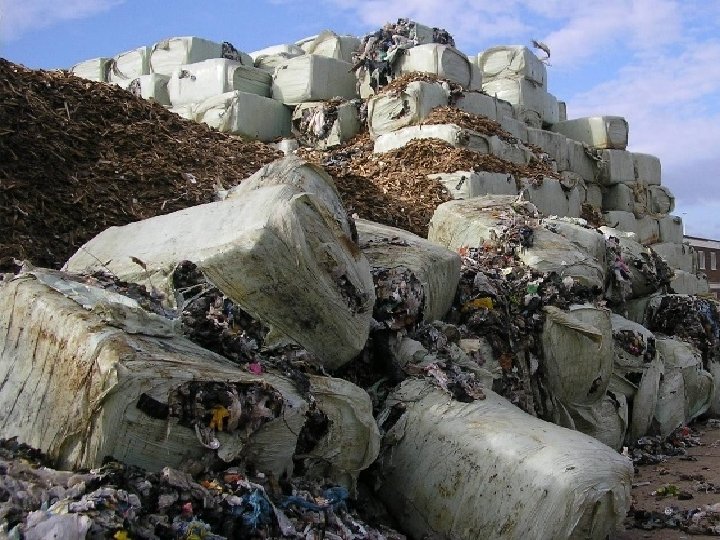
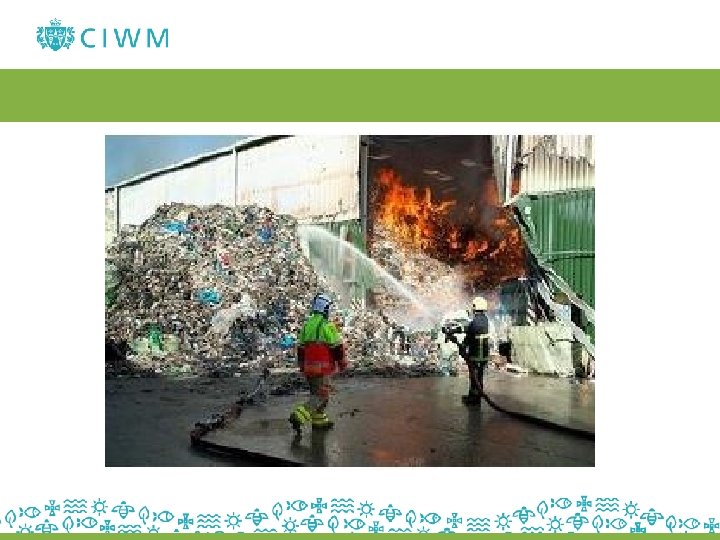
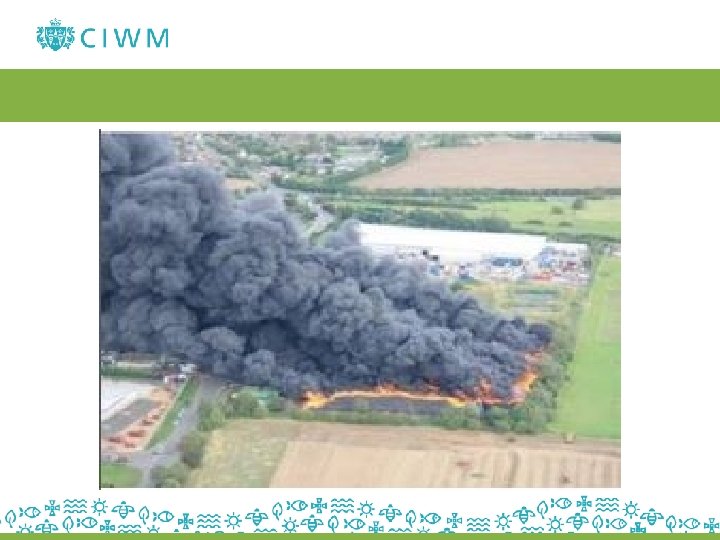
The Issues § § § § Food Waste Product Design Harmonisation Local Authority Austerity Circular Economy Material Quality Waste Crime Fires at Waste Facilities

Waste on the Frontline – Challenges and Innovations?

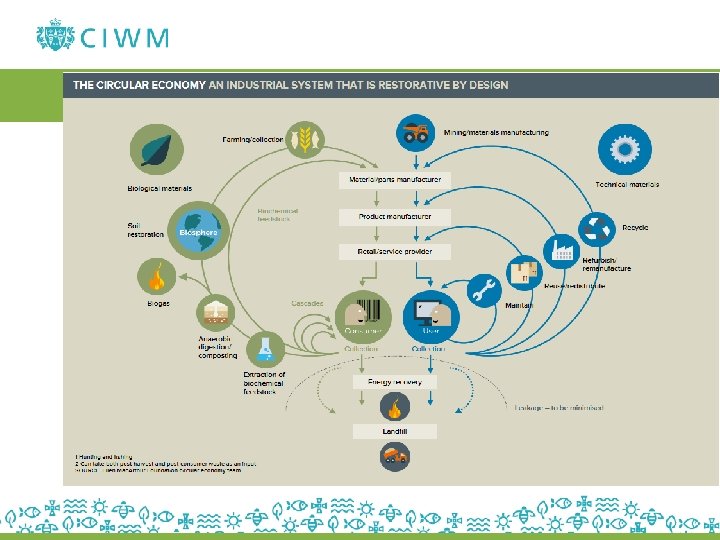
Circular production and consumption Resource Management Built Environment Diagram Source: Annex 1 to the Letter to the Dutch House of Representatives headed Implementation of the Waste to Resource programme, 2014 Food & Drink Products

Key campaigns in 2016

Which way now? – and for whom? EU+ EU EU - LIKE NOW 2030 Andrea Leadsom So. S Env EU - LITE EU? – “No Thanks” Therese Coffey Defra Minister

www. ciwm. co. uk
8fea7679871482867ddb504124f44423.ppt