

6ca81d0d1d466ad31e2e0ec3ad9f0845.ppt
- Количество слайдов: 46
 Vom Preis des Klimaschutzes und vom Wert der Erde Kosten-Nutzen-Analyse und das Konzept der ‘starken’ Nachhaltigkeit in der Klimapolitik Mittwoch, 18. April 2007 ETH Zürich Dr. Ottmar Edenhofer
 Cost-Benefit-Analysis
 Source: Edenhofer, Lessmann et al. 2006 Mitigation Costs with ITC
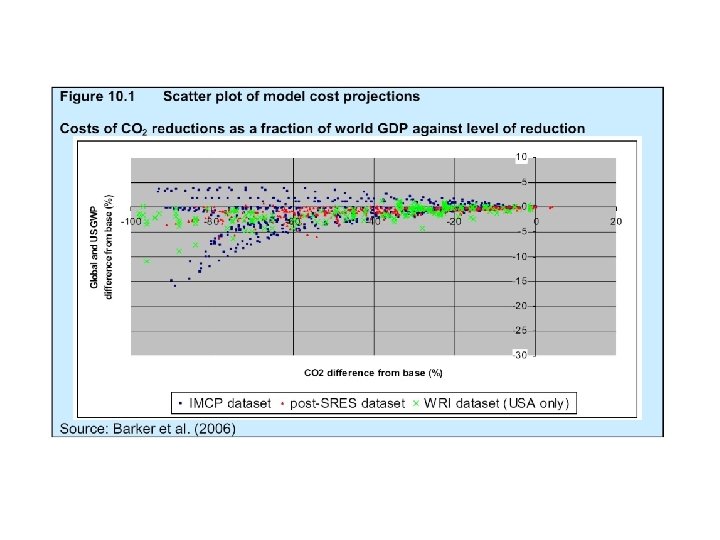
 Economists trying to guess the ultimate costs of limiting carbondioxide concentrations…most estimates are at the low end – below 1 %. The Economist September 9 th 2006, p. 9 Sir Nicholas has tried to assess the future costs of climate change…and has set them against the costs of cutting fossil-fuel usage enough to stabilise carbondioxide concentration in the atmosphere. His answer to the second part of his calculation is fairly uncontroversial. The Economist November 4 th 2006, p. 14
 Economic Damages in % of GDP Natural Scientists Kemfert-high Stern Review In % of GDP Environmental Scientists Nordhaus Kemfert-low Social Scientists Tol Temperature Increase Source: OECD (2003) and Kemfert (2004)
 Economic Damages in % of GDP Natural Scientists Kemfert-high Stern Review In % of GDP Environmental Scientists Nordhaus Kemfert-low Social Scientists Tol Temperature Increase Source: OECD (2003) and Kemfert (2004)
 Losses") Cost-Benefit Analysis Losses BAU: GWP - 0. 84% / 8. 5% (2175 -2195) Losses CBA: GWP - 0. 8% / 1. 8% (2050) ; Cons. - 1. 2% / 3. 3%(2050)
Cost-Benefit Analysis Losses BAU: GWP - 0. 84% / 8. 5% (2175 -2195) Losses CBA: GWP - 0. 8% / 1. 8% (2050) ; Cons. - 1. 2% / 3. 3%(2050)
 Stern‘s Welfare Function = Welfare = Consumption = Intragenerational Equity = Pure Rate of Time Preference
 Stern‘s Welfare Function = Welfare = Consumption = Intragenerational Equity = Pure Rate of Time Preference
 Stern‘s Welfare Function = Welfare = Consumption = Intragenerational Equity = Pure Time Preference Rate
 Comment: Ethical Duality Both parameters determine the overall investment rate i in a simple Ramsey model: = Labour Productivity = Capital Income Share = Population Growth
 Investment Rate and Ethical Duality Inequality between Rich and Poor Intergenerational Inequality 0. 1 % 1% 5% 2 18 % 16 % 12 % 1 36 % 30 % 18 % 0. 5 70 % 51 % 24 % a = 5 %, n = 1 %, = 30 %
 Investment Rate and Ethical Duality Inequality between Rich and Poor Intergenerational Inequality Equality 0. 1 % 1% 5% 2 18 % 16 % 12 % 1 36 % 30 % 18 % 0. 5 70 % 51 % 24 % a = 5 %, n = 1 %, = 30 % Inequality

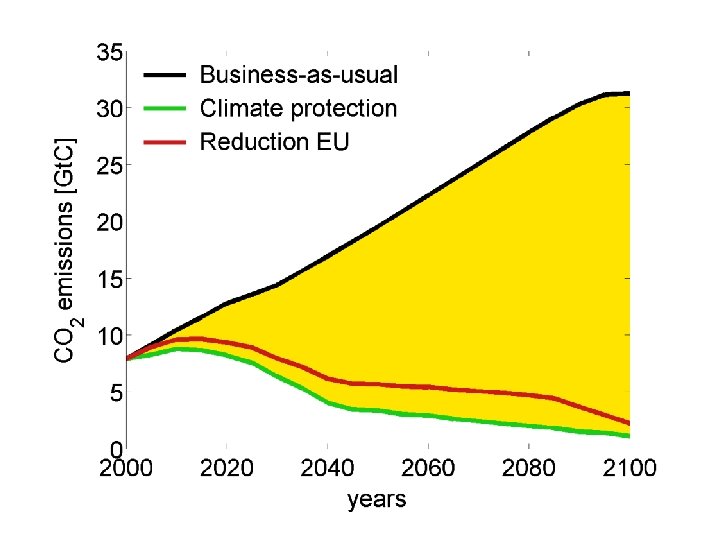
 The Mitigation Gap ‘Business as Usual’ Emissions Reduction
 Mitigation Costs and Induced Technological Change
 What is an Energy System?
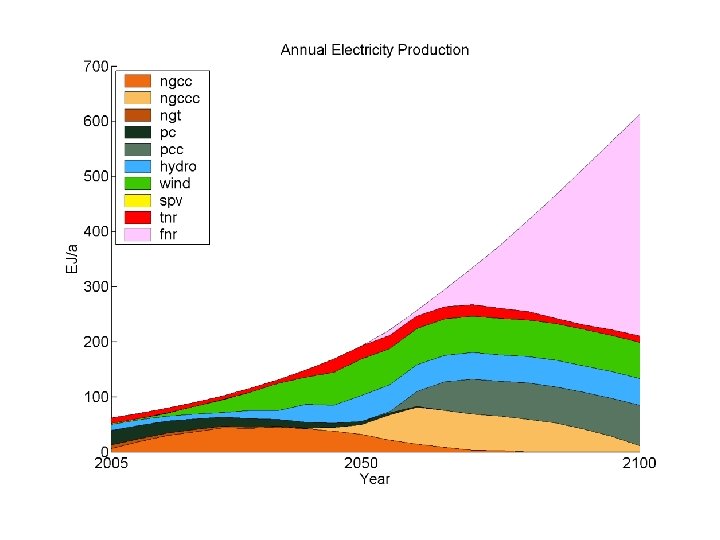
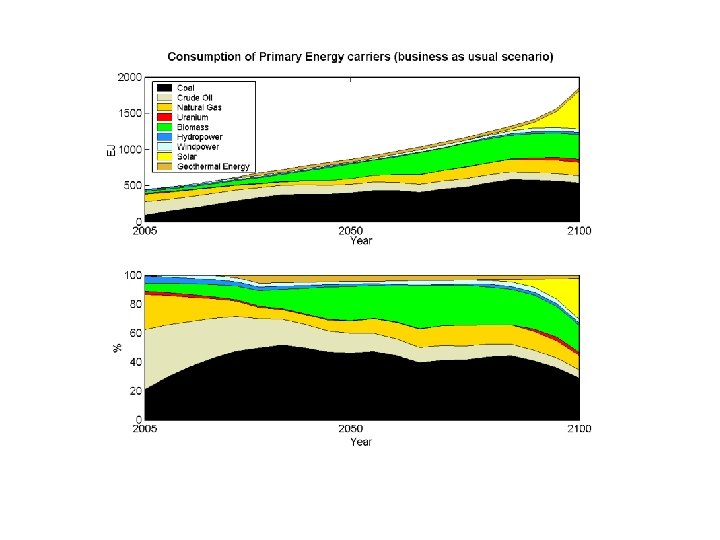
 Coal PC Biomass Combined Heat-power Solar energy") EJ/a Electricity production (business as usual scenario) Coal PC Biomass Combined Heat-power Solar energy Natural Gas NGCC Wind energy Hydropower Source: Edenhofer/Lueken 2007 Nuclear LWR Geothermal energy
EJ/a Electricity production (business as usual scenario) Coal PC Biomass Combined Heat-power Solar energy Natural Gas NGCC Wind energy Hydropower Source: Edenhofer/Lueken 2007 Nuclear LWR Geothermal energy
 Hard Coal: Global Distribution of Reserves & Resources 2, 078 Gt = scaling factor 1 Global Reserves: 728 Gt Source: BGR (2005), Reserves, Resources and Availability of Energy Resources 2005
 Brown Coal: Global Distribution of Reserves & Resources 434 Gt = scaling factor 1 Global Reserves: 207 Gt Source: BGR (2005), Reserves, Resources and Availability of Energy Resources 2005
 Extraction Costs for Fossil Fuels
 Extraction Costs for Uranium
 Extraction Costs for Uranium
 The Nuclear Energy Sector in REMIND Uranium Ore TNR fuel production TNR Fresh fuel Thermal Reactor TNR Spent fuel Electricit y TNR direct disposal TNR Spent fuel TNR reprocessing ILW Depleted uranium Plutonium HLW Plutonium conditioning ILW HLW t&s HLW LLW Recycled uranium ILW t&s LLW T&s LLW intermediate storage FNR reprocessing FNR Spent fuel FNR direct disposal FNR Spent fuel Terminal storage FNR fuel production FNR Fresh fuel Fast Reactor Electricit y
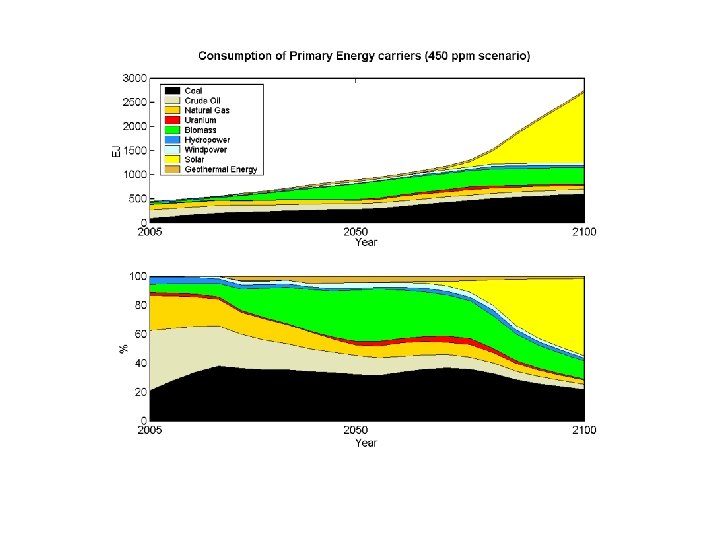
 Coal PC Biomass Combined Heat-power Natural Gas NGCC") Electricity production EJ/a (450 ppm Scenario) Coal PC Biomass Combined Heat-power Natural Gas NGCC with CCS Solar energy Natural Gas NGCC Wind energy Hydropower Nuclear LWR Geothermal energy
Electricity production EJ/a (450 ppm Scenario) Coal PC Biomass Combined Heat-power Natural Gas NGCC with CCS Solar energy Natural Gas NGCC Wind energy Hydropower Nuclear LWR Geothermal energy
 Energy costs due to") EJ/a Electricity production (450 ppm scenario with nuclear power phase-out) Energy costs due to nuclear power phase-out will increase by 4. 6 % Coal PC Biomass Combined Heat-power Natural Gas NGCC with CCS Solar energy Natural Gas NGCC Wind energy Hydropower Nuclear LWR Geothermal energy
EJ/a Electricity production (450 ppm scenario with nuclear power phase-out) Energy costs due to nuclear power phase-out will increase by 4. 6 % Coal PC Biomass Combined Heat-power Natural Gas NGCC with CCS Solar energy Natural Gas NGCC Wind energy Hydropower Nuclear LWR Geothermal energy
 (mitigation costs with nuclear") Additional costs due to nuclear phase-out relative cost increase (%) (mitigation costs with nuclear phase-out minus mitigation costs without nuclear phase-out ) learning rate of solar energy Default values for solar energy: learning rate 0, 2 – floor costs 1000 $/k. W floor costs of solar energy ($/k. W)
Additional costs due to nuclear phase-out relative cost increase (%) (mitigation costs with nuclear phase-out minus mitigation costs without nuclear phase-out ) learning rate of solar energy Default values for solar energy: learning rate 0, 2 – floor costs 1000 $/k. W floor costs of solar energy ($/k. W)
 Biomasse: Potential and its utilisation
 Natürl. Veget. (Gt.") Menschliche Eingriffe in die Biosphäre Gegenwärtige Aneignung der globalen Netto-Primärproduktion (HANPP) Natürl. Veget. (Gt. C/yr) Aktuelle Vegetation 65. 5 59. 2 Menschliche Veränderte Vegetation Ernte / Entnahme Eingriffe Feuer 6. 3 7. 2 1. 1 HANPP Total Rückflüsse 100% 90% Haberl et al. (2006) 10% 11% = 270 EJ/yr (kalorisch) (inkl. 35 -55 EJ/yr Bioenergie) 2% 14. 7 23% 1. 5 2% Bioenergie-Projektionen bis 2100: 400 EJ/yr = 7 -9 Gt. C/yr
Menschliche Eingriffe in die Biosphäre Gegenwärtige Aneignung der globalen Netto-Primärproduktion (HANPP) Natürl. Veget. (Gt. C/yr) Aktuelle Vegetation 65. 5 59. 2 Menschliche Veränderte Vegetation Ernte / Entnahme Eingriffe Feuer 6. 3 7. 2 1. 1 HANPP Total Rückflüsse 100% 90% Haberl et al. (2006) 10% 11% = 270 EJ/yr (kalorisch) (inkl. 35 -55 EJ/yr Bioenergie) 2% 14. 7 23% 1. 5 2% Bioenergie-Projektionen bis 2100: 400 EJ/yr = 7 -9 Gt. C/yr
 Comparative Advantage of Renewables
 EEA, 2006") Bioenergy Potential of Europe (15% of Primary Energy Consumption in 2030) EEA, 2006
Bioenergy Potential of Europe (15% of Primary Energy Consumption in 2030) EEA, 2006
 Anteil der Emissionen nach Sektoren im Jahr 2000 Stern Review, 2006
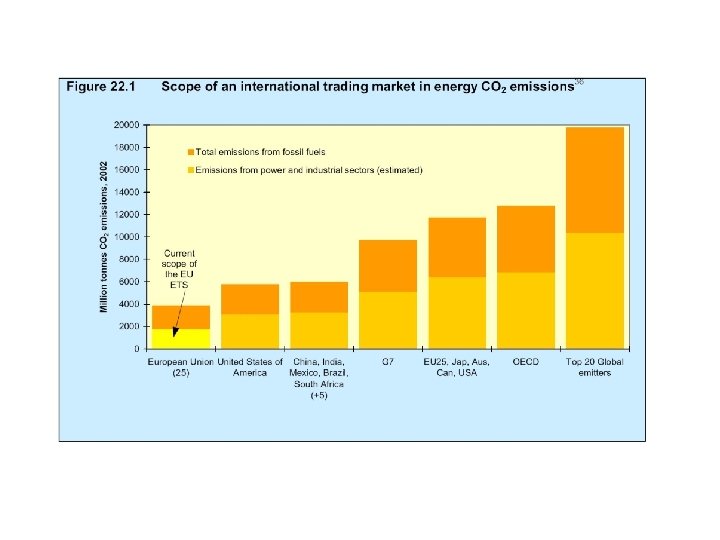
 EU Commission: An Energy Policy for Europe Climate Protection 2° C - 450 ppm Security of Supply Competitiveness Curb Emissions Diversify and Stabilise Energy Imports - Energy Charter EU-Russia - Launch North-Africa-EU energy partnership - Establish EU strategic gas reserve - 20% reduction EU emissions by 2020 - 30% reduction industrialised nations and EU 2020, if negotiatable - 60 -80% reduction target for industrialised nations until 2050 - 20% share renewables in EU primary energy by 2020 - 20% improvement in energy efficiency 2020 - 10% share biofuels 2020 - 12 large CCS plants in EU 2015 - Reform and extend EU ETS - A European Strategic Energy Plan (SET-Plan) Liberalize EU Energy Markets - Ownership unbundling energy transmission - Stronger regulation energy markets - Expand trans-european energy grids
 Source: IEA
 The Carbon Market Cap: Reduced Emissions CO 2 -Emissions Auction CO 2 Certificates Grandfathering! buy CO 2 Market Fossil Power Plant CO 2 Price CO 2 Certificates sell Fossil Power Plant Electricity Grid Efficiency Renewable Energy Households Industry Carbon Capturing and Sequestration
 Verkehrssektor in den Emissionshandel!
 A Bretton Woods Carbon Market CO 2 -Emissions EU ETS RGGI Global CO 2 Market Carbon Central Bank CO 2 Price (Global) Technology Initiative California Efficiency Renewable Energy CCS
 EUA Closing Prices, historical The graph shows daily bid-offer close EUA Dec 2007 prices from December 2004 (blue line) in the OTC market, and EUA Dec 2008 from Sept 2005 (red line). The data was updated 15 March 2007 32€ 28€ 24€ 20€ 16€ 12€ 8€ 4€ 0€ c De 05 6 07 05 r 05 05 g 05 t 05 c 05 06 06 06 g 0 t 06 c 06 r un b b b p n Au Oc De Fe Fe Fe A Ju Ap J Source: Point Carbon