1_Водные_ресурсы_России.pptx
- Количество слайдов: 40
 Водные ресурсы рек Российской Федерации Mikhail Georgievsky (State Hydrological Institute, St. Petersburg, Russia) (mgeorgievsky@hotmail. com) Based on materials of SHI researchers: I. A. Shiklomanov, V. Yu. Georgievsky, I. L. Kalyuzhnyi, S. A. Lavrov, V. I. Babkin, Zh. A. Balonishnikova, V. S. Vuglinsky, S. A. Zhuravin, O. A. Anisimov, E. V. Gurevich, M. L. Markov, A. L. Shalygin
 Presentation Outline • River water resources of the Russian Federation and their long-term dynamics • Changes in seasonal runoff • Possible future changes
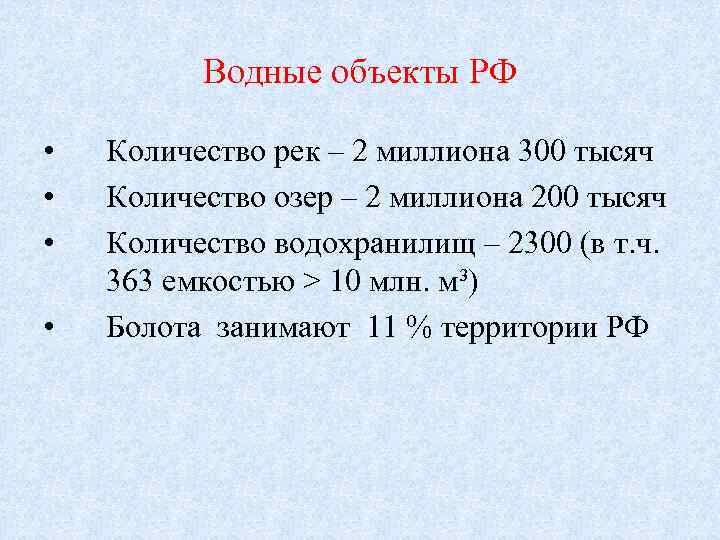 Водные объекты РФ • • Количество рек – 2 миллиона 300 тысяч Количество озер – 2 миллиона 200 тысяч Количество водохранилищ – 2300 (в т. ч. 363 емкостью > 10 млн. м³) Болота занимают 11 % территории РФ
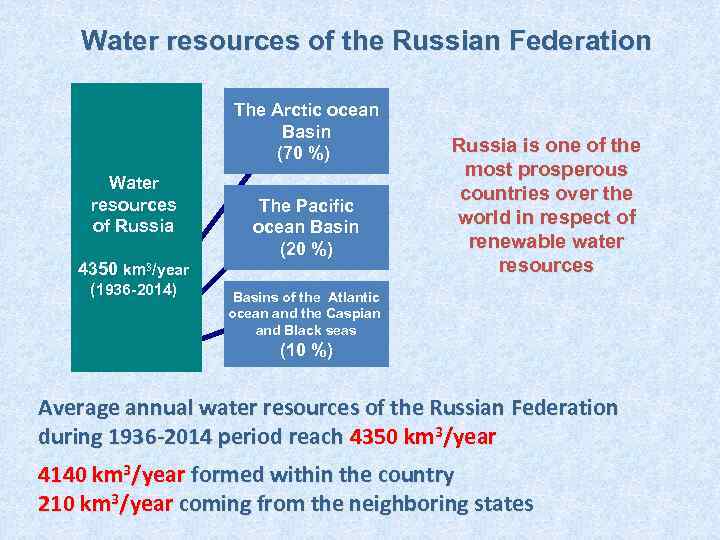 Water resources of the Russian Federation The Arctic ocean Basin (70 %) Water resources of Russia The Pacific ocean Basin (20 %) 4350 km 3/year (1936 -2014) Russia is one of the most prosperous countries over the world in respect of renewable water resources Basins of the Atlantic ocean and the Caspian and Black seas (10 %) Average annual water resources of the Russian Federation during 1936 -2014 period reach 4350 km 3/year 4140 km 3/year formed within the country 210 km 3/year coming from the neighboring states
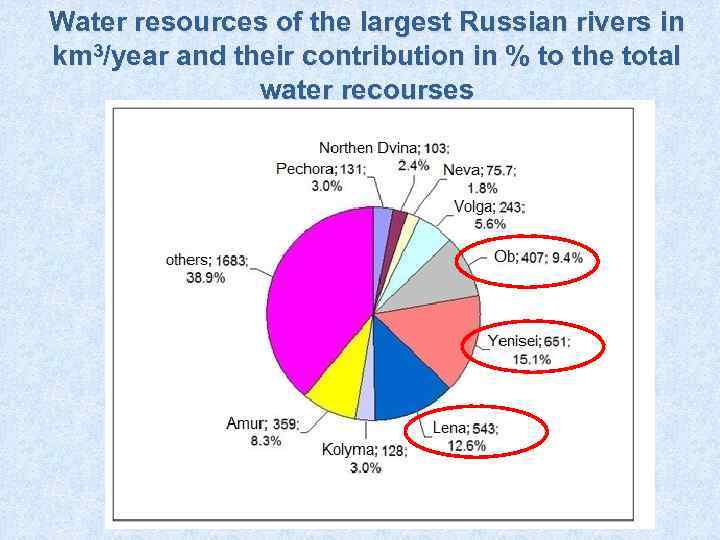 Water resources of the largest Russian rivers in km 3/year and their contribution in % to the total water recourses
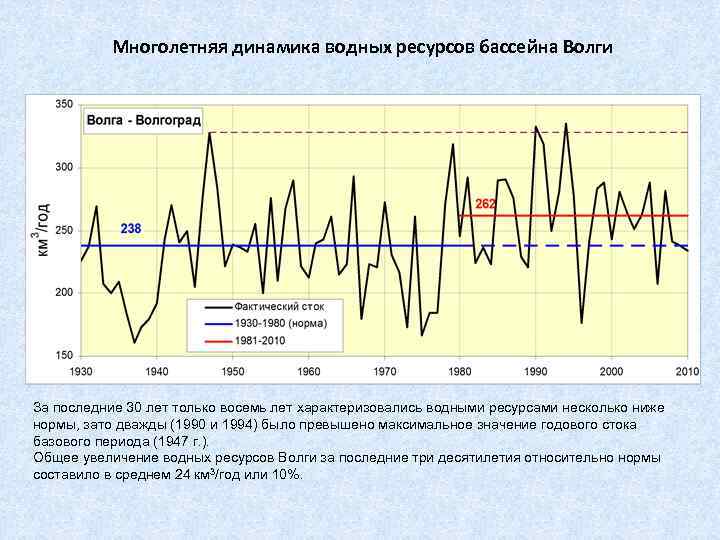
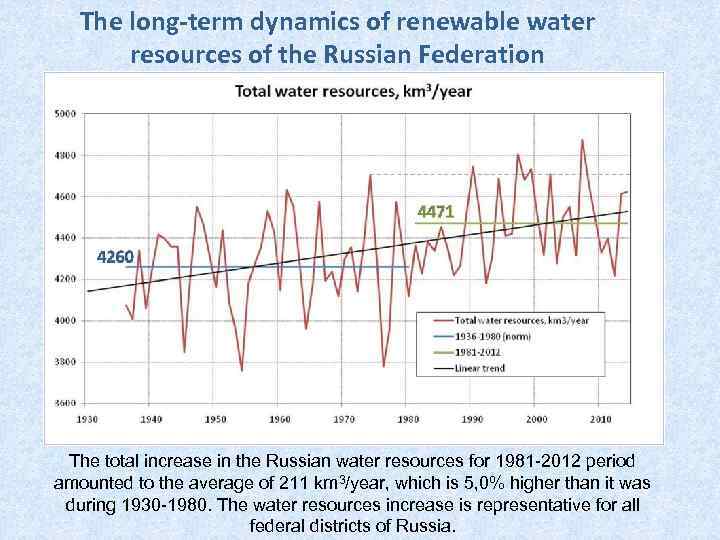 The long-term dynamics of renewable water resources of the Russian Federation The total increase in the Russian water resources for 1981 -2012 period amounted to the average of 211 km 3/year, which is 5, 0% higher than it was during 1930 -1980. The water resources increase is representative for all federal districts of Russia.
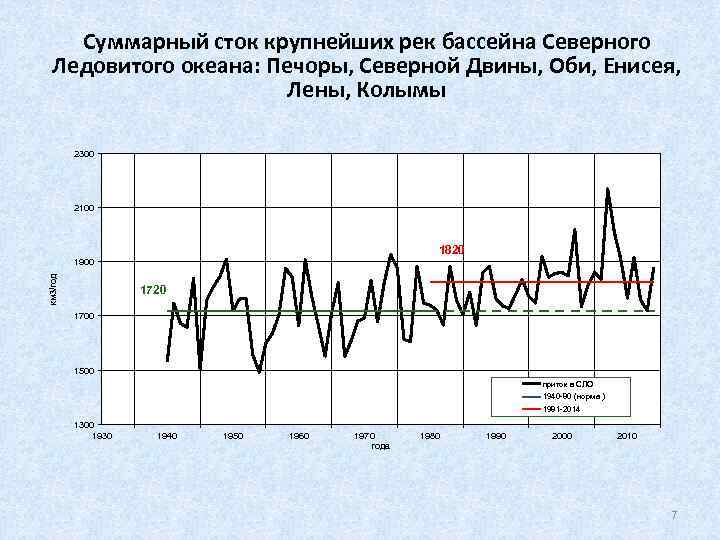 Суммарный сток крупнейших рек бассейна Северного Ледовитого океана: Печоры, Северной Двины, Оби, Енисея, Лены, Колымы 2300 2100 1820 км 3/год 1900 1720 1700 1500 приток в СЛО 1940 -80 (норма ) 1981 -2014 1300 1930 1940 1950 1960 1970 года 1980 1990 2000 2010 7
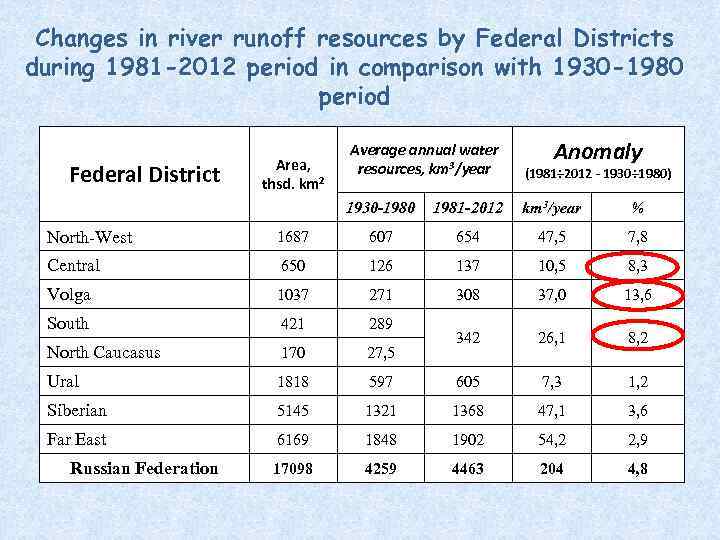 Changes in river runoff resources by Federal Districts during 1981 -2012 period in comparison with 1930 -1980 period Federal District Area, thsd. km 2 Average annual water resources, km 3/year Anomaly (1981÷ 2012 - 1930÷ 1980) 1930 -1980 1981 -2012 km 3/year % North-West 1687 607 654 47, 5 7, 8 Central 650 126 137 10, 5 8, 3 Volga 1037 271 308 37, 0 13, 6 South 421 289 North Caucasus 170 27, 5 342 26, 1 8, 2 Ural 1818 597 605 7, 3 1, 2 Siberian 5145 1321 1368 47, 1 3, 6 Far East 6169 1848 1902 54, 2 2, 9 17098 4259 4463 204 4, 8 Russian Federation
 ПОЧЕМУ?
 Произошедшее на территории России потепление – свершившийся факт !
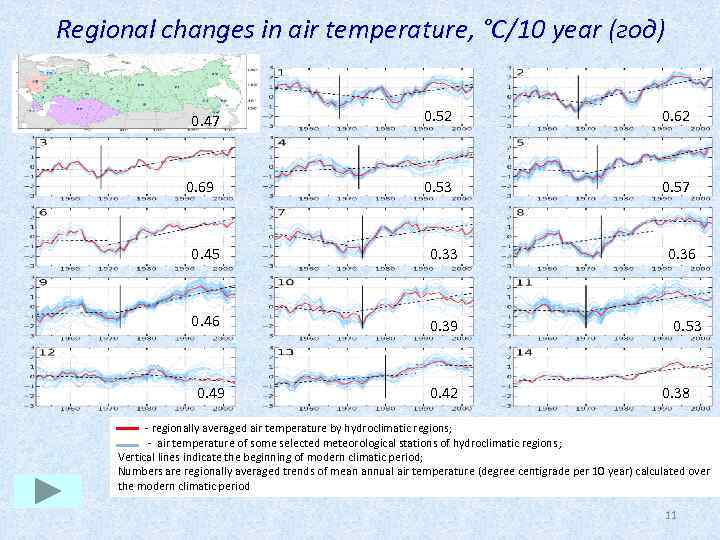 Regional changes in air temperature, °С/10 year (год) 0. 52 0. 62 0. 53 0. 47 0. 57 Текст слайда 0. 69 0. 45 0. 33 0. 46 0. 39 E 0. 49 0. 36 0. 53 C 0. 42 0. 38 - regionally averaged air temperature by hydroclimatic regions; - air temperature of some selected meteorological stations of hydroclimatic regions; Vertical lines indicate the beginning of modern climatic period; Numbers are regionally averaged trends of mean annual air temperature (degree centigrade per 10 year) calculated over the modern climatic period 11
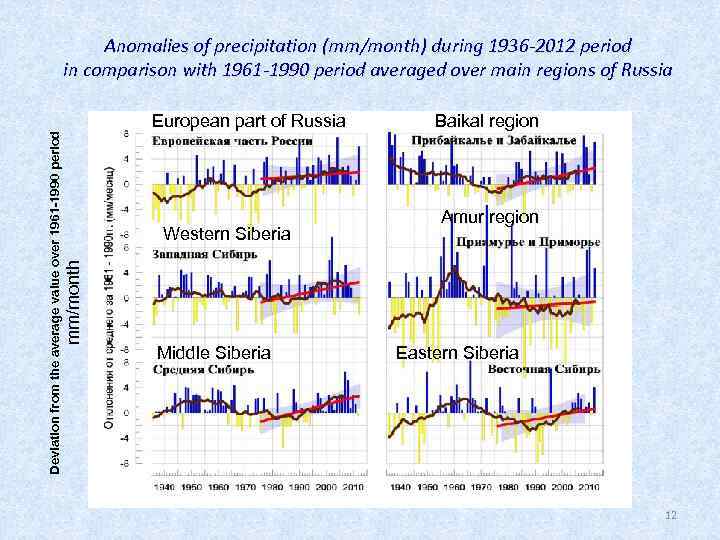 Anomalies of precipitation (mm/month) during 1936 -2012 period in comparison with 1961 -1990 period averaged over main regions of Russia Western Siberia mm/month Deviation from the average value over 1961 -1990 period European part of Russia Middle Siberia Baikal region Amur region Eastern Siberia 12
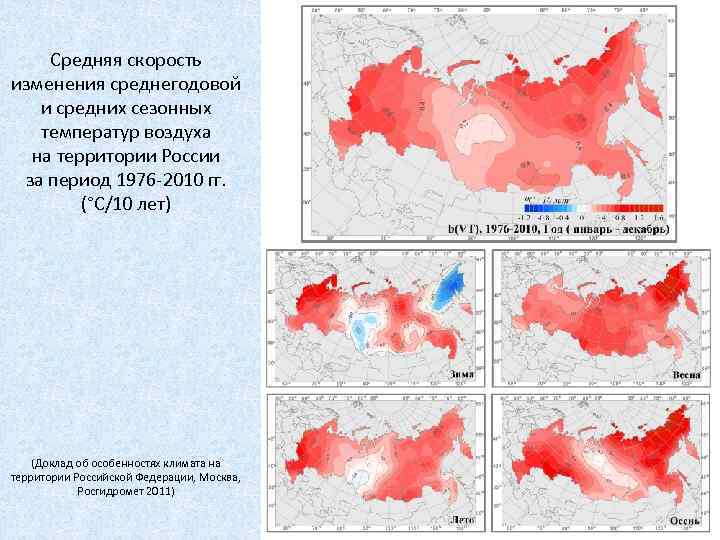 Средняя скорость изменения среднегодовой и средних сезонных температур воздуха на территории России за период 1976 -2010 гг. (°C/10 лет) (Доклад об особенностях климата на территории Российской Федерации, Москва, Росгидромет 2011)
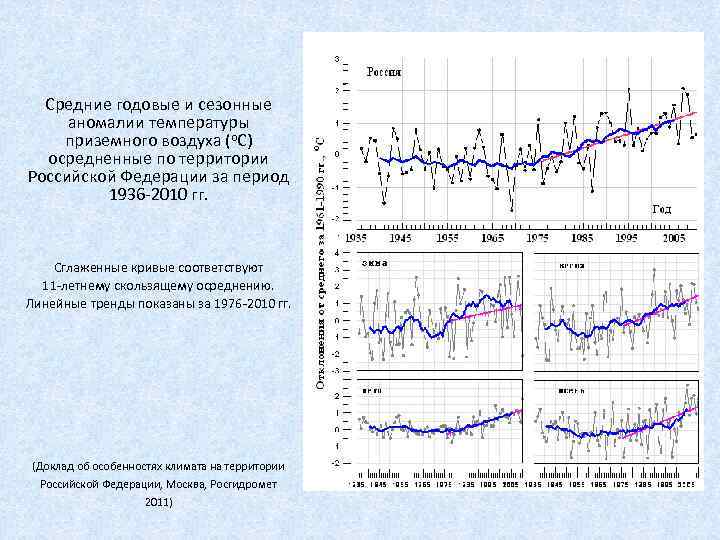 Средние годовые и сезонные аномалии температуры приземного воздуха (о. С) осредненные по территории Российской Федерации за период 1936 -2010 гг. Сглаженные кривые соответствуют 11 -летнему скользящему осреднению. Линейные тренды показаны за 1976 -2010 гг. (Доклад об особенностях климата на территории Российской Федерации, Москва, Росгидромет 2011)
 Какова реакция стока рек на произошедшее потепление?
 Changes in seasonal runoff The results of a comprehensive statistical analysis of seasonal and monthly runoff of rivers with natural water regime led to conclusion that the ongoing climate changes had strongly impact on the regime of winter and summer-autumn river flows.
 Методология оценки современных климатообусловленных изменений водного режима рек Основой диагноза современных изменений речного стока является комплексный статистический анализ многолетних рядов годового, весеннего, летне-осеннего и зимнего стока средних рек. Выбор створов для анализа производится с учетом следующих условий: • наличие данных наблюдений продолжительностью не менее 50 -60 лет; • отсутствие или минимальное количество пропусков в наблюдениях; • минимальное влияние хозяйственной деятельности на годовой и сезонный сток. С учетом этих условий в ГГИ используется постоянно пополняемый архив данных по месячному стоку средних рек России, который служит основой для оценки гидрологических последствий потепления последних десятилетий ХХ – начала XXI веков. В настоящее время архив насчитывает более 400 постов на реках России, в т. ч. 79 постов в бассейне Волги.
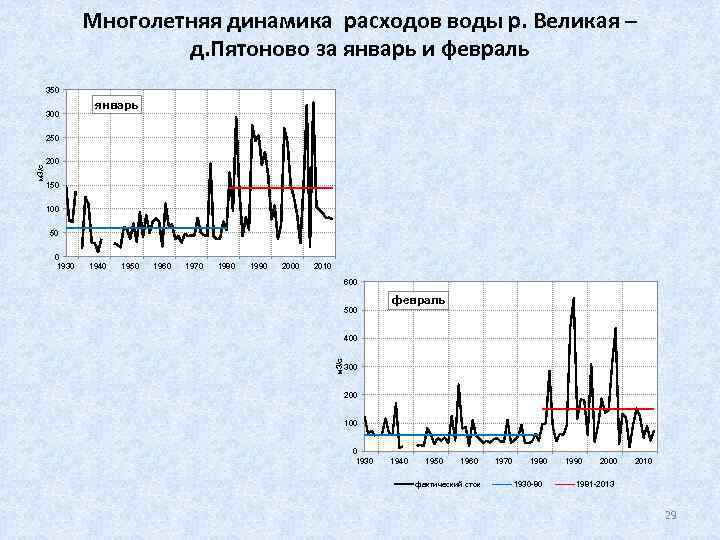
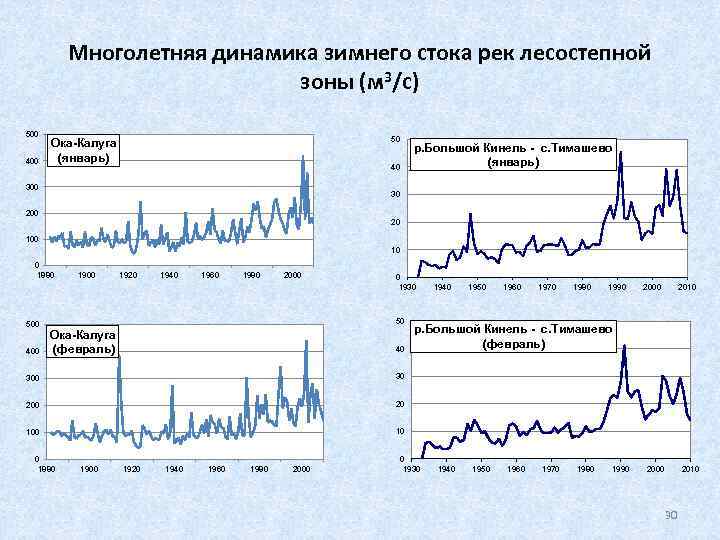
 В результате статистического анализа многолетней динамики водности этих рек установлено: • что с конца 1970 -х – начала 1980 -х гг. на реках РФ произошли значительные изменения во внутригодовом распределении стока, характеризующиеся, прежде всего, существенным увеличением меженного стока, особенно зимнего, практически на всей территории страны. • эти изменения уже оказывают существенное влияние на ряд отраслей экономики страны (энергетика, водный транспорт, промышленно-коммунальное и сельскохозяйственное водопотребление).
 Для количественных оценок произошедших климатообусловленных изменений водного режима были выделены два периода – базовый (1946 -1977 гг. ), в течение которого не отмечалось направленных изменений водности, и современный период с 1978 г. , в течение которого произошло существенное увеличение стока меженных месяцев. Данные расчетов позволили районировать территорию по характеру современных изменений сезонного и годового стока, а также его внутригодового распределения. В результате были выявлены регионы с наиболее значительными изменениями стока, где многолетние ряды отдельных гидрологических характеристик уже нельзя рассматривать с позиций стационарности (бассейн Волги, Дона, Днепра, реки западной части ЕТР).
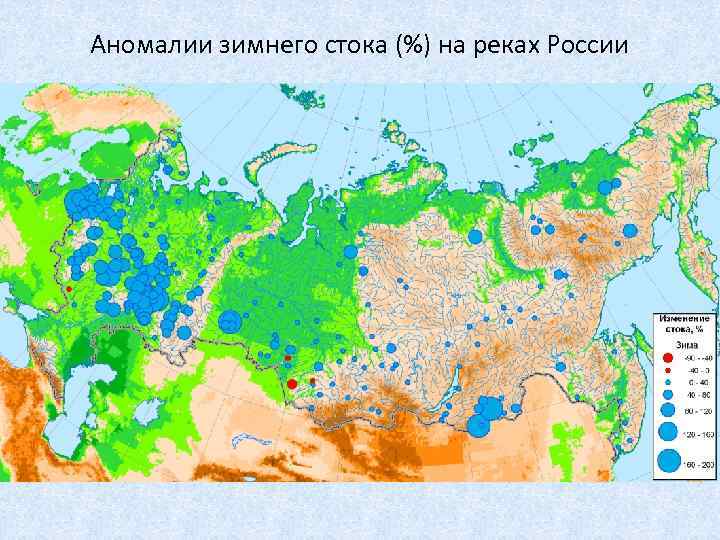 Аномалии зимнего стока (%) на реках России
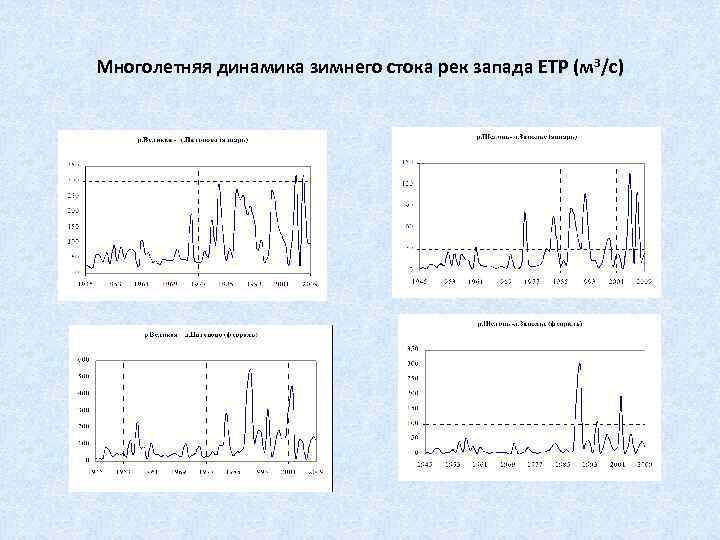 Многолетняя динамика зимнего стока рек запада ЕТР (м 3/с)
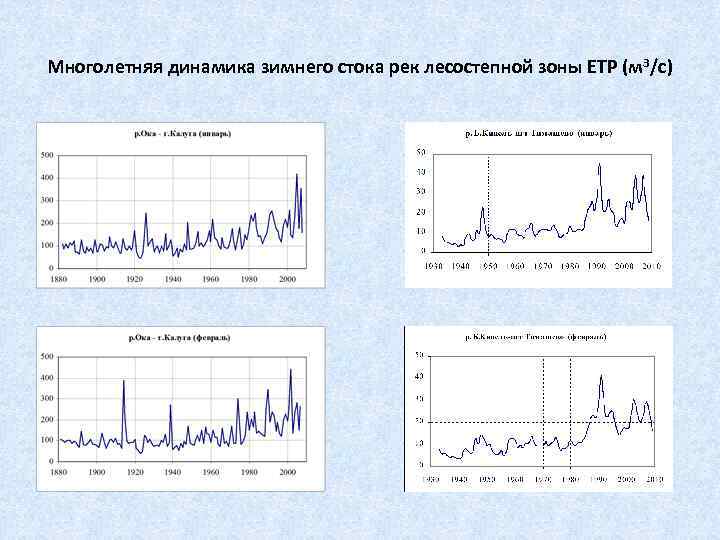 Многолетняя динамика зимнего стока рек лесостепной зоны ЕТР (м 3/с)
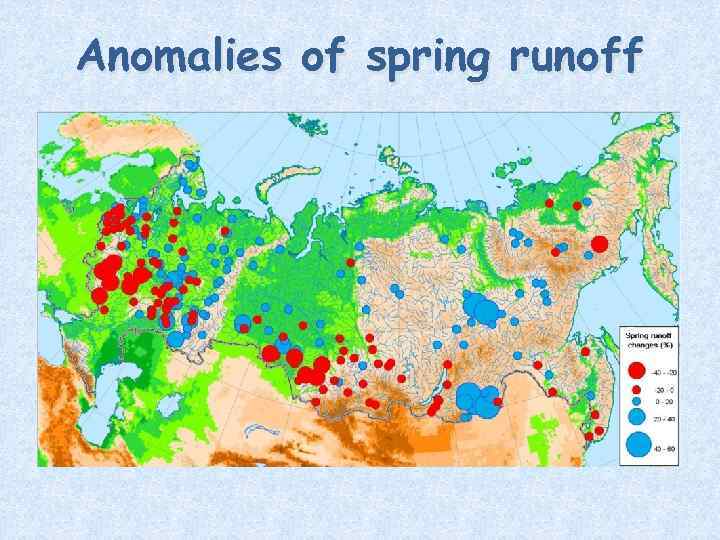 Anomalies of spring runoff
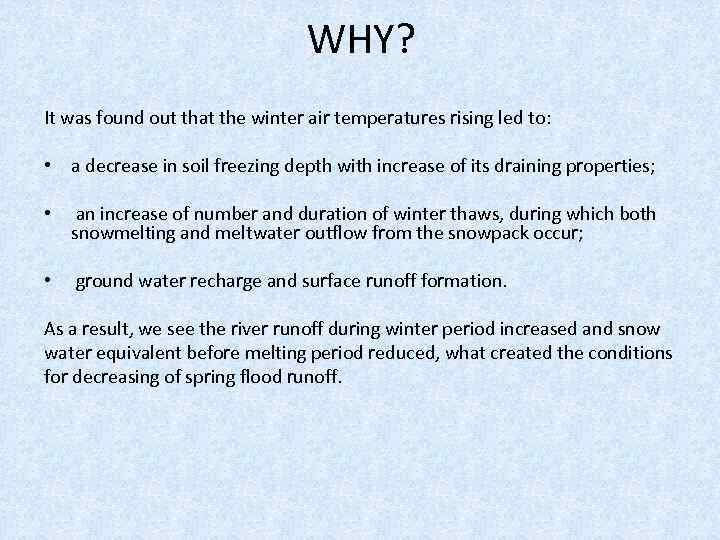 WHY? It was found out that the winter air temperatures rising led to: • a decrease in soil freezing depth with increase of its draining properties; • an increase of number and duration of winter thaws, during which both snowmelting and meltwater outflow from the snowpack occur; • ground water recharge and surface runoff formation. As a result, we see the river runoff during winter period increased and snow water equivalent before melting period reduced, what created the conditions for decreasing of spring flood runoff.
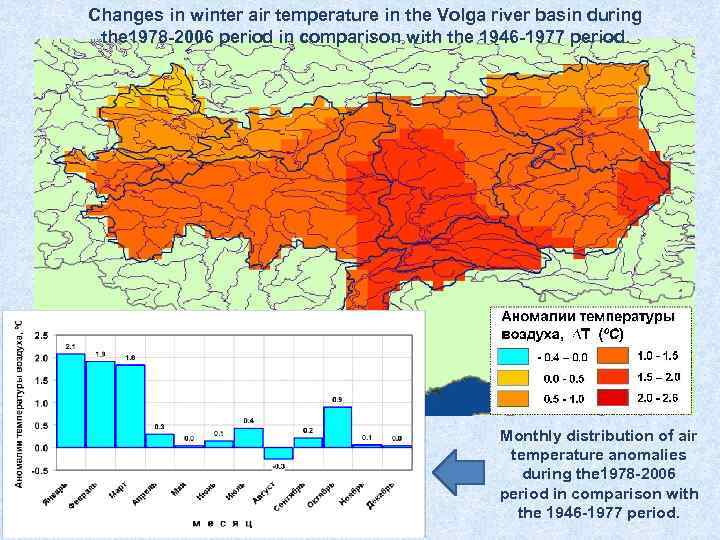 Changes in winter air temperature in the Volga river basin during the 1978 -2006 period in comparison with the 1946 -1977 period. Monthly distribution of air temperature anomalies during the 1978 -2006 period in comparison with the 1946 -1977 period.
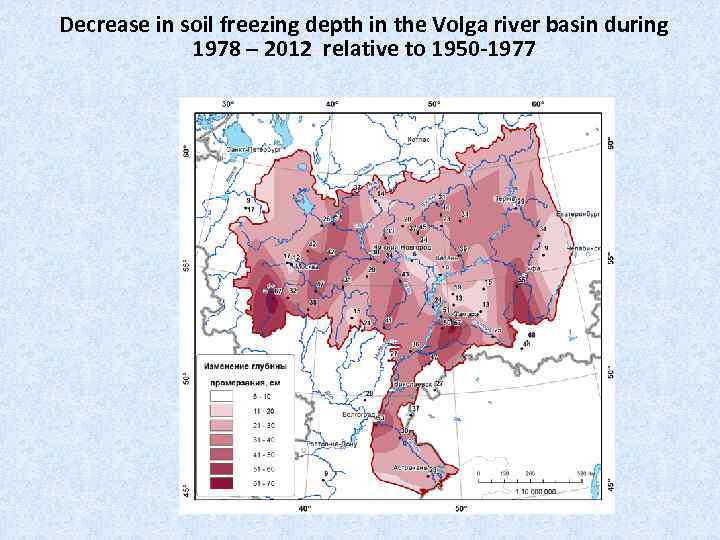 Decrease in soil freezing depth in the Volga river basin during 1978 – 2012 relative to 1950 -1977
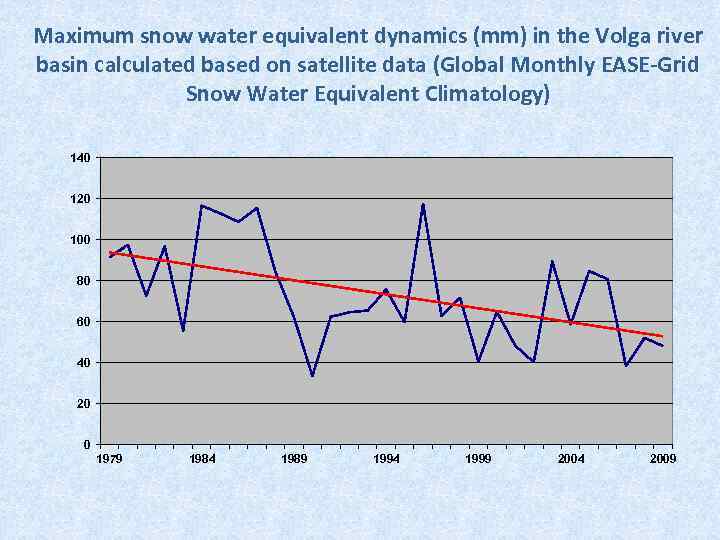 Maximum snow water equivalent dynamics (mm) in the Volga river basin calculated based on satellite data (Global Monthly EASE-Grid Snow Water Equivalent Climatology) 140 120 100 80 60 40 20 0 1979 1984 1989 1994 1999 2004 2009
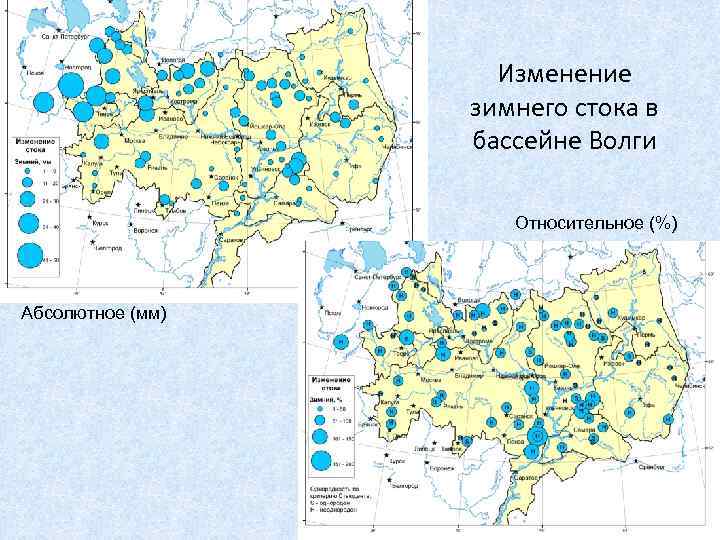 Изменение зимнего стока в бассейне Волги Относительное (%) Абсолютное (мм)
 Многолетняя динамика расходов воды р. Великая – д. Пятоново за январь и февраль 350 300 январь 200 150 100 50 0 1930 1940 1950 1960 1970 1980 1990 2000 2010 600 500 февраль 400 м 3/с 250 300 200 100 0 1930 1940 1950 1960 фактический сток 1970 1980 1930 -80 1990 2000 2010 1981 -2013 29
 Многолетняя динамика зимнего стока рек лесостепной зоны (м 3/с) 500 400 50 Ока-Калуга (январь) 40 300 р. Большой Кинель - с. Тимашево (январь) 30 20 100 10 0 1880 500 400 1920 1940 1960 1980 2000 0 1930 50 Ока-Калуга (февраль) 40 300 1960 1970 1980 1990 2000 2010 р. Большой Кинель - с. Тимашево (февраль) 20 100 1950 30 200 1940 10 0 1880 1900 1920 1940 1960 1980 2000 0 1930 1940 1950 1960 1970 1980 1990 2000 2010 30
 Многолетняя динамика водных ресурсов бассейна Волги За последние 30 лет только восемь лет характеризовались водными ресурсами несколько ниже нормы, зато дважды (1990 и 1994) было превышено максимальное значение годового стока базового периода (1947 г. ). Общее увеличение водных ресурсов Волги за последние три десятилетия относительно нормы составило в среднем 24 км 3/год или 10%.
 Summary • The main feature of the modern water regime changes in the most part of the country is the significant increase in water content during the lowflow periods, especially during the winter months in the past 30 years. • There are positive trends of increasing of winter and summer-autumn low-water runoff for the most rivers considered within the major regions of Russia. • The observed "synchronization" of the low flow runoff changes (especially winter runoff) for the large country areas and the scale of these changes are extraordinary and have no analogues in the XX century. • The analysis of observational data over the last hundred years allow us to make the conclusion that such situation happened for the first time since previously all significant low and high water phases were determined primarily by the magnitude of spring flood runoff.
 Possible future changes There is no reason to expect any significant changes in the water resources of the main Russian rivers as a result of climate warming in the coming decades. Over the most part of the country it will probably be an insignificant increase in annual runoff within its natural variability (within 5%). Regarding to the possible future changes in seasonal river runoff it is expected that the identified tendencies based on the observational data will remain. There will be an increase in winter runoff which will require adaptation efforts including revision of water reservoirs management system.
 Possible future changes However, the most problematic regions from perspective of water availability are the Don basin in the EPR and the upper part of the Ob basin in the APR. There is an opportunity of water resources declining in these basins as a result of climate change which must be taken into account in advance while water supply planning.
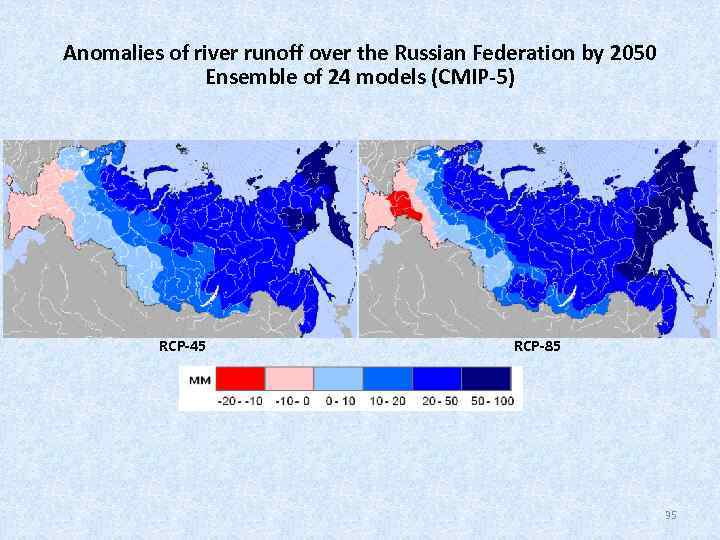 Anomalies of river runoff over the Russian Federation by 2050 Ensemble of 24 models (CMIP-5) RCP-45 RCP-85 35
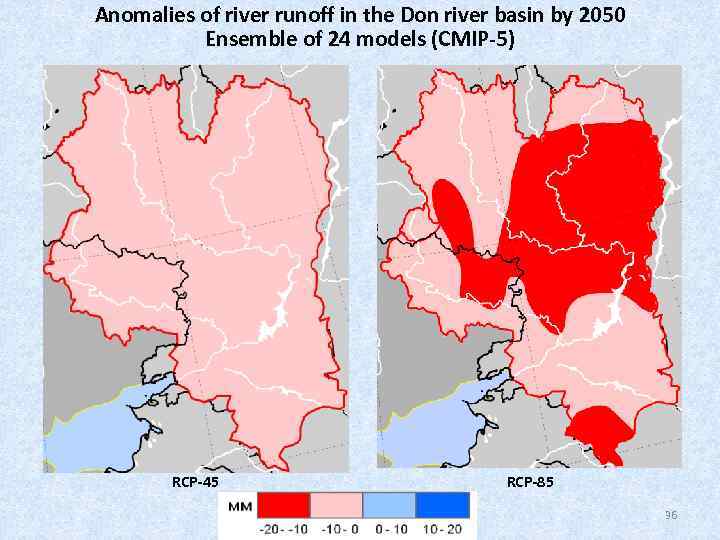 Anomalies of river runoff in the Don river basin by 2050 Ensemble of 24 models (CMIP-5) RCP-45 RCP-85 36
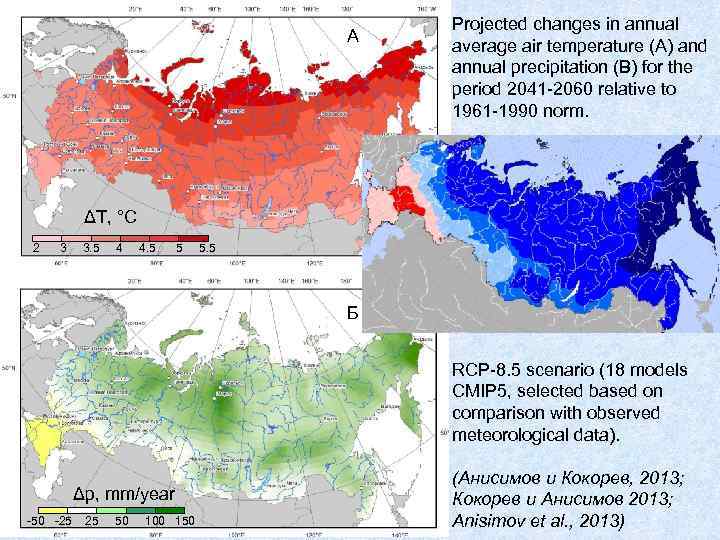 А Projected changes in annual average air temperature (A) and annual precipitation (B) for the period 2041 -2060 relative to 1961 -1990 norm. ΔT, °C 2 3 3. 5 4 4. 5 5 5. 5 Б RCP-8. 5 scenario (18 models CMIP 5, selected based on comparison with observed meteorological data). Δp, mm/year -50 -25 25 50 100 150 (Анисимов и Кокорев, 2013; Кокорев и Анисимов 2013; Anisimov et al. , 2013)
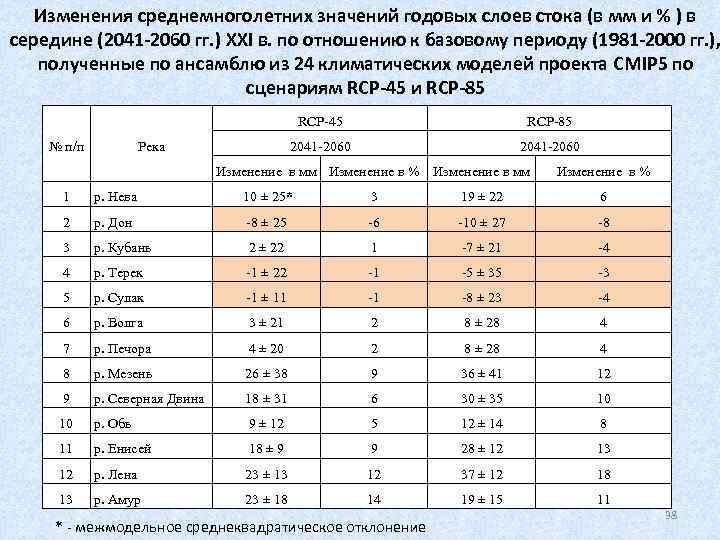 Изменения среднемноголетних значений годовых слоев стока (в мм и % ) в середине (2041 -2060 гг. ) XXI в. по отношению к базовому периоду (1981 -2000 гг. ), полученные по ансамблю из 24 климатических моделей проекта CMIP 5 по сценариям RCP-45 и RCP-85 RCP-45 № п/п 2041 -2060 Река RCP-85 2041 -2060 Изменение в мм Изменение в % 1 р. Нева 10 ± 25* 3 19 ± 22 6 2 р. Дон -8 ± 25 -6 -10 ± 27 -8 3 р. Кубань 2 ± 22 1 -7 ± 21 -4 4 р. Терек -1 ± 22 -1 -5 ± 35 -3 5 р. Сулак -1 ± 11 -1 -8 ± 23 -4 6 р. Волга 3 ± 21 2 8 ± 28 4 7 р. Печора 4 ± 20 2 8 ± 28 4 8 р. Мезень 26 ± 38 9 36 ± 41 12 9 р. Северная Двина 18 ± 31 6 30 ± 35 10 10 р. Обь 9 ± 12 5 12 ± 14 8 11 р. Енисей 18 ± 9 9 28 ± 12 13 12 р. Лена 23 ± 13 12 37 ± 12 18 13 р. Амур 23 ± 18 14 19 ± 15 11 * - межмодельное среднеквадратическое отклонение 38
 Thank you for your attention! Mikhail Georgievsky, Water resources of the Russian rivers and their changes, Proc. IAHS, 374, 75 -77, doi: 10. 5194/piahs 374 -75 -2016, 2016.
 Hydroclimatic regions of Russia 40


