

45b1560e6b72a597867557c8051429f3.ppt
- Количество слайдов: 23
 Visualizing Hurricanes http: //images. nationalgeographic. com A multimedia lesson about hurricanes, storm surge, and scientific visualizations from models
 Scientific Visualization http: //www. designworldonline. com/uploads/Image. Gallery/2 nascar. jpg http: //design. osu. edu/carlson/history/images/small/ibm-dx-MRIhead. gif
 Scientific Visualization • The representation of data in a graphical and interactive way as a method of gaining understanding and insight into the data http: //www. eecs. berkeley. edu/~ddgarcia/optical/lensnet. html
 Hurricane Katrina Visualization http: //www. gfdl. noaa. gov/flashvideo? vid=katrina&title=Hurricane%20 Katrina%20 Model%20 Forecast
 A lesson plan focused on visualizations… • Project for a NSF grant - NG Coastal Hazard Collaboratory • http: //ngchc. org/
 REAL Visualization Tool Rapid Estimates of Approaching Landfall
 http: //tuscweather. net/content/images/hurricane_formation. jpg Hurricane Review http: //library. thinkquest. org/03 oct/00758/en/disaster/hurricane/structure. jpg http: //www. katrina. noaa. gov/images/katrina-08 -28 -2005. jpg
 Storm Surge: The real killer during Hurricanes http: //www. nhc. noaa. gov/surge/images/surgebulge_COMET. jpg Storm Surge Animation http: //www. nhc. noaa. gov/surge/animations/hurricane_stormsurge. swf
 Storm Surge + Wave Setup Storm Surge Elevation above Sea Level Image: C. Riley WAVE SETUP: An increase in water elevation in addition to storm surge caused by the storm’s waves
 Wave Setup vs Wave Height http: //cawcr. gov. au/bmrc/pubs/tcguide/ch 4_figures/fig 4_12. jpg
 Storm Surge + Wave Setup + Tide Wave Setup Storm Surge Elevation above Sea Level Normal High Tide Sea Level Image: C. Riley While tide is not included in storm surge heights, astronomical tides can drastically effect how areas of coastlines are effected during a hurricane. STORM TIDE is the combined height of the storm surge and tide height.
 Storm Surge vs. Inundation Wave Setup Storm Surge Inundation Elevation above Sea Level Normal High Tide Sea Level Image: C. Riley STORM SURGE: the increase in normal water elevation caused by the storm' s winds and pressure INUNDATION: the depth of water over what normally would be dry land, including tides, surge and wave setup
") Inundation Math Total Possible Inundation = (Tide Level + Storm Surge + Wave Setup) – Elevation Wave Setup Storm Surge Inundation Elevation Tide Level Sea Level Image: C. Riley
Inundation Math Total Possible Inundation = (Tide Level + Storm Surge + Wave Setup) – Elevation Wave Setup Storm Surge Inundation Elevation Tide Level Sea Level Image: C. Riley
 Inundation Math: High Tide Total Possible Inundation = (Tide Level + Storm Surge + Wave Setup) – Elevation Wave Setup = 6 ft Storm Surge = 14 ft 10 ft Inundation Elevation = 12 ft High Tide = +2 ft Sea Level Image: C. Riley Total Possible Inundation for the House = (+2 ft + 14 ft + 6 ft) – 12 ft
 Inundation Math: Low Tide Total Possible Inundation = (Tide Level + Storm Surge + Wave Setup) – Elevation Wave Setup = 6 ft Storm Surge = 14 ft Inundation Elevation = 12 ft Low Tide = -2 ft Sea Level Image: C. Riley Total Possible Inundation for the House = (-2 ft + 14 ft + 6 ft) – 12 ft
") Inundation Math Total Possible Inundation = (Tide Level + Storm Surge + Wave Setup) – Elevation Wave Setup = 2 ft 2 ft Storm Surge = 14 ft Elevation = 12 ft Low Tide = -2 ft Sea Level Image: C. Riley Total Possible Inundation for the House = (-2 ft + 14 ft + 2 ft) – 12 ft
Inundation Math Total Possible Inundation = (Tide Level + Storm Surge + Wave Setup) – Elevation Wave Setup = 2 ft 2 ft Storm Surge = 14 ft Elevation = 12 ft Low Tide = -2 ft Sea Level Image: C. Riley Total Possible Inundation for the House = (-2 ft + 14 ft + 2 ft) – 12 ft
 REAL Visualization Tool Rapid Estimates of Approaching Landfall
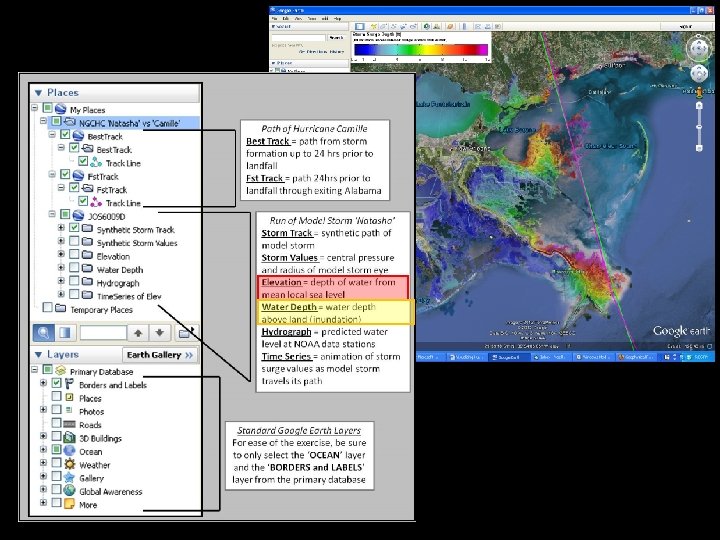
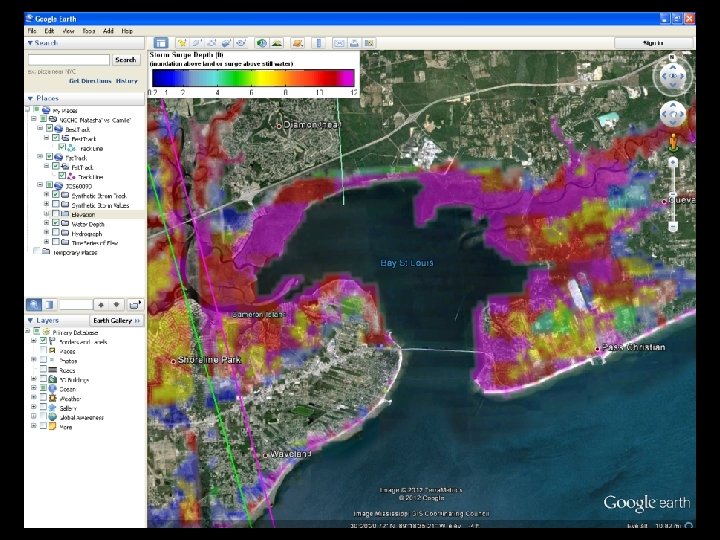
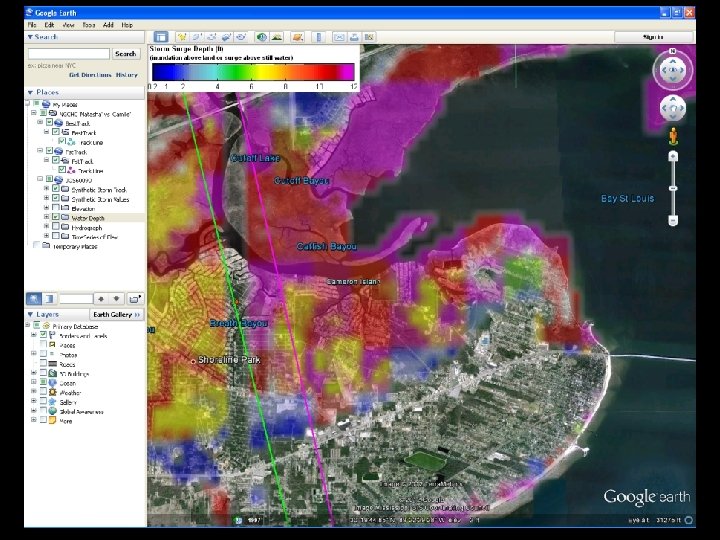
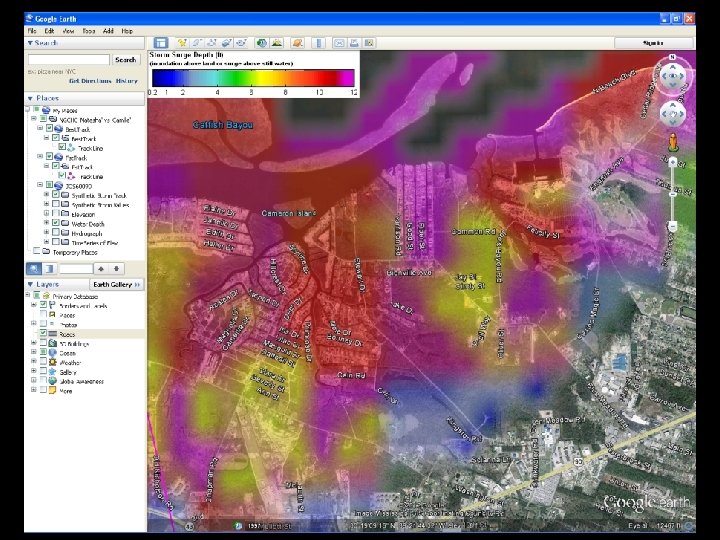
 Google Earth is our FRIEND! Compass Click to shift your view of the map (or click and drag) Storm Surge Depth Key Click for street view Zoom Bar (or you can double click a location) Layers: (Different things the map can show you) To turn on/off a layer, click on the box to the left of its name.
 Visualizing Hurricanes: The Lesson Plan stormsurge. disl. org