898ce5857ed60b5bc297876fa39eeb81.ppt
- Количество слайдов: 46
 Virtualizing Our Environment: SQL Server on VMware? Lessons Learned Rob Mandeville Senior DBA, Confio Software Rob Mandeville 1 1
 Who Am I? » Senior DBA for Confio Software § Robert. Mandeville@confio. com § Current – 15+ Years in SQL Server, Postgres, My. SQL, & Oracle § DBA and Developer » Review Database Performance for Customers and Prospects » Confio Software § Makers of Ignite 8 Response Time Analysis Tools § Ignite. VM for Oracle/SQL/Sybase/DB 2 on VMware 2 2
 Agenda » Virtualization at Confio » Terms and Concepts » Best Practices for Monitoring: § § Memory CPU Storage Network » Summary 3 3
 Why Virtualize? » Too much physical horsepower § § Most are drastically underutilized Many are running at <10% CPU Confio Before Virtualization - Pictures Confio After Virtualization - Pictures 4 4
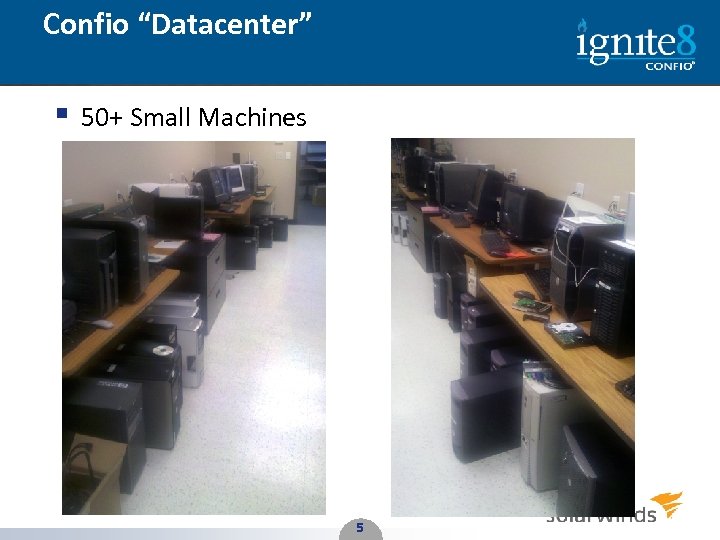 Confio “Datacenter” § 50+ Small Machines 5 5
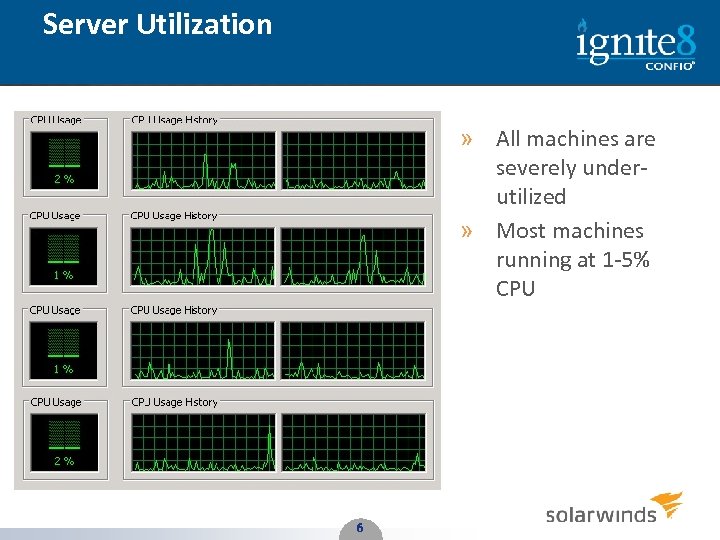 Server Utilization » All machines are severely underutilized » Most machines running at 1 -5% CPU 6 6
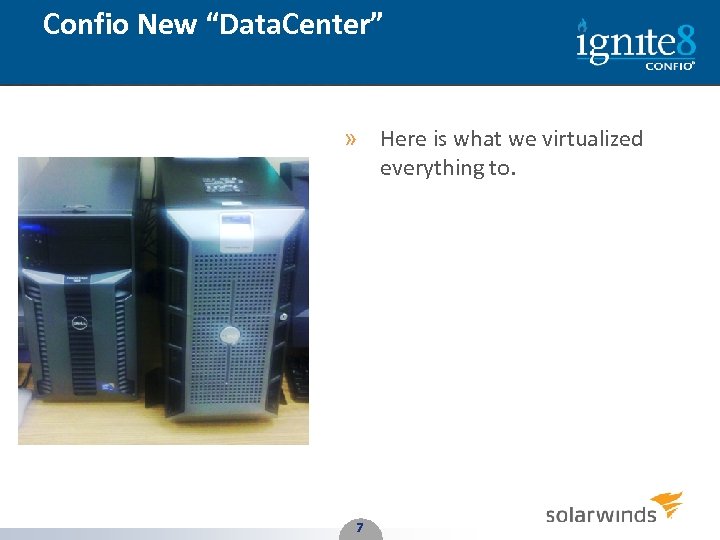 Confio New “Data. Center” » Here is what we virtualized everything to. 7 7
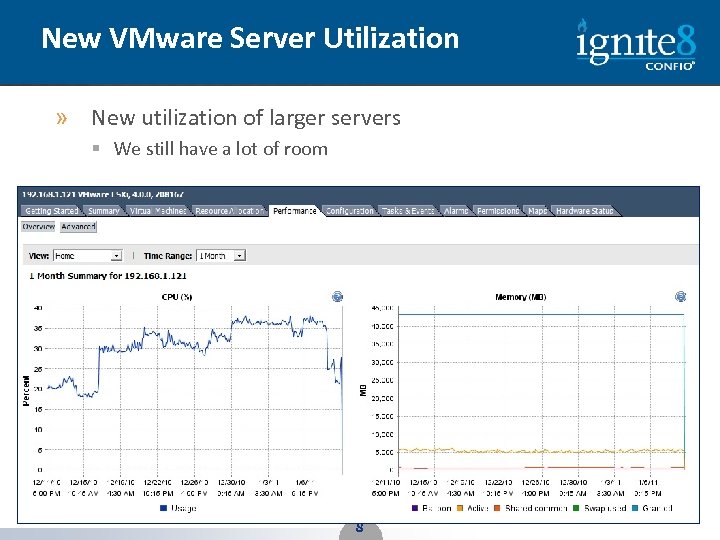 New VMware Server Utilization » New utilization of larger servers § We still have a lot of room 8 8
 Why Virtualize? » Easier to manage fewer physical boxes § Manage physical resources on 2, 4 or 8 physical machines vs. 50100 small boxes § v. Motion enables automatic resource balancing » Cheaper § More bang for the buck with bigger machines § Increased power efficiency § Less floor space 9 9
 Databases on VMware » VMs are typically supported by Database Vendors § If you have problems, vendor may ask you to reproduce on physical hardware § No bugs in any vendor support site related to VMware » VMware benchmark on I/O intensive instances § http: //www. vmware. com/files/pdf/benchmarking_micrsoft_sql_vmw are_esx_server_wp. pdf § Spoiler Alert! The benchmark test as run by Brocade concludes that you can run SQL Server OLTP type instances on VMs and even get consolidation from it » Deploying databases on VMware is very similar to using physical servers § Monitoring the whole stack will take some change 10 10
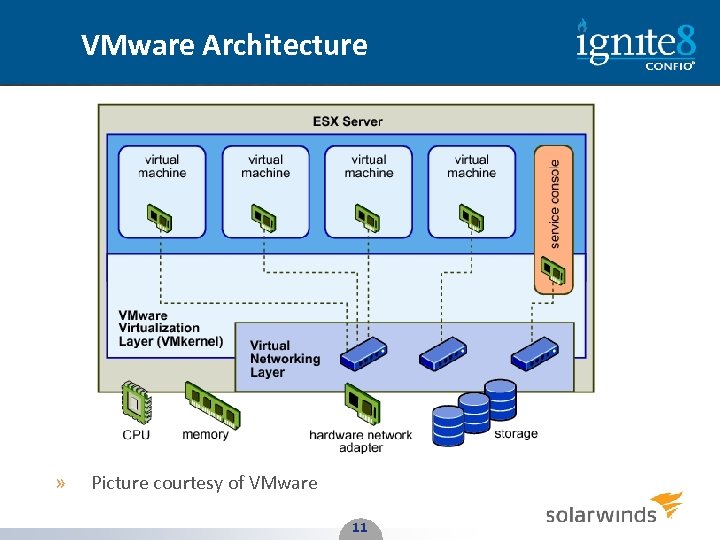 VMware Architecture » Picture courtesy of VMware 11 11
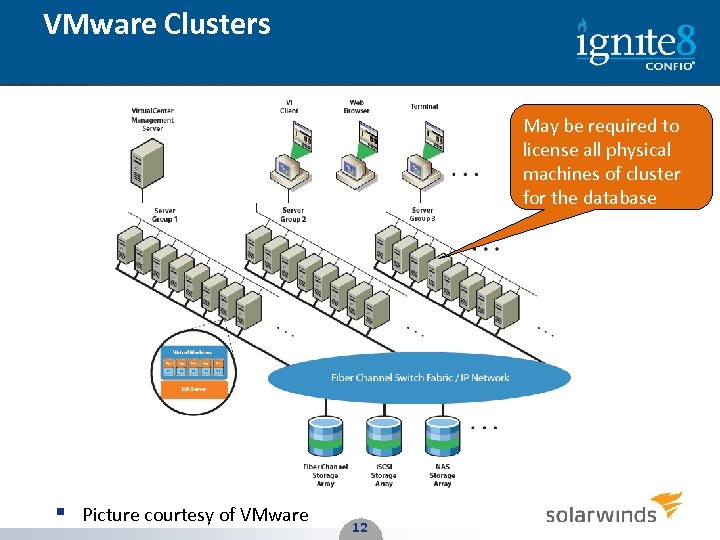 VMware Clusters May be required to license all physical machines of cluster for the database § Picture courtesy of VMware 12 12
 Terms and Concepts » ESX and ESXi – the hypervisor and foundation for VMware products » Physical Host – underlying hardware where ESX is installed » Virtual Machine (VM) – container inside host that looks like a physical machine » v. Center Server – centralized management » v. Sphere Client – Admin and Monitoring 13 13
 Concepts - Cluster » Cluster – several physical hosts linked together » v. Motion – live migration of VM from one host to another – no loss of connectivity » Distributed Resource Scheduler (DRS) – can automatically make sure hosts in a cluster have a balanced workload – uses v. Motion » High Availability (HA) – automated restart of VMs after host failure – several minutes of downtime » Fault Tolerance (FT) – a mirrored copy of a VM on another host – takes over with no downtime » Consolidated Backup – (VCB) – integrates with several 3 rd party tools to backup a snapshot of the VM 14 14
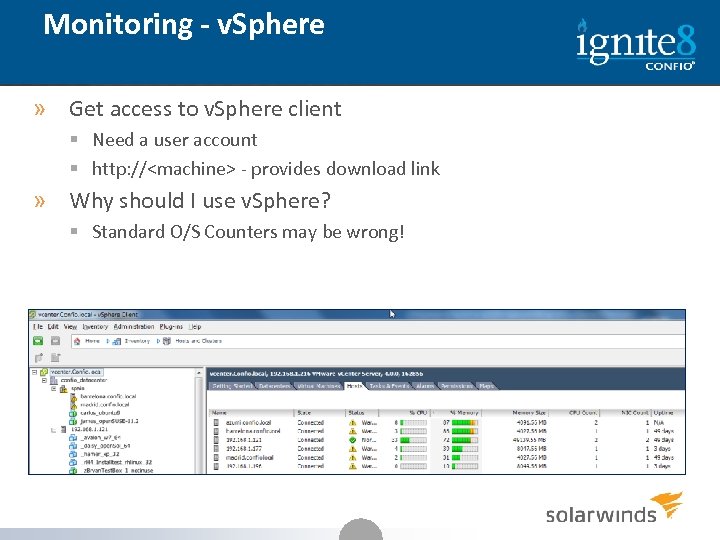 Monitoring - v. Sphere » Get access to v. Sphere client § Need a user account § http: //
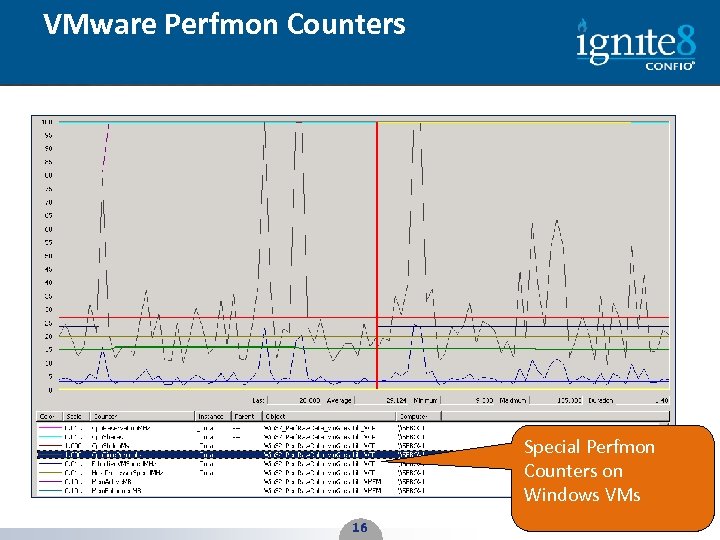 VMware Perfmon Counters Special Perfmon Counters on Windows VMs 16 16
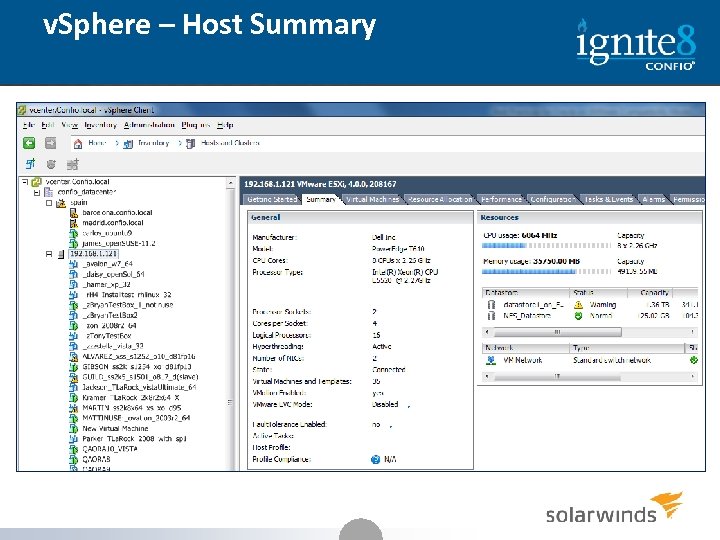 v. Sphere – Host Summary 17
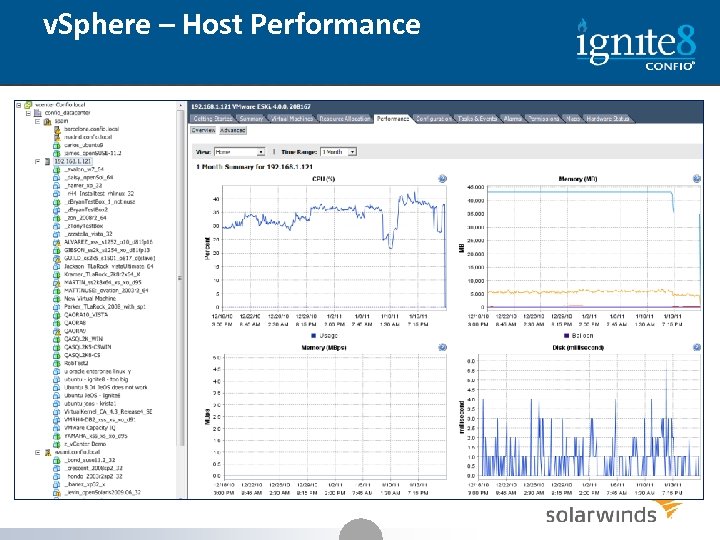 v. Sphere – Host Performance 18
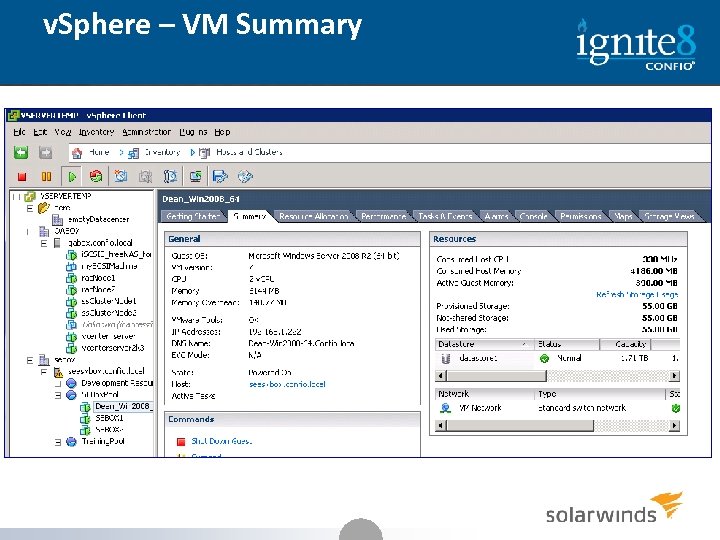 v. Sphere – VM Summary 19
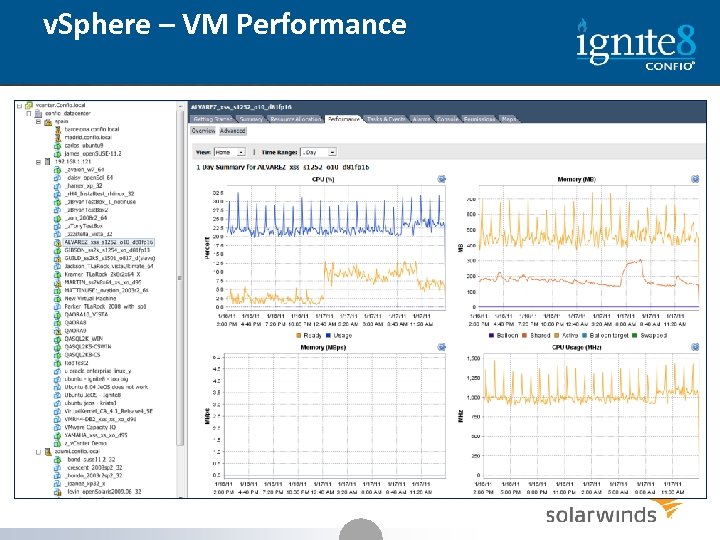 v. Sphere – VM Performance 20
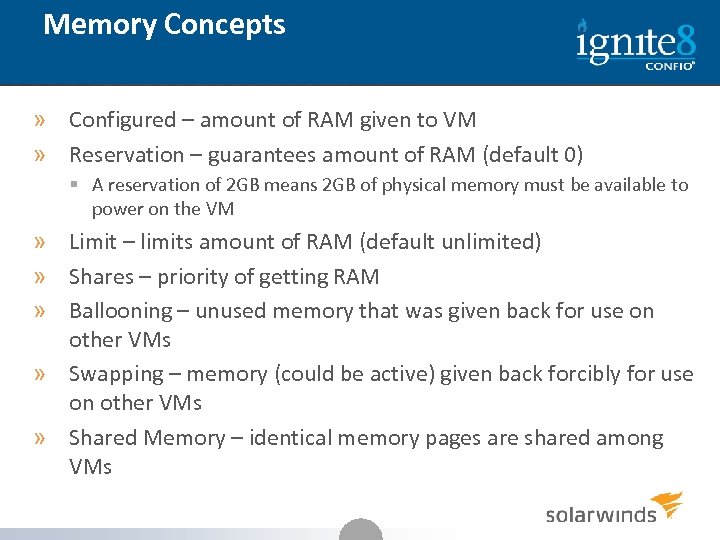 Memory Concepts » Configured – amount of RAM given to VM » Reservation – guarantees amount of RAM (default 0) § A reservation of 2 GB means 2 GB of physical memory must be available to power on the VM » Limit – limits amount of RAM (default unlimited) » Shares – priority of getting RAM » Ballooning – unused memory that was given back for use on other VMs » Swapping – memory (could be active) given back forcibly for use on other VMs » Shared Memory – identical memory pages are shared among VMs 21
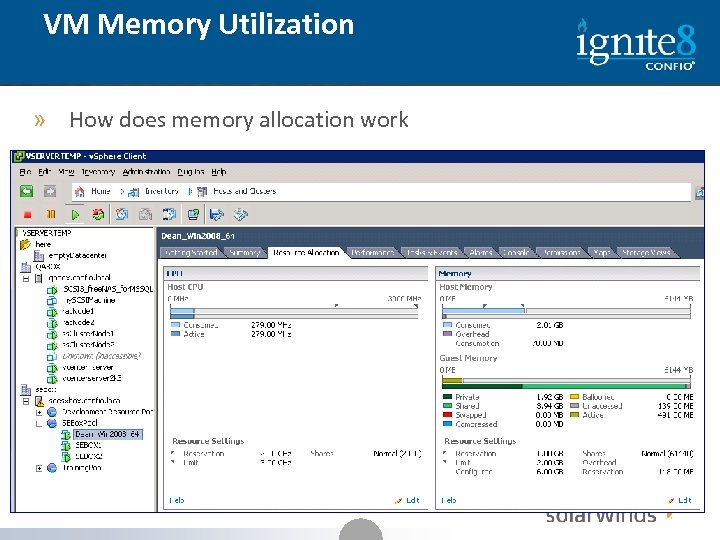 VM Memory Utilization » How does memory allocation work 22
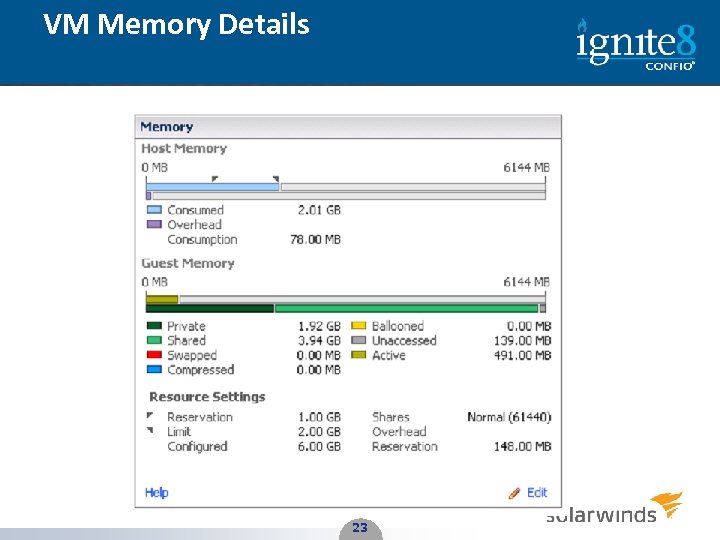 VM Memory Details 23 23
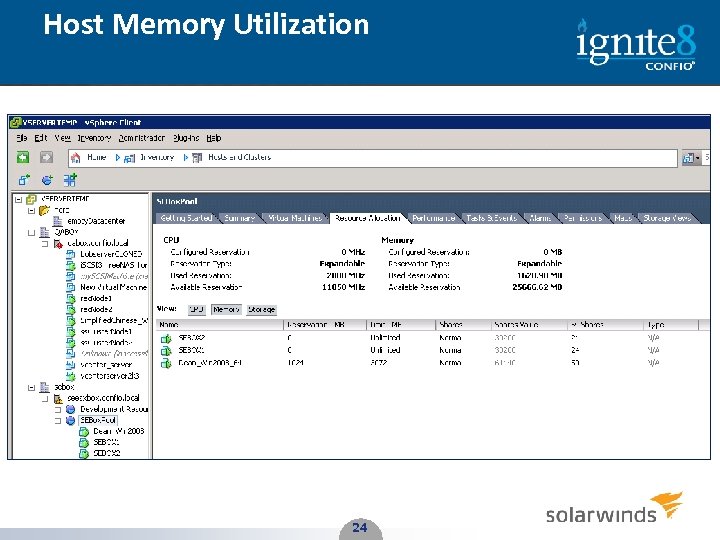 Host Memory Utilization 24 24
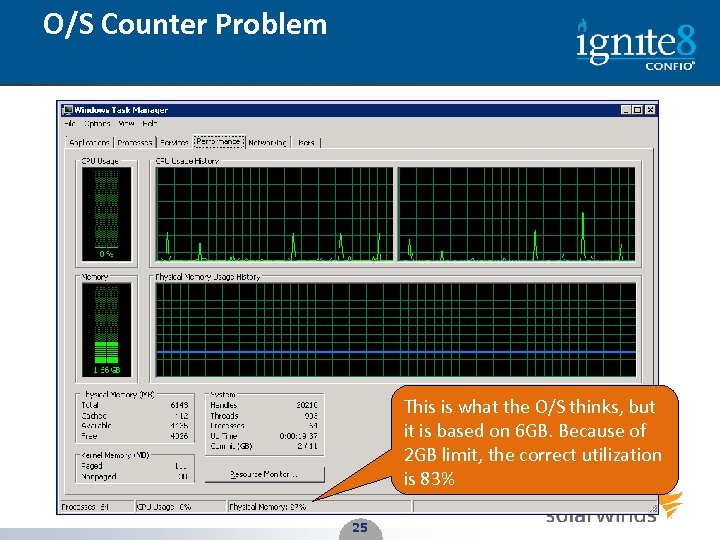 O/S Counter Problem This is what the O/S thinks, but it is based on 6 GB. Because of 2 GB limit, the correct utilization is 83% 25 25
 Database Tips with Memory » Set Memory Reservation >= Database Memory § If limits are used, do not exceed this amount for DB § Leave room for O/S and other things » Be careful about overcommitting in production § Can be less careful in dev/test/stage where performance is less critical » Set CPU/MMU Virtualization to Automatic § Use hardware assisted memory management if you can » Large Pages are Supported in VMware 26
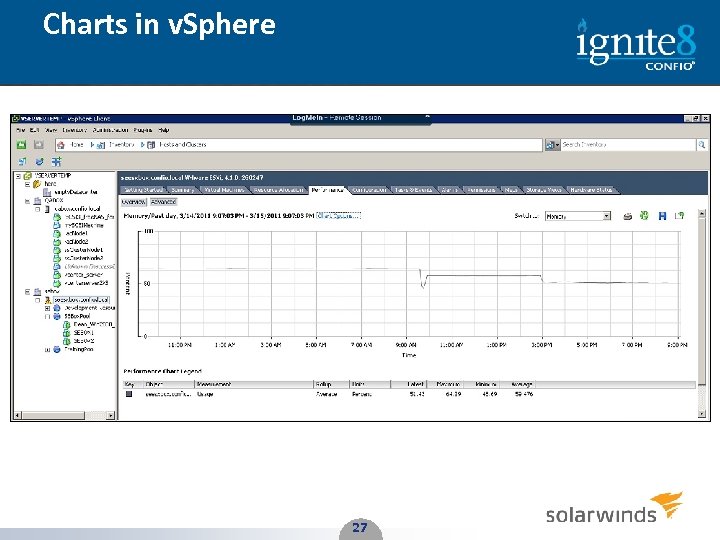 Charts in v. Sphere 27 27
 Monitoring - Memory » Primary Metric – Swapping, Ballooning » Secondary Metrics – VM & Host Memory Utilization, VM Memory Reservation, VM Memory Limit » Rules § If Any Swapping is occurring • Host needs more memory because it cannot satisfy current demands • Lessen demands for memory – lower reservations where possible § Excessive Ballooning • May be ok for now, but could become an issue as demands for memory increase § VM Memory Utilization High • May not be a problem now unless Guest O/S swapping is occurring • If VM is limited, may want to increase memory this VM can get § If Host Memory Utilization High • May not be a problem now if no swapping or ballooning • Could be a problem soon for all VMs on this host 28
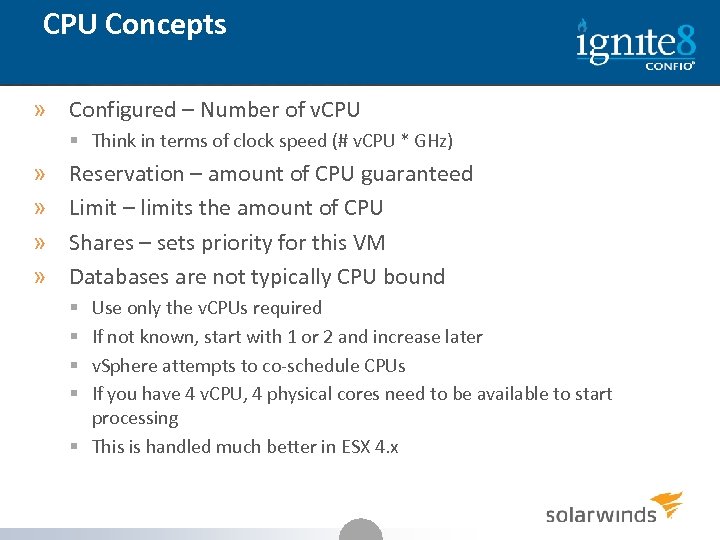 CPU Concepts » Configured – Number of v. CPU § Think in terms of clock speed (# v. CPU * GHz) » » Reservation – amount of CPU guaranteed Limit – limits the amount of CPU Shares – sets priority for this VM Databases are not typically CPU bound Use only the v. CPUs required If not known, start with 1 or 2 and increase later v. Sphere attempts to co-schedule CPUs If you have 4 v. CPU, 4 physical cores need to be available to start processing § This is handled much better in ESX 4. x § § 29
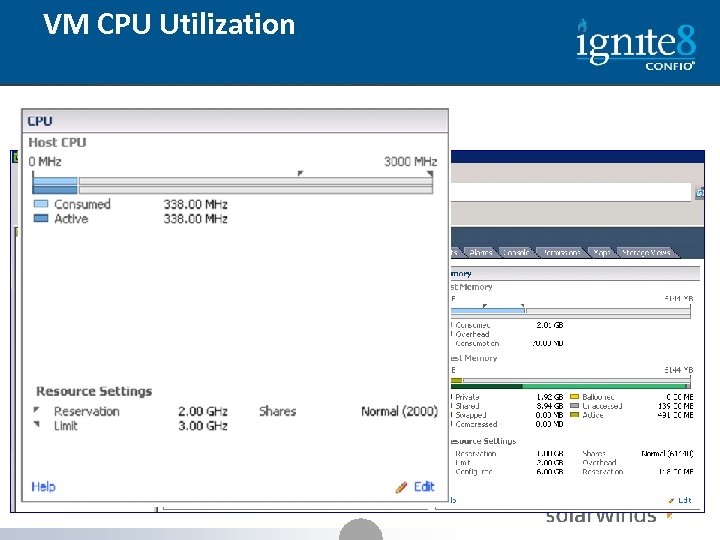 VM CPU Utilization » How does CPU allocation work 30
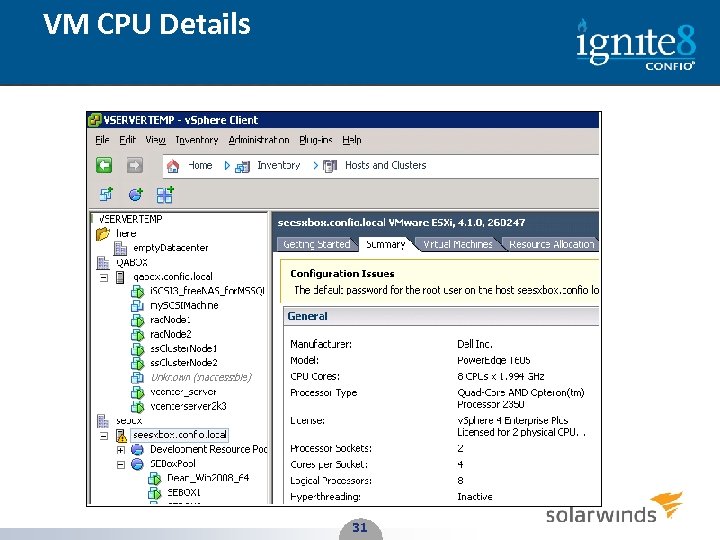 VM CPU Details 31 31
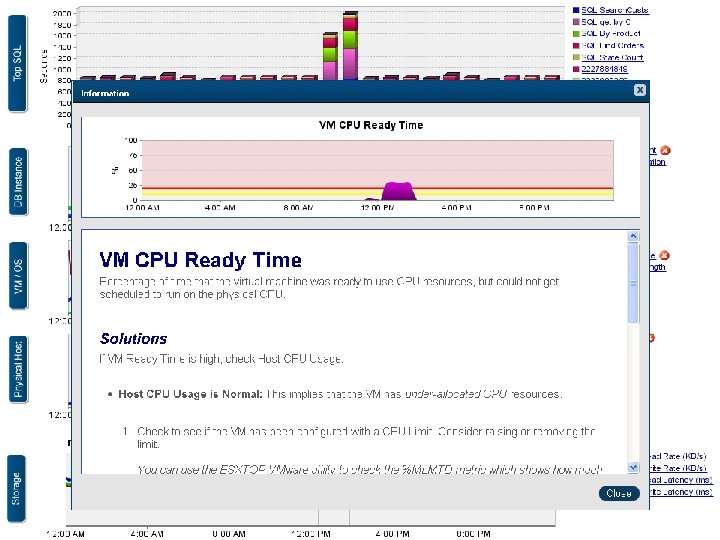
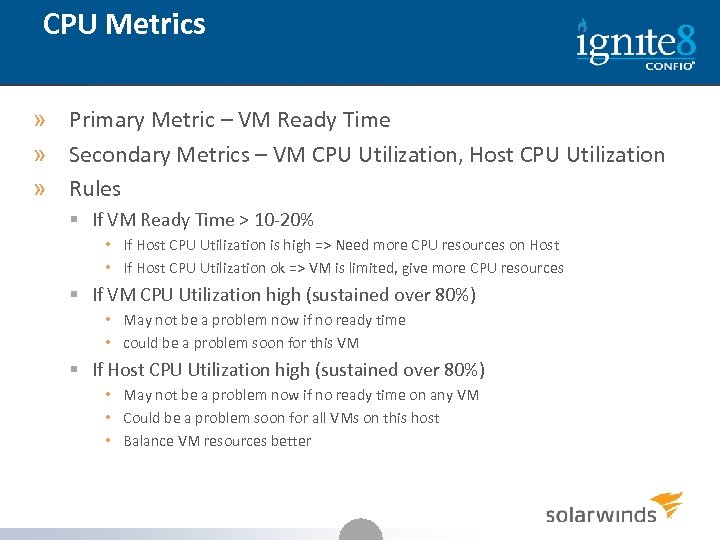 CPU Metrics » Primary Metric – VM Ready Time » Secondary Metrics – VM CPU Utilization, Host CPU Utilization » Rules § If VM Ready Time > 10 -20% • If Host CPU Utilization is high => Need more CPU resources on Host • If Host CPU Utilization ok => VM is limited, give more CPU resources § If VM CPU Utilization high (sustained over 80%) • May not be a problem now if no ready time • could be a problem soon for this VM § If Host CPU Utilization high (sustained over 80%) • May not be a problem now if no ready time on any VM • Could be a problem soon for all VMs on this host • Balance VM resources better 32
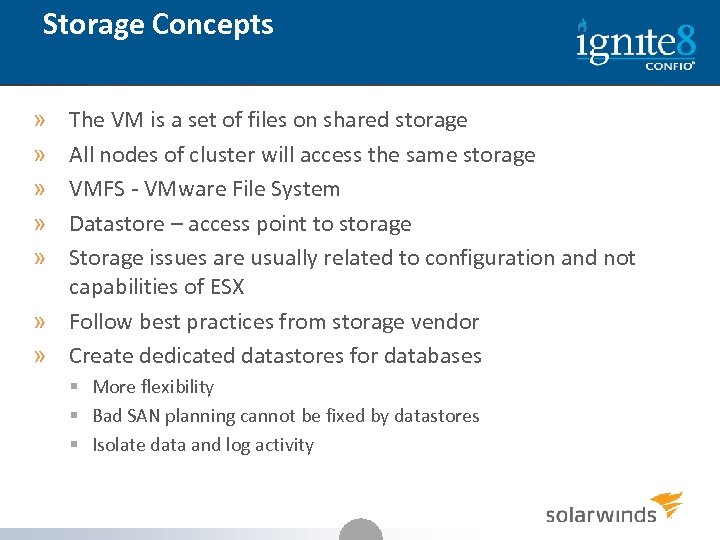 Storage Concepts The VM is a set of files on shared storage All nodes of cluster will access the same storage VMFS - VMware File System Datastore – access point to storage Storage issues are usually related to configuration and not capabilities of ESX » Follow best practices from storage vendor » Create dedicated datastores for databases » » » § More flexibility § Bad SAN planning cannot be fixed by datastores § Isolate data and log activity 33
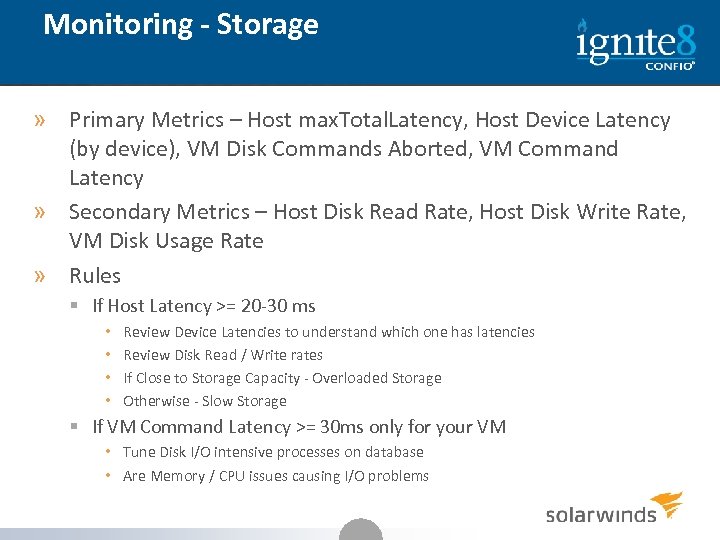 Monitoring - Storage » Primary Metrics – Host max. Total. Latency, Host Device Latency (by device), VM Disk Commands Aborted, VM Command Latency » Secondary Metrics – Host Disk Read Rate, Host Disk Write Rate, VM Disk Usage Rate » Rules § If Host Latency >= 20 -30 ms • • Review Device Latencies to understand which one has latencies Review Disk Read / Write rates If Close to Storage Capacity - Overloaded Storage Otherwise - Slow Storage § If VM Command Latency >= 30 ms only for your VM • Tune Disk I/O intensive processes on database • Are Memory / CPU issues causing I/O problems 34
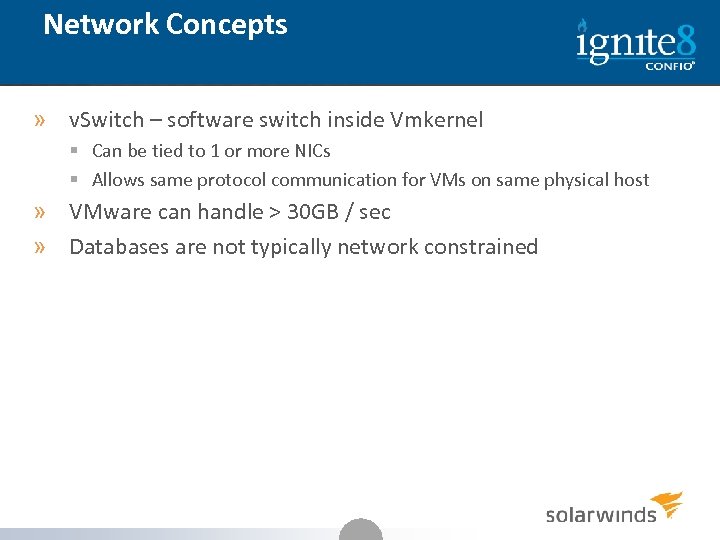 Network Concepts » v. Switch – software switch inside Vmkernel § Can be tied to 1 or more NICs § Allows same protocol communication for VMs on same physical host » VMware can handle > 30 GB / sec » Databases are not typically network constrained 35
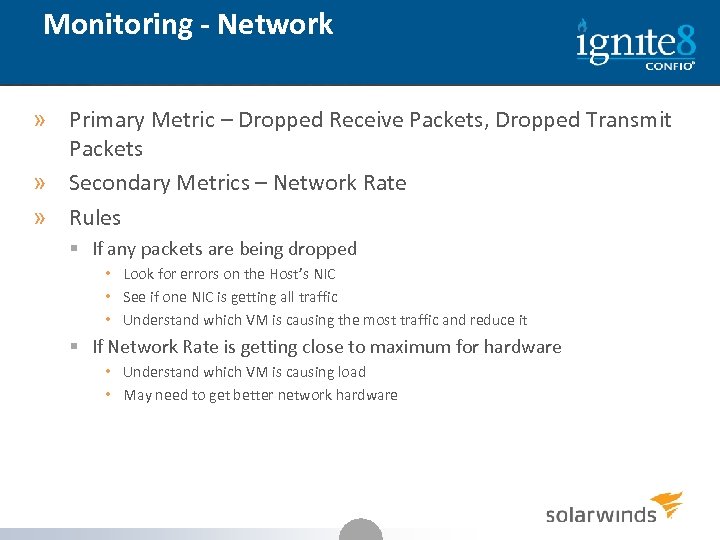 Monitoring - Network » Primary Metric – Dropped Receive Packets, Dropped Transmit Packets » Secondary Metrics – Network Rate » Rules § If any packets are being dropped • Look for errors on the Host’s NIC • See if one NIC is getting all traffic • Understand which VM is causing the most traffic and reduce it § If Network Rate is getting close to maximum for hardware • Understand which VM is causing load • May need to get better network hardware 36
 v. Sphere Shortcomings » Too much information § 100 s of counters – no indication of importance » Not enough detailed data § Keeps details only for a day by default – rolls to hourly § Expand this and GUI performance becomes issue » GUI performance § v. Sphere is slow and frustrating at times » Graphs are isolated § Can only see one type of chart at a time § Hard to mix Memory, CPU, Storage, etc 37
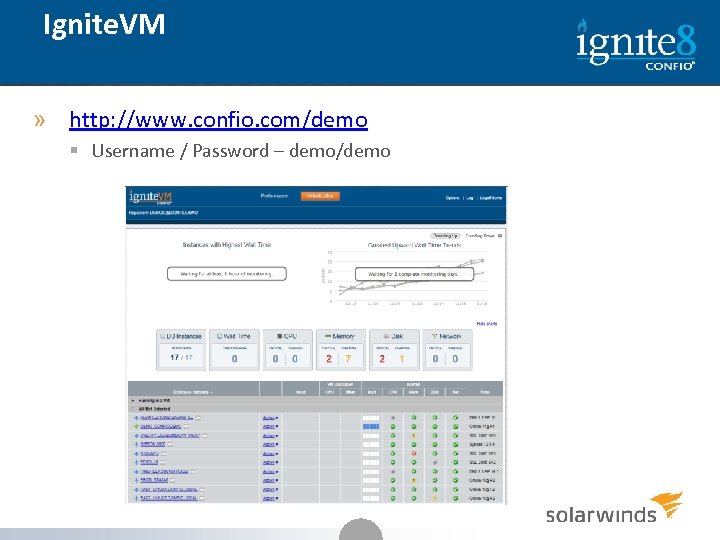 Ignite. VM » http: //www. confio. com/demo § Username / Password – demo/demo 38
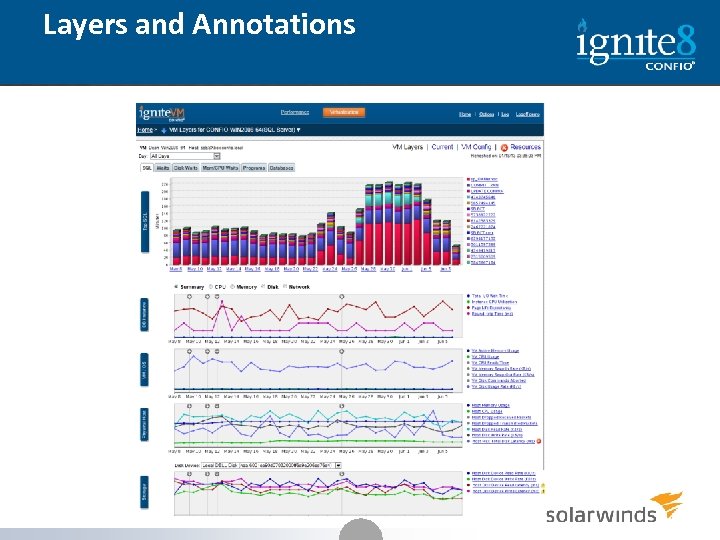 Layers and Annotations 39
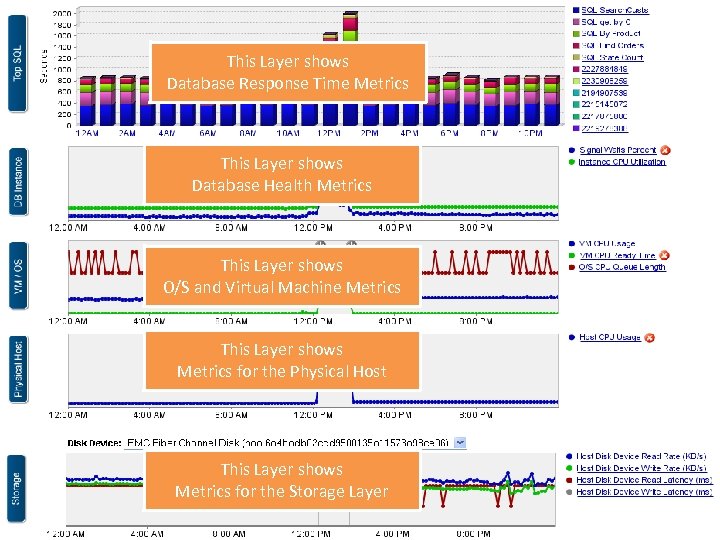 This Layer shows Database Response Time Metrics This Layer shows Database Health Metrics This Layer shows O/S and Virtual Machine Metrics This Layer shows Metrics for the Physical Host This Layer shows Metrics for the Storage Layer 40 40
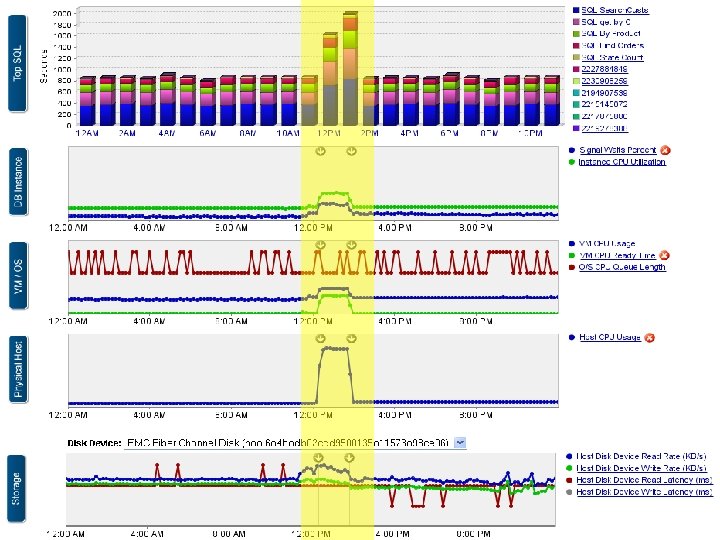 41 41
41 41
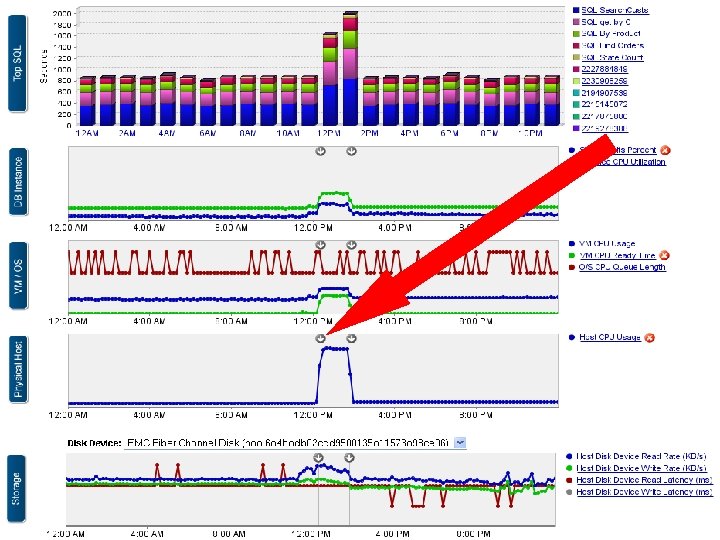 42 42
42 42
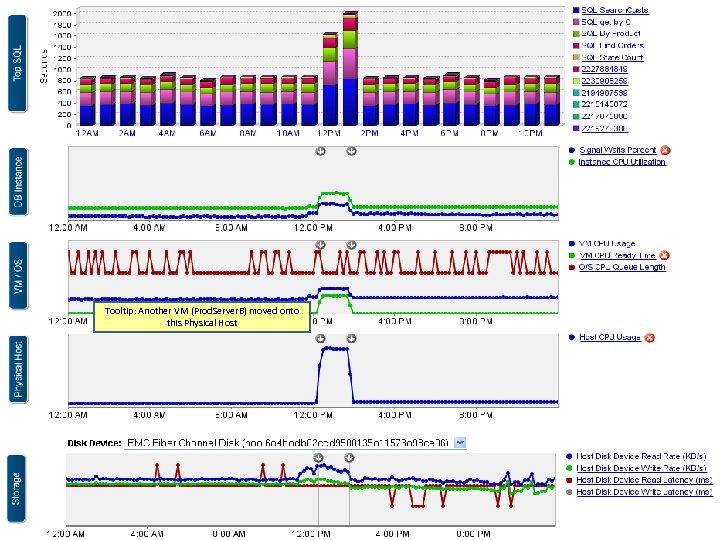 Tooltip: Another VM (Prod. Server. B) moved onto this Physical Host 43 43
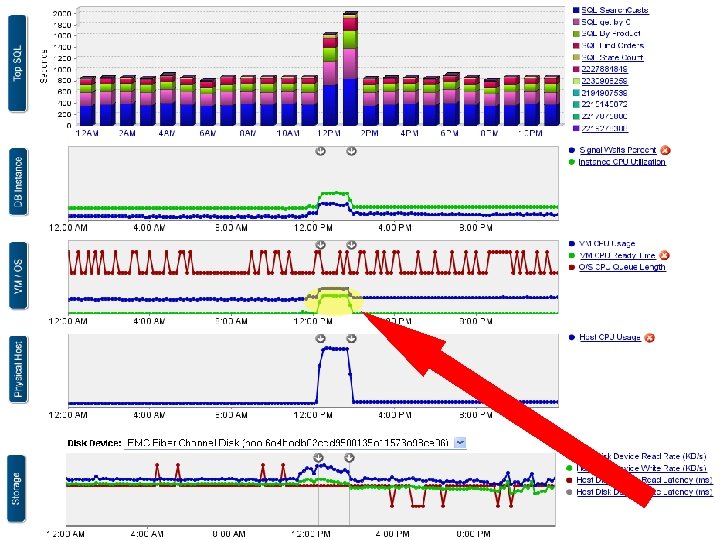 44 44
44 44
 45 45
45 45
 Confio Software » Award Winning Performance Tools » Ignite and Ignite. VM for SQL Server, Oracle, DB 2, Sybase » Ignite can answer: § § § What changed recently that affected end users What are my most impactful SQL statements Gets to the root cause – don’t solve for symptoms What layer (VM or DB) is causing the problem Who and How should we fix the problem Download free trial at www. confio. com 46 46


