09 - Онтогенез клетки.ppt
- Количество слайдов: 51
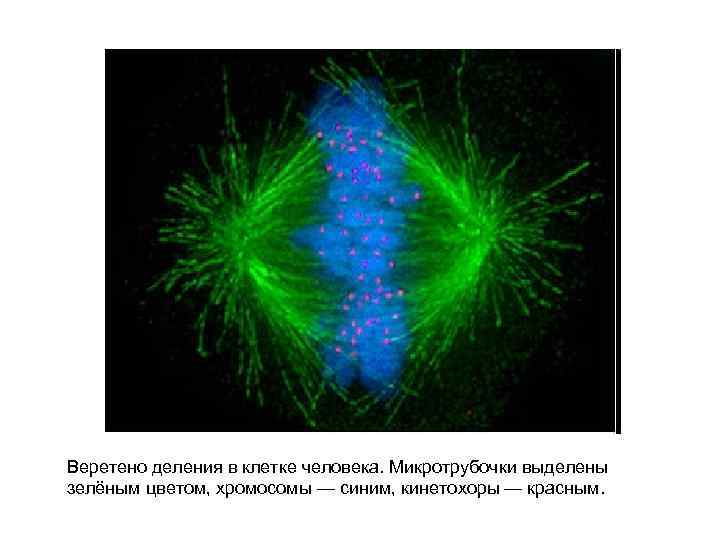
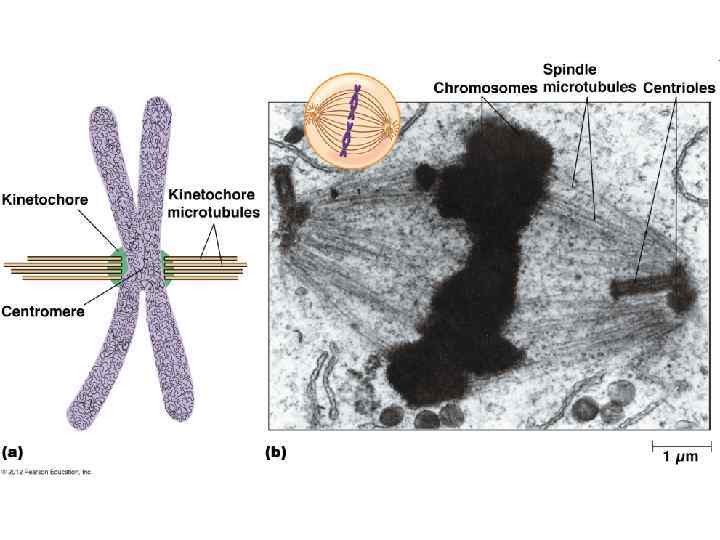
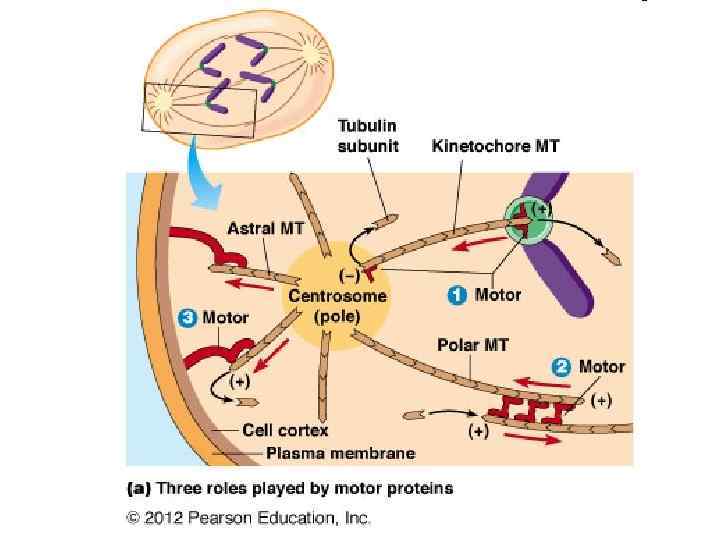
Веретено деления в клетке человека. Микротрубочки выделены зелёным цветом, хромосомы — синим, кинетохоры — красным.
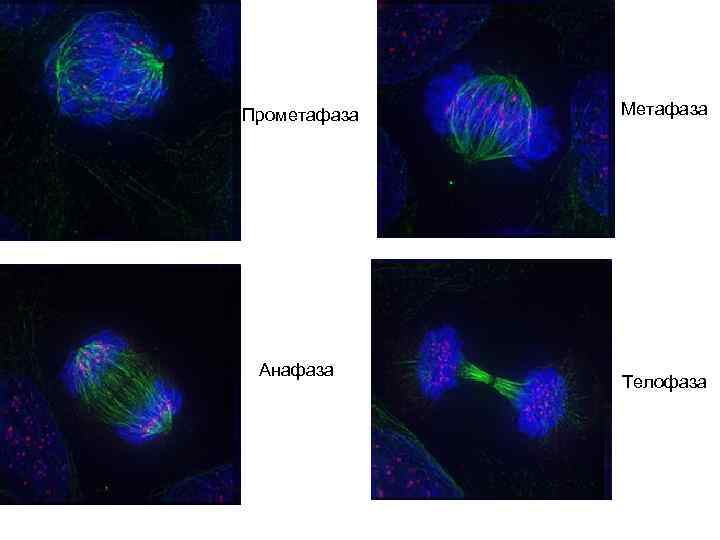
Прометафаза Анафаза Метафаза Телофаза
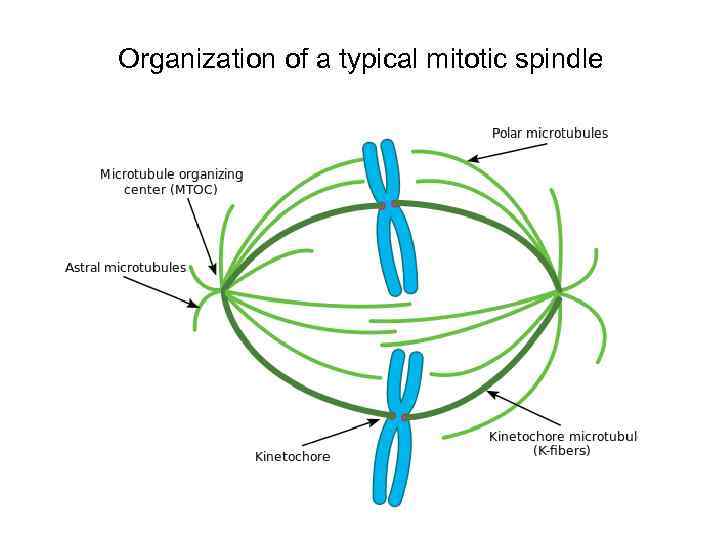
Organization of a typical mitotic spindle
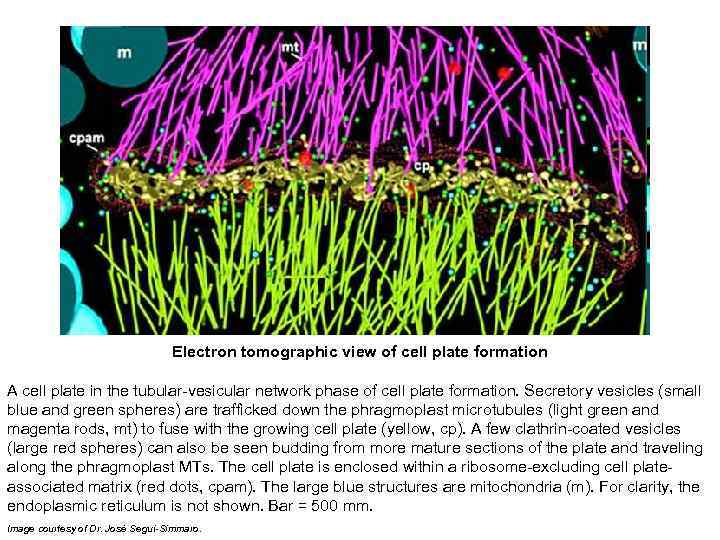
Electron tomographic view of cell plate formation A cell plate in the tubular-vesicular network phase of cell plate formation. Secretory vesicles (small blue and green spheres) are trafficked down the phragmoplast microtubules (light green and magenta rods, mt) to fuse with the growing cell plate (yellow, cp). A few clathrin-coated vesicles (large red spheres) can also be seen budding from more mature sections of the plate and traveling along the phragmoplast MTs. The cell plate is enclosed within a ribosome-excluding cell plateassociated matrix (red dots, cpam). The large blue structures are mitochondria (m). For clarity, the endoplasmic reticulum is not shown. Bar = 500 mm. Image courtesy of Dr. José Seguí-Simmaro.
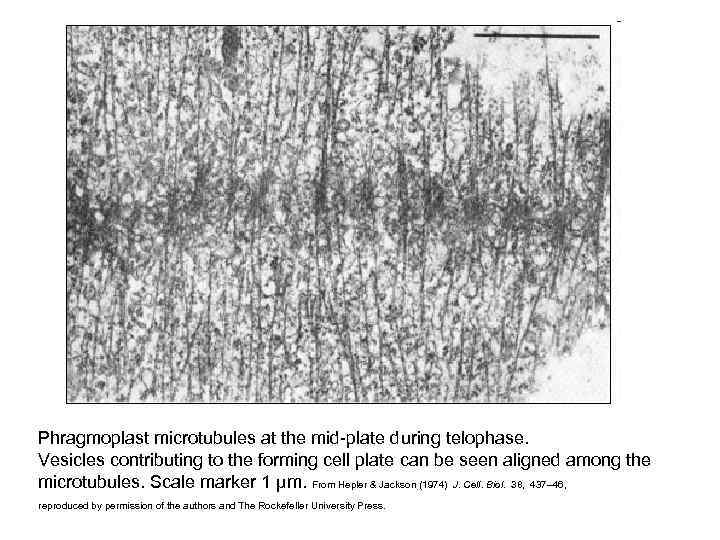
Phragmoplast microtubules at the mid-plate during telophase. Vesicles contributing to the forming cell plate can be seen aligned among the microtubules. Scale marker 1 µm. From Hepler & Jackson (1974) J. Cell. Biol. 38, 437– 46, reproduced by permission of the authors and The Rockefeller University Press.
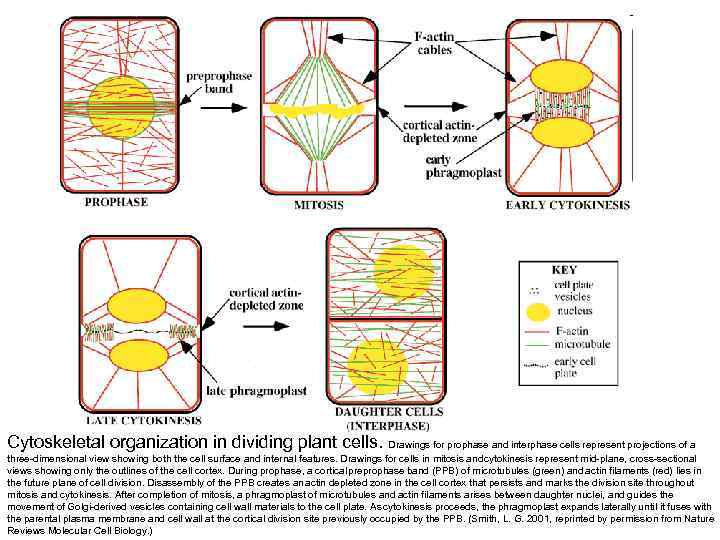
Cytoskeletal organization in dividing plant cells. Drawings for prophase and interphase cells represent projections of a three-dimensional view showing both the cell surface and internal features. Drawings for cells in mitosis and ytokinesis represent mid-plane, cross-sectional c views showing only the outlines of the cell cortex. During prophase, a cortical preprophase band (PPB) of microtubules (green) and actin filaments (red) lies in the future plane of cell division. Disassembly of the PPB creates an actin depleted zone in the cell cortex that persists and marks the division site throughout mitosis and cytokinesis. After completion of mitosis, a phragmoplast of microtubules and actin filaments arises between daughter nuclei, and guides the movement of Golgi-derived vesicles containing cell wall materials to the cell plate. As cytokinesis proceeds, the phragmoplast expands laterally until it fuses with the parental plasma membrane and cell wall at the cortical division site previously occupied by the PPB. (Smith, L. G. 2001, reprinted by permission from Nature Reviews Molecular Cell Biology. )
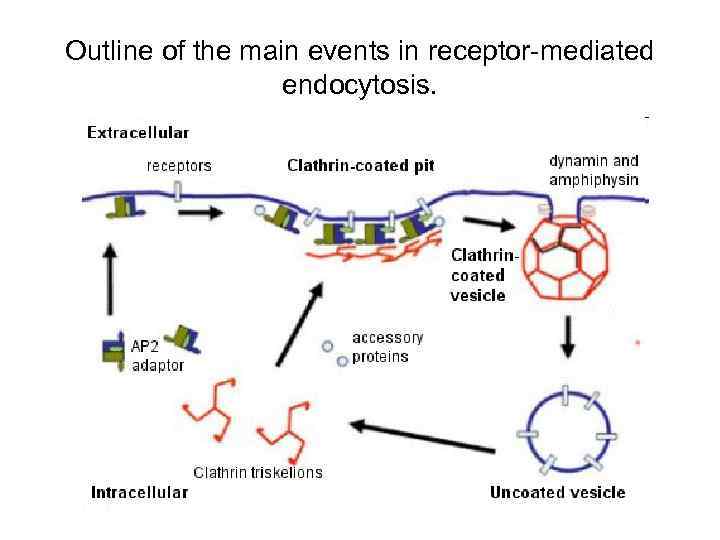
Outline of the main events in receptor-mediated endocytosis.
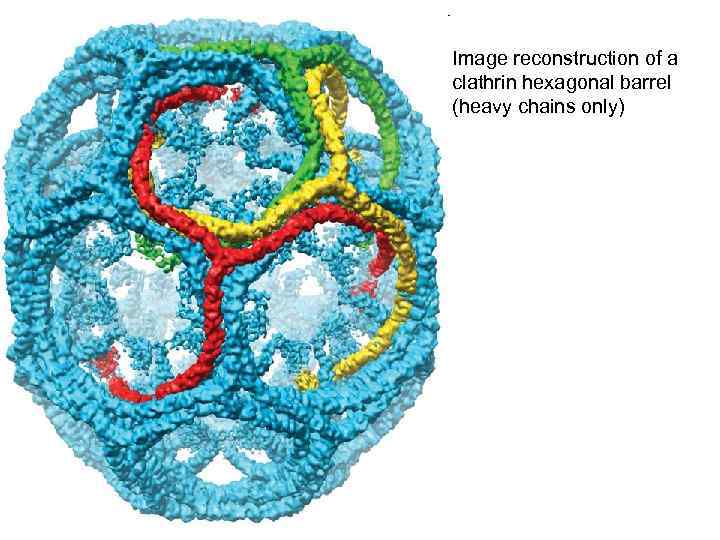
Image reconstruction of a clathrin hexagonal barrel (heavy chains only)
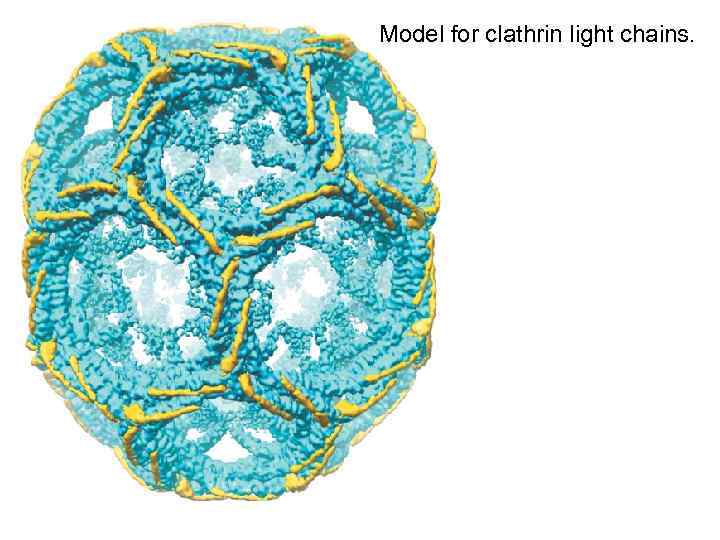
Model for clathrin light chains.
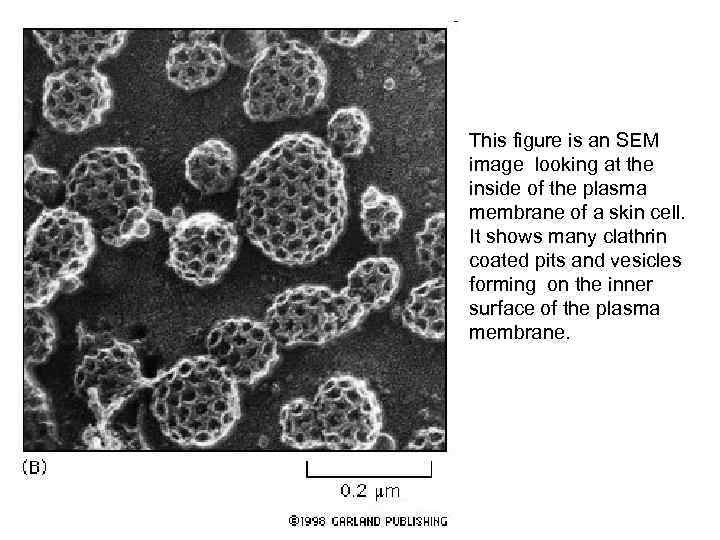
This figure is an SEM image looking at the inside of the plasma membrane of a skin cell. It shows many clathrin coated pits and vesicles forming on the inner surface of the plasma membrane.
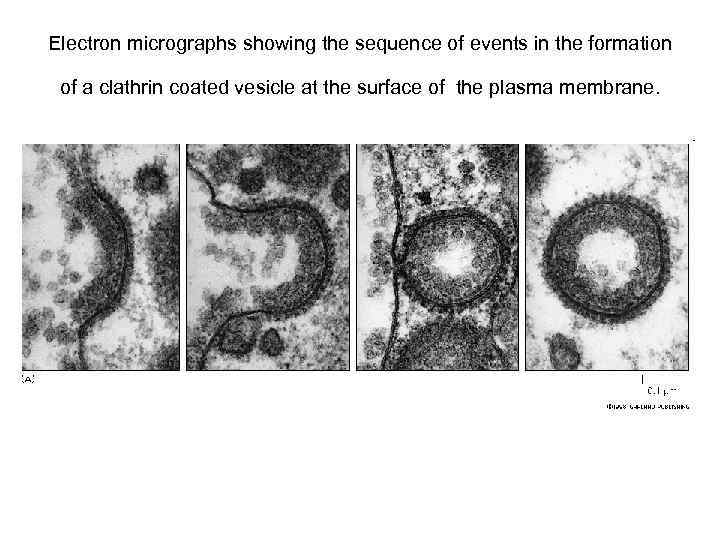
Electron micrographs showing the sequence of events in the formation of a clathrin coated vesicle at the surface of the plasma membrane.
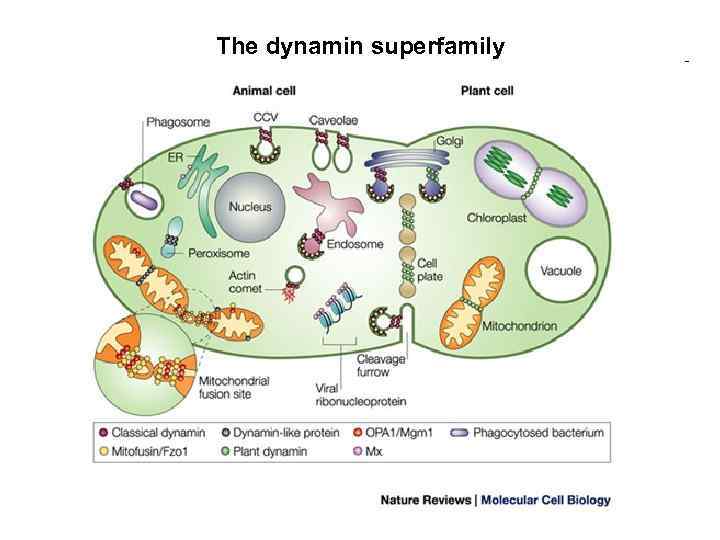
The dynamin superfamily
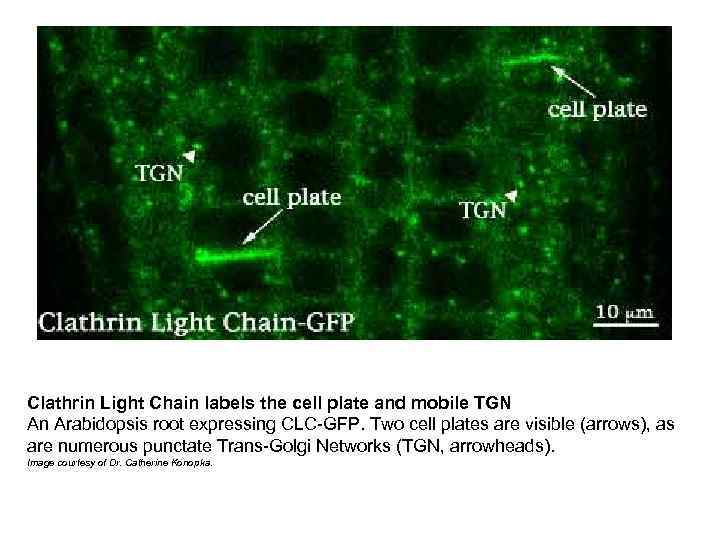
Clathrin Light Chain labels the cell plate and mobile TGN An Arabidopsis root expressing CLC-GFP. Two cell plates are visible (arrows), as are numerous punctate Trans-Golgi Networks (TGN, arrowheads). Image courtesy of Dr. Catherine Konopka.
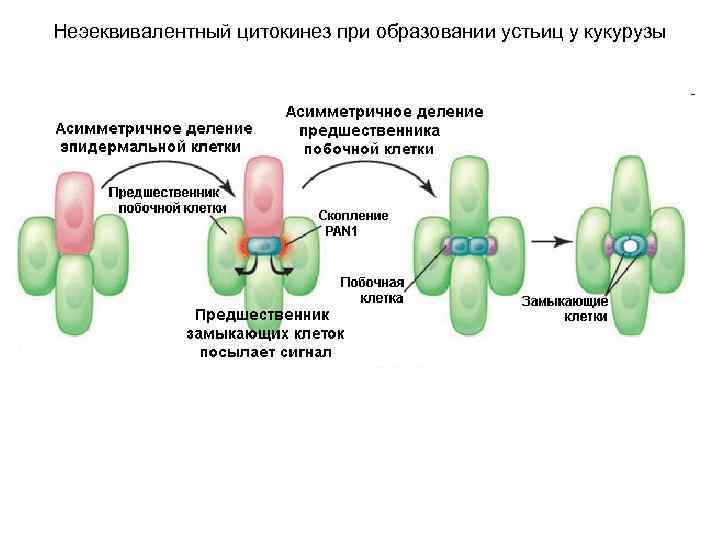
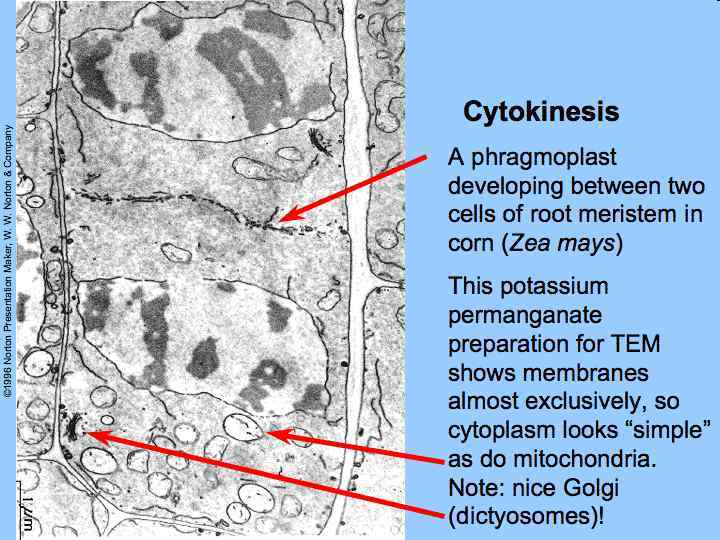
Неэеквивалентный цитокинез при образовании устьиц у кукурузы
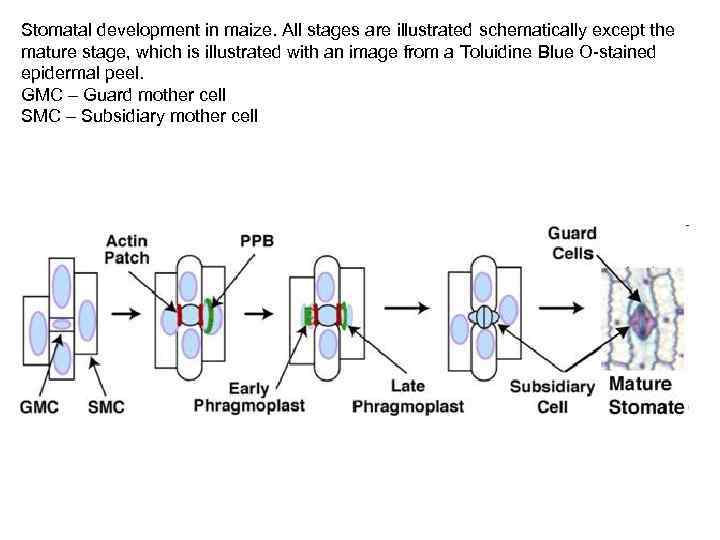
Stomatal development in maize. All stages are illustrated schematically except the mature stage, which is illustrated with an image from a Toluidine Blue O-stained epidermal peel. GMC – Guard mother cell SMC – Subsidiary mother cell
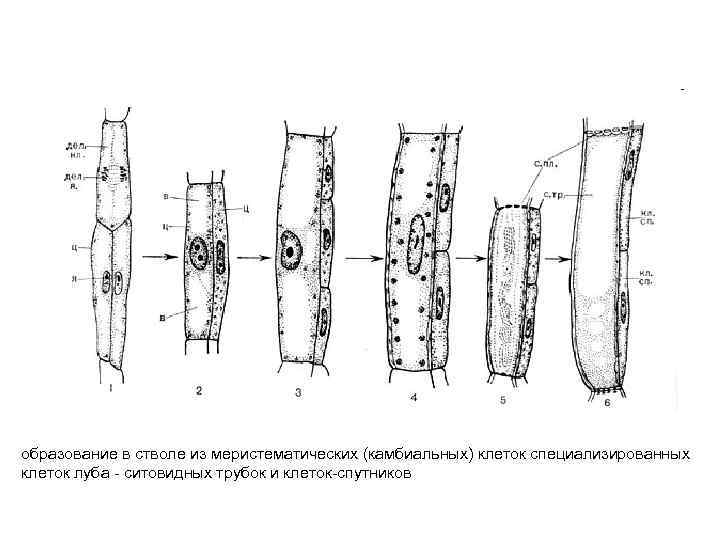
образование в стволе из меристематических (камбиальных) клеток специализированных клеток луба - ситовидных трубок и клеток-спутников
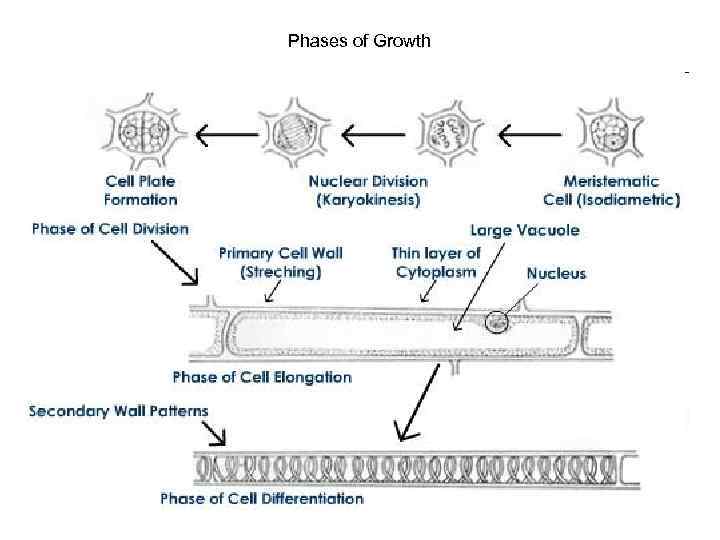
Phases of Growth
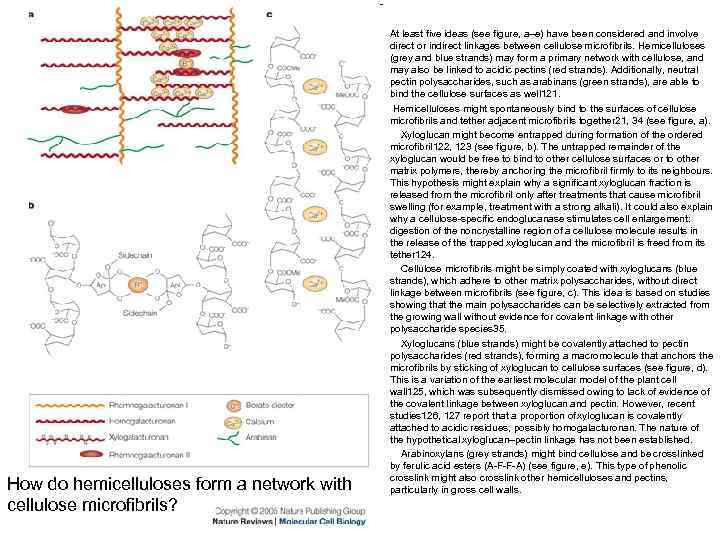
How do hemicelluloses form a network with cellulose microfibrils? At least five ideas (see figure, a–e) have been considered and involve direct or indirect linkages between cellulose microfibrils. Hemicelluloses (grey and blue strands) may form a primary network with cellulose, and may also be linked to acidic pectins (red strands). Additionally, neutral pectin polysaccharides, such as arabinans (green strands), are able to bind the cellulose surfaces as well 121. Hemicelluloses might spontaneously bind to the surfaces of cellulose microfibrils and tether adjacent microfibrils together 21, 34 (see figure, a). Xyloglucan might become entrapped during formation of the ordered microfibril 122, 123 (see figure, b). The untrapped remainder of the xyloglucan would be free to bind to other cellulose surfaces or to other matrix polymers, thereby anchoring the microfibril firmly to its neighbours. This hypothesis might explain why a significant xyloglucan fraction is released from the microfibril only after treatments that cause microfibril swelling (for example, treatment with a strong alkali). It could also explain why a cellulose-specific endoglucanase stimulates cell enlargement: digestion of the noncrystalline region of a cellulose molecule results in the release of the trapped xyloglucan and the microfibril is freed from its tether 124. Cellulose microfibrils might be simply coated with xyloglucans (blue strands), which adhere to other matrix polysaccharides, without direct linkage between microfibrils (see figure, c). This idea is based on studies showing that the main polysaccharides can be selectively extracted from the growing wall without evidence for covalent linkage with other polysaccharide species 35. Xyloglucans (blue strands) might be covalently attached to pectin polysaccharides (red strands), forming a macromolecule that anchors the microfibrils by sticking of xyloglucan to cellulose surfaces (see figure, d). This is a variation of the earliest molecular model of the plant cell wall 125, which was subsequently dismissed owing to lack of evidence of the covalent linkage between xyloglucan and pectin. However, recent studies 126, 127 report that a proportion of xyloglucan is covalently attached to acidic residues, possibly homogalacturonan. The nature of the hypothetical xyloglucan–pectin linkage has not been established. Arabinoxylans (grey strands) might bind cellulose and be crosslinked by ferulic acid esters (A-F-F-A) (see figure, e). This type of phenolic crosslink might also crosslink other hemicelluloses and pectins, particularly in gross cell walls.
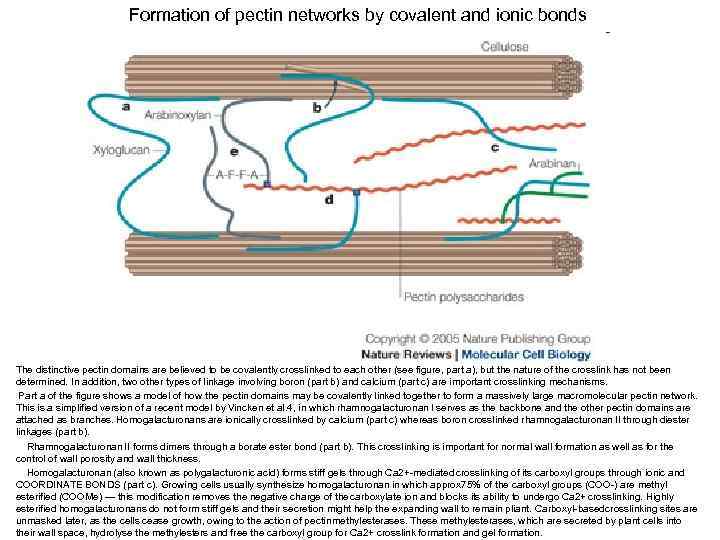
Formation of pectin networks by covalent and ionic bonds The distinctive pectin domains are believed to be covalently crosslinked to each other (see figure, part a), but the nature of the crosslink has not been determined. In addition, two other types of linkage involving boron (part b) and calcium (part c) are important crosslinking mechanisms. Part a of the figure shows a model of how the pectin domains may be covalently linked together to form a massively large macromolecular pectin network. This is a simplified version of a recent model by Vincken et al. 4, in which rhamnogalacturonan I serves as the backbone and the other pectin domains are attached as branches. Homogalacturonans are ionically crosslinked by calcium (part c) whereas boron crosslinked rhamnogalacturonan II through diester linkages (part b). Rhamnogalacturonan II forms dimers through a borate ester bond (part b). This crosslinking is important for normal wall formation as well as for the control of wall porosity and wall thickness. Homogalacturonan (also known as polygalacturonic acid) forms stiff gels through Ca 2+-mediated crosslinking of its carboxyl groups through ionic and COORDINATE BONDS (part c). Growing cells usually synthesize homogalacturonan in which approx 75% of the carboxyl groups (COO-) are methyl esterified (COOMe) — this modification removes the negative charge of the carboxylate ion and blocks its ability to undergo Ca 2+ crosslinking. Highly esterified homogalacturonans do not form stiff gels and their secretion might help the expanding wall to remain pliant. Carboxyl-based rosslinking sites are c unmasked later, as the cells cease growth, owing to the action of pectin methylesterases. These methylesterases, which are secreted by plant cells into their wall space, hydrolyse the methylesters and free the carboxyl group for Ca 2+ crosslink formation and gel formation.
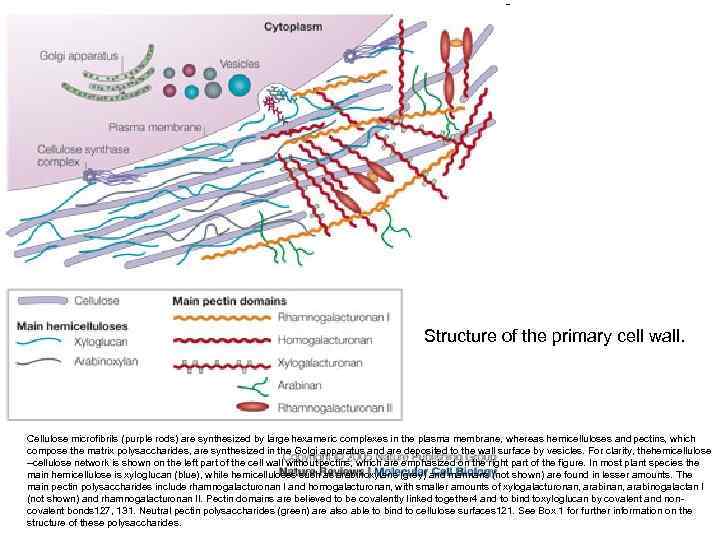
Structure of the primary cell wall. Cellulose microfibrils (purple rods) are synthesized by large hexameric complexes in the plasma membrane, whereas hemicelluloses and pectins, which compose the matrix polysaccharides, are synthesized in the Golgi apparatus and are deposited to the wall surface by vesicles. For clarity, the emicellulose h –cellulose network is shown on the left part of the cell wall without pectins, which are emphasized on the right part of the figure. In most plant species the main hemicellulose is xyloglucan (blue), while hemicelluloses such as arabinoxylans (grey) and mannans (not shown) are found in lesser amounts. The main pectin polysaccharides include rhamnogalacturonan I and homogalacturonan, with smaller amounts of xylogalacturonan, arabinogalactan I (not shown) and rhamnogalacturonan II. Pectin domains are believed to be covalently linked together 4 and to bind to yloglucan by covalent and nonx covalent bonds 127, 131. Neutral pectin polysaccharides (green) are also able to bind to cellulose surfaces 121. See Box 1 for further information on the structure of these polysaccharides.
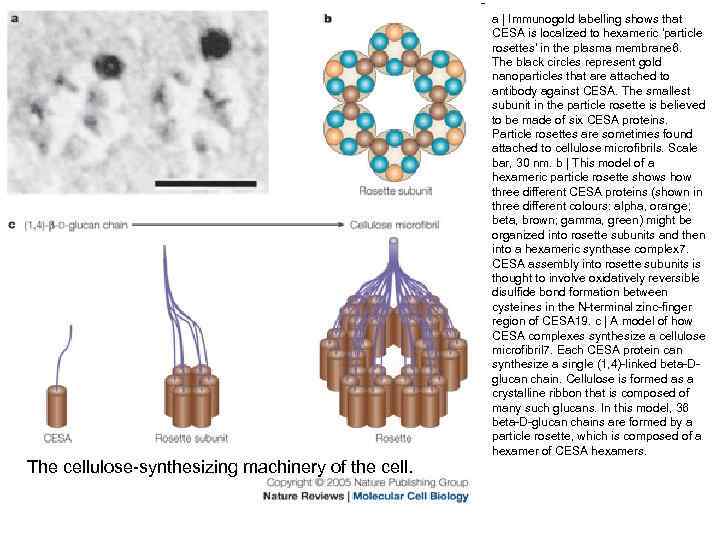
The cellulose-synthesizing machinery of the cell. a | Immunogold labelling shows that CESA is localized to hexameric 'particle rosettes' in the plasma membrane 6. The black circles represent gold nanoparticles that are attached to antibody against CESA. The smallest subunit in the particle rosette is believed to be made of six CESA proteins. Particle rosettes are sometimes found attached to cellulose microfibrils. Scale bar, 30 nm. b | This model of a hexameric particle rosette shows how three different CESA proteins (shown in three different colours: alpha, orange; beta, brown; gamma, green) might be organized into rosette subunits and then into a hexameric synthase complex 7. CESA assembly into rosette subunits is thought to involve oxidatively reversible disulfide bond formation between cysteines in the N-terminal zinc-finger region of CESA 19. c | A model of how CESA complexes synthesize a cellulose microfibril 7. Each CESA protein can synthesize a single (1, 4)-linked beta-Dglucan chain. Cellulose is formed as a crystalline ribbon that is composed of many such glucans. In this model, 36 beta-D-glucan chains are formed by a particle rosette, which is composed of a hexamer of CESA hexamers.
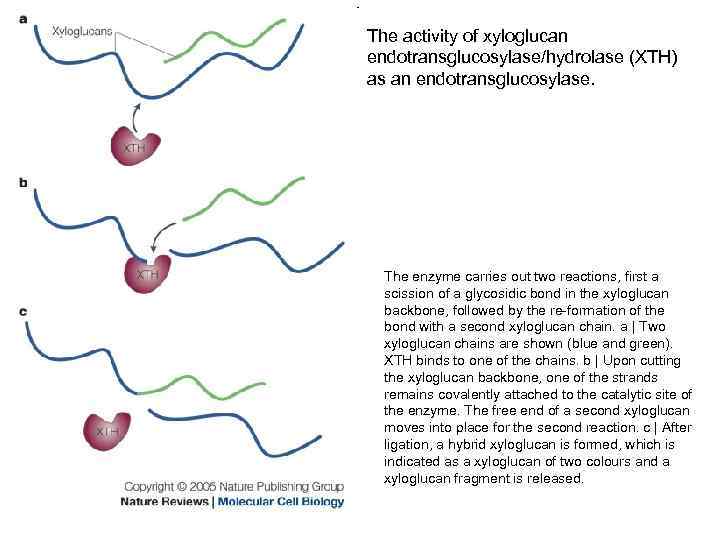
The activity of xyloglucan endotransglucosylase/hydrolase (XTH) as an endotransglucosylase. The enzyme carries out two reactions, first a scission of a glycosidic bond in the xyloglucan backbone, followed by the re-formation of the bond with a second xyloglucan chain. a | Two xyloglucan chains are shown (blue and green). XTH binds to one of the chains. b | Upon cutting the xyloglucan backbone, one of the strands remains covalently attached to the catalytic site of the enzyme. The free end of a second xyloglucan moves into place for the second reaction. c | After ligation, a hybrid xyloglucan is formed, which is indicated as a xyloglucan of two colours and a xyloglucan fragment is released.
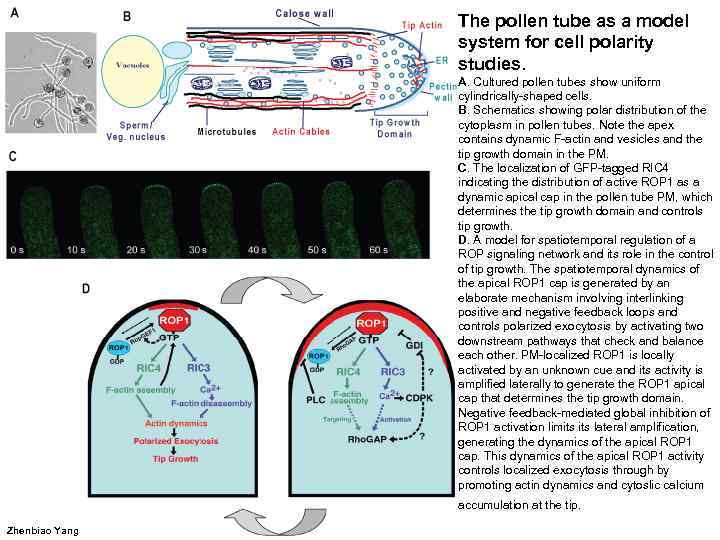
The pollen tube as a model system for cell polarity studies. A. Cultured pollen tubes show uniform cylindrically-shaped cells. B. Schematics showing polar distribution of the cytoplasm in pollen tubes. Note the apex contains dynamic F-actin and vesicles and the tip growth domain in the PM. C. The localization of GFP-tagged RIC 4 indicating the distribution of active ROP 1 as a dynamic apical cap in the pollen tube PM, which determines the tip growth domain and controls tip growth. D. A model for spatiotemporal regulation of a ROP signaling network and its role in the control of tip growth. The spatiotemporal dynamics of the apical ROP 1 cap is generated by an elaborate mechanism involving interlinking positive and negative feedback loops and controls polarized exocytosis by activating two downstream pathways that check and balance each other. PM-localized ROP 1 is locally activated by an unknown cue and its activity is amplified laterally to generate the ROP 1 apical cap that determines the tip growth domain. Negative feedback-mediated global inhibition of ROP 1 activation limits lateral amplification, generating the dynamics of the apical ROP 1 cap. This dynamics of the apical ROP 1 activity controls localized exocytosis through by promoting actin dynamics and cytoslic calcium accumulation at the tip. Zhenbiao Yang
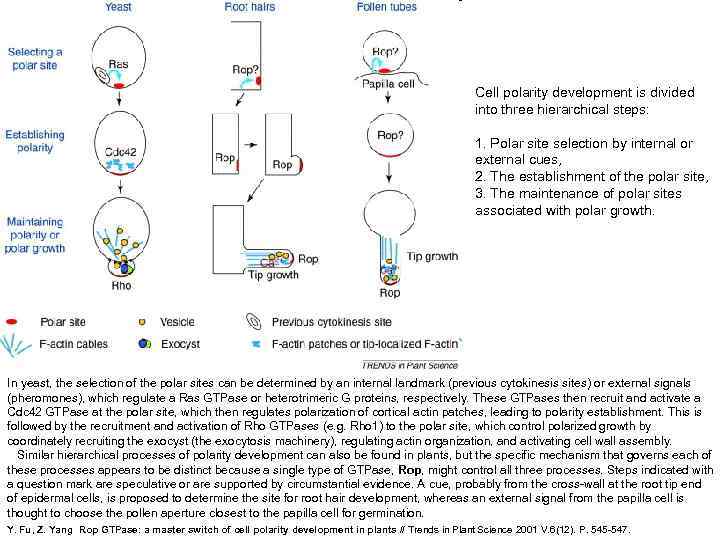
Cell polarity development is divided into three hierarchical steps: 1. Polar site selection by internal or external cues, 2. The establishment of the polar site, 3. The maintenance of polar sites associated with polar growth. In yeast, the selection of the polar sites can be determined by an internal landmark (previous cytokinesis sites) or external signals (pheromones), which regulate a Ras GTPase or heterotrimeric G proteins, respectively. These GTPases then recruit and activate a Cdc 42 GTPase at the polar site, which then regulates polarization of cortical actin patches, leading to polarity establishment. This is followed by the recruitment and activation of Rho GTPases (e. g. Rho 1) to the polar site, which control polarized growth by coordinately recruiting the exocyst (the exocytosis machinery), regulating actin organization, and activating cell wall assembly. Similar hierarchical processes of polarity development can also be found in plants, but the specific mechanism that governs each of these processes appears to be distinct because a single type of GTPase, Rop, might control all three processes. Steps indicated with a question mark are speculative or are supported by circumstantial evidence. A cue, probably from the cross-wall at the root tip end of epidermal cells, is proposed to determine the site for root hair development, whereas an external signal from the papilla cell is thought to choose the pollen aperture closest to the papilla cell for germination. Y. Fu, Z. Yang Rop GTPase: a master switch of cell polarity development in plants // Trends in Plant Science 2001 V. 6(12). P. 545 -547.
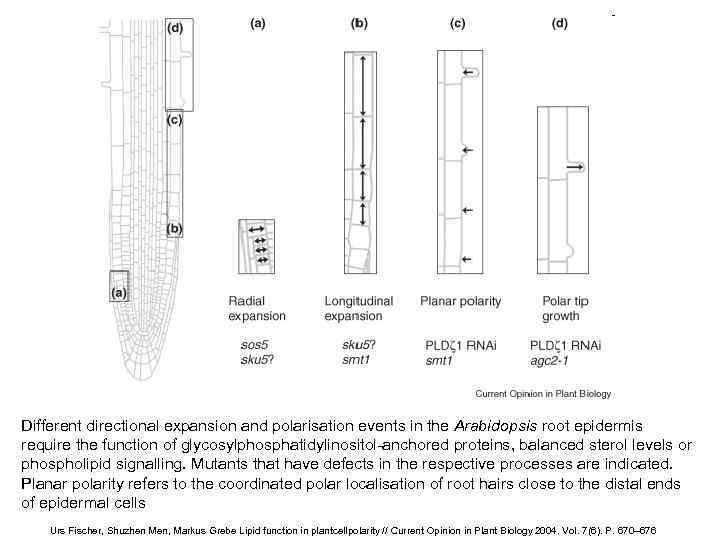
Different directional expansion and polarisation events in the Arabidopsis root epidermis require the function of glycosylphosphatidylinositol-anchored proteins, balanced sterol levels or phospholipid signalling. Mutants that have defects in the respective processes are indicated. Planar polarity refers to the coordinated polar localisation of root hairs close to the distal ends of epidermal cells Urs Fischer, Shuzhen Men, Markus Grebe Lipid function in plantcellpolarity // Current Opinion in Plant Biology 2004. Vol. 7(6). P. 670– 676
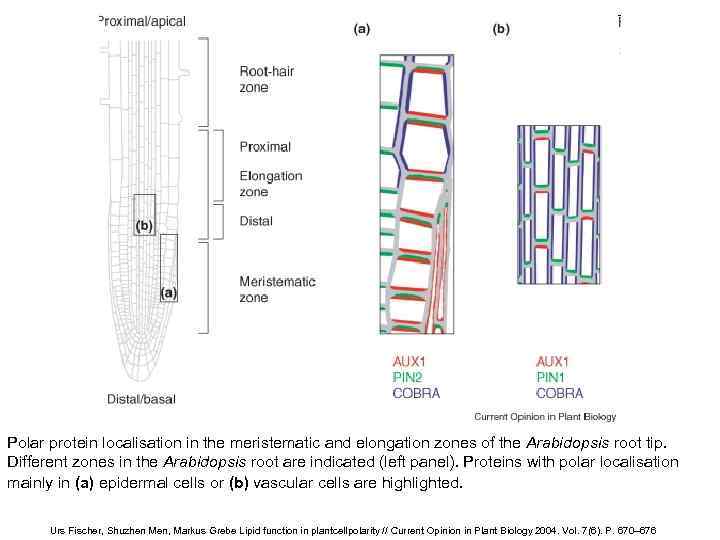
Polar protein localisation in the meristematic and elongation zones of the Arabidopsis root tip. Different zones in the Arabidopsis root are indicated (left panel). Proteins with polar localisation mainly in (a) epidermal cells or (b) vascular cells are highlighted. Urs Fischer, Shuzhen Men, Markus Grebe Lipid function in plantcellpolarity // Current Opinion in Plant Biology 2004. Vol. 7(6). P. 670– 676
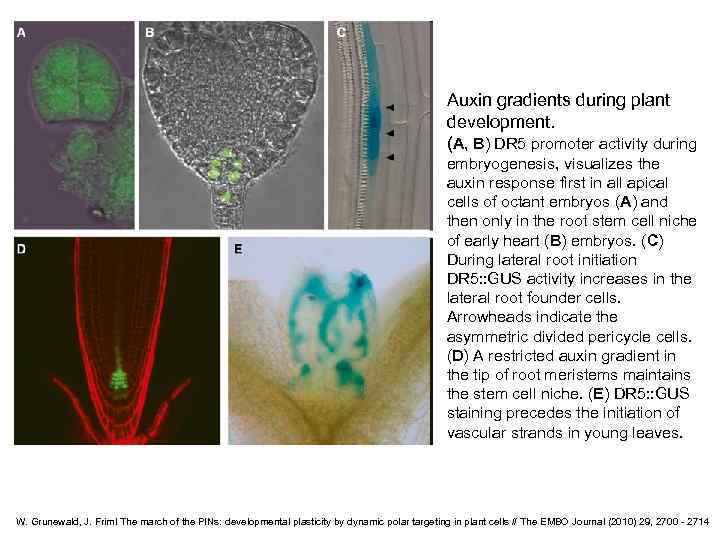
Auxin gradients during plant development. (A, B) DR 5 promoter activity during embryogenesis, visualizes the auxin response first in all apical cells of octant embryos (A) and then only in the root stem cell niche of early heart (B) embryos. (C) During lateral root initiation DR 5: : GUS activity increases in the lateral root founder cells. Arrowheads indicate the asymmetric divided pericycle cells. (D) A restricted auxin gradient in the tip of root meristems maintains the stem cell niche. (E) DR 5: : GUS staining precedes the initiation of vascular strands in young leaves. W. Grunewald, J. Friml The march of the PINs: developmental plasticity by dynamic polar targeting in plant cells // The EMBO Journal (2010) 29, 2700 - 2714
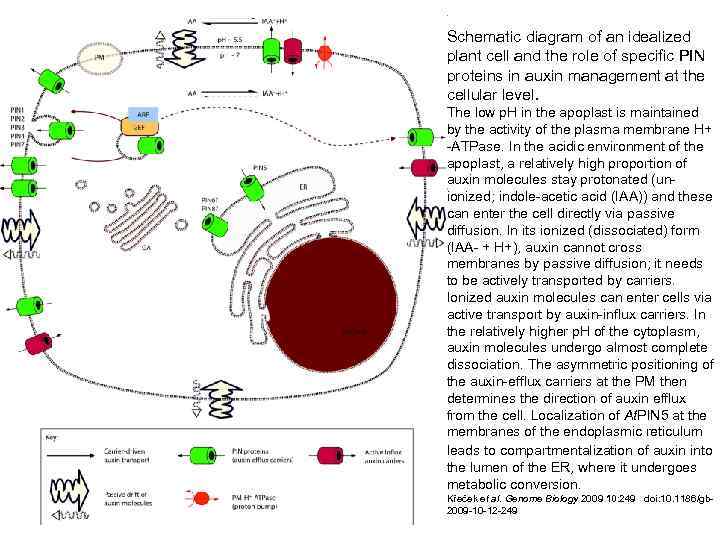
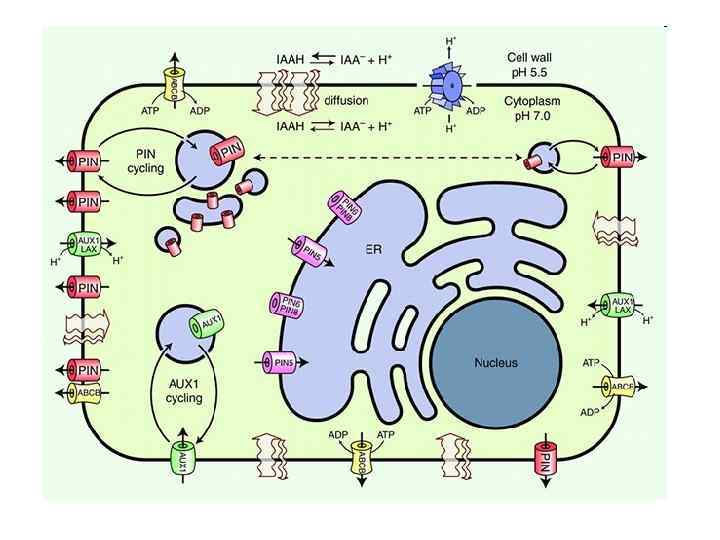
Schematic diagram of an idealized plant cell and the role of specific PIN proteins in auxin management at the cellular level. The low p. H in the apoplast is maintained by the activity of the plasma membrane H+ -ATPase. In the acidic environment of the apoplast, a relatively high proportion of auxin molecules stay protonated (unionized; indole-acetic acid (IAA)) and these can enter the cell directly via passive diffusion. In its ionized (dissociated) form (IAA- + H+), auxin cannot cross membranes by passive diffusion; it needs to be actively transported by carriers. Ionized auxin molecules can enter cells via active transport by auxin-influx carriers. In the relatively higher p. H of the cytoplasm, auxin molecules undergo almost complete dissociation. The asymmetric positioning of the auxin-efflux carriers at the PM then determines the direction of auxin efflux from the cell. Localization of At. PIN 5 at the membranes of the endoplasmic reticulum leads to compartmentalization of auxin into the lumen of the ER, where it undergoes metabolic conversion. Křeček et al. Genome Biology 2009 10: 249 doi: 10. 1186/gb 2009 -10 -12 -249
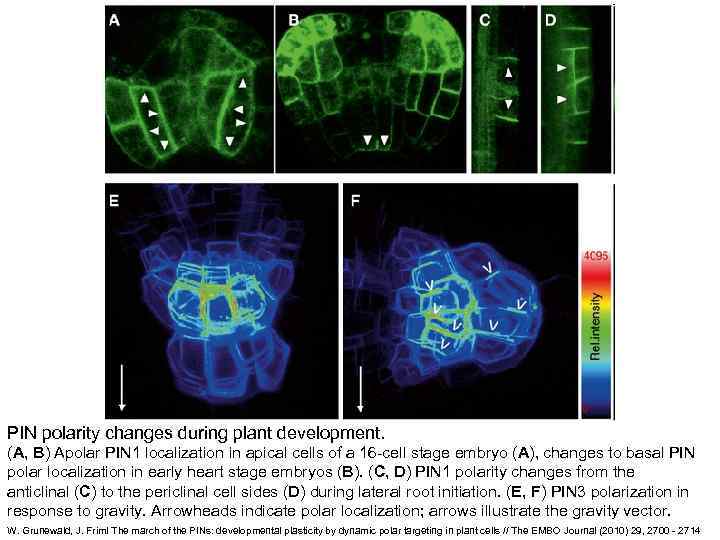
PIN polarity changes during plant development. (A, B) Apolar PIN 1 localization in apical cells of a 16 -cell stage embryo (A), changes to basal PIN polar localization in early heart stage embryos (B). (C, D) PIN 1 polarity changes from the anticlinal (C) to the periclinal cell sides (D) during lateral root initiation. (E, F) PIN 3 polarization in response to gravity. Arrowheads indicate polar localization; arrows illustrate the gravity vector. W. Grunewald, J. Friml The march of the PINs: developmental plasticity by dynamic polar targeting in plant cells // The EMBO Journal (2010) 29, 2700 - 2714
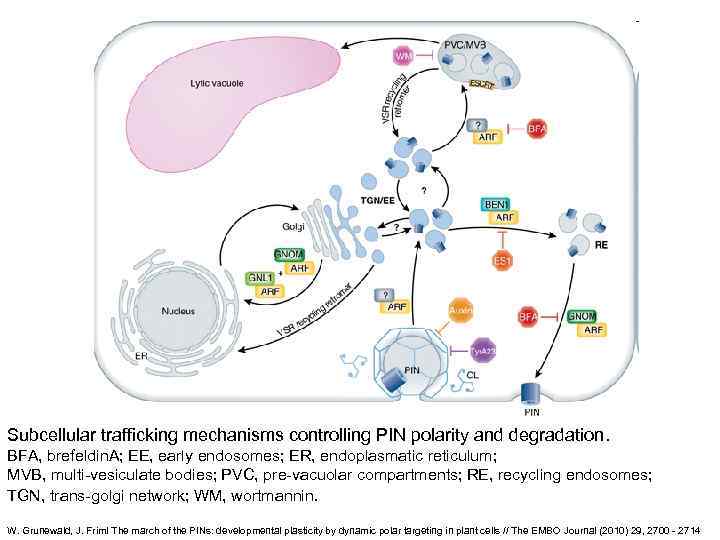
Subcellular trafficking mechanisms controlling PIN polarity and degradation. BFA, brefeldin. A; EE, early endosomes; ER, endoplasmatic reticulum; MVB, multi-vesiculate bodies; PVC, pre-vacuolar compartments; RE, recycling endosomes; TGN, trans-golgi network; WM, wortmannin. W. Grunewald, J. Friml The march of the PINs: developmental plasticity by dynamic polar targeting in plant cells // The EMBO Journal (2010) 29, 2700 - 2714
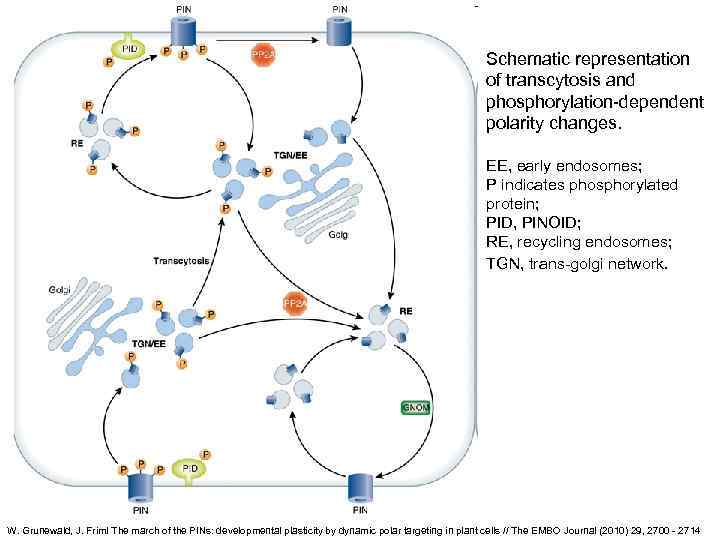
Schematic representation of transcytosis and phosphorylation-dependent polarity changes. EE, early endosomes; P indicates phosphorylated protein; PID, PINOID; RE, recycling endosomes; TGN, trans-golgi network. W. Grunewald, J. Friml The march of the PINs: developmental plasticity by dynamic polar targeting in plant cells // The EMBO Journal (2010) 29, 2700 - 2714
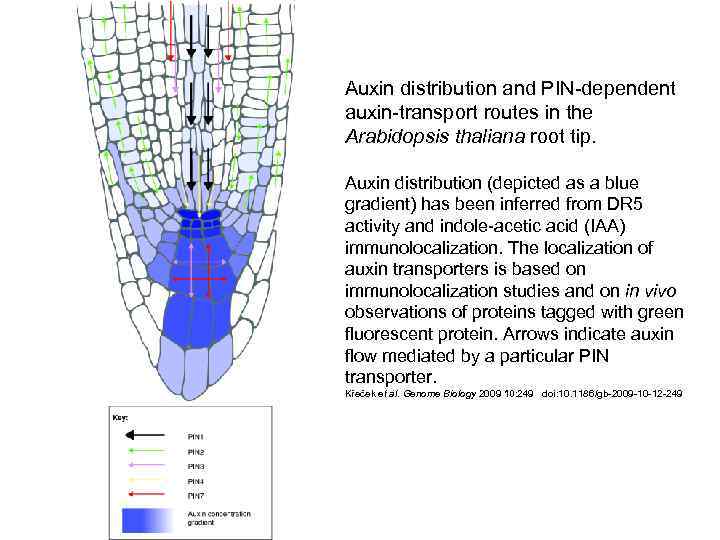
Auxin distribution and PIN-dependent auxin-transport routes in the Arabidopsis thaliana root tip. Auxin distribution (depicted as a blue gradient) has been inferred from DR 5 activity and indole-acetic acid (IAA) immunolocalization. The localization of auxin transporters is based on immunolocalization studies and on in vivo observations of proteins tagged with green fluorescent protein. Arrows indicate auxin flow mediated by a particular PIN transporter. Křeček et al. Genome Biology 2009 10: 249 doi: 10. 1186/gb-2009 -10 -12 -249
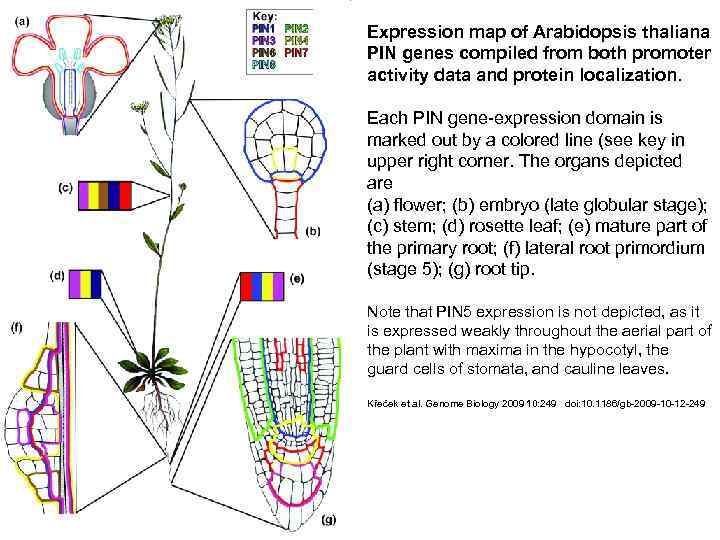
Expression map of Arabidopsis thaliana PIN genes compiled from both promoter activity data and protein localization. Each PIN gene-expression domain is marked out by a colored line (see key in upper right corner. The organs depicted are (a) flower; (b) embryo (late globular stage); (c) stem; (d) rosette leaf; (e) mature part of the primary root; (f) lateral root primordium (stage 5); (g) root tip. Note that PIN 5 expression is not depicted, as it is expressed weakly throughout the aerial part of the plant with maxima in the hypocotyl, the guard cells of stomata, and cauline leaves. Křeček et al. Genome Biology 2009 10: 249 doi: 10. 1186/gb-2009 -10 -12 -249
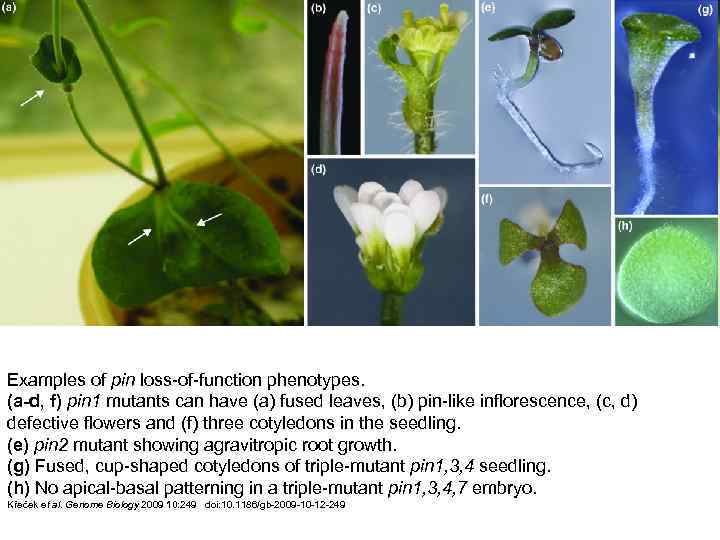
Examples of pin loss-of-function phenotypes. (a-d, f) pin 1 mutants can have (a) fused leaves, (b) pin-like inflorescence, (c, d) defective flowers and (f) three cotyledons in the seedling. (e) pin 2 mutant showing agravitropic root growth. (g) Fused, cup-shaped cotyledons of triple-mutant pin 1, 3, 4 seedling. (h) No apical-basal patterning in a triple-mutant pin 1, 3, 4, 7 embryo. Křeček et al. Genome Biology 2009 10: 249 doi: 10. 1186/gb-2009 -10 -12 -249
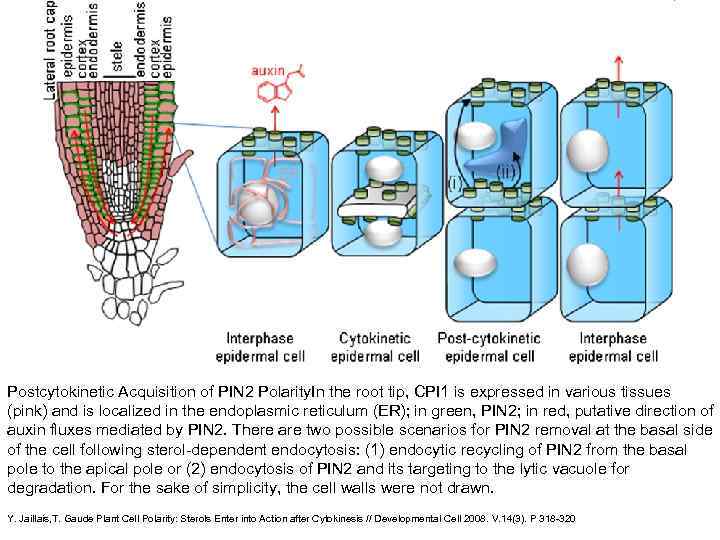
Postcytokinetic Acquisition of PIN 2 Polarity. In the root tip, CPI 1 is expressed in various tissues (pink) and is localized in the endoplasmic reticulum (ER); in green, PIN 2; in red, putative direction of auxin fluxes mediated by PIN 2. There are two possible scenarios for PIN 2 removal at the basal side of the cell following sterol-dependent endocytosis: (1) endocytic recycling of PIN 2 from the basal pole to the apical pole or (2) endocytosis of PIN 2 and its targeting to the lytic vacuole for degradation. For the sake of simplicity, the cell walls were not drawn. Y. Jaillais, T. Gaude Plant Cell Polarity: Sterols Enter into Action after Cytokinesis // Developmental Cell 2008. V. 14(3). P 318 -320
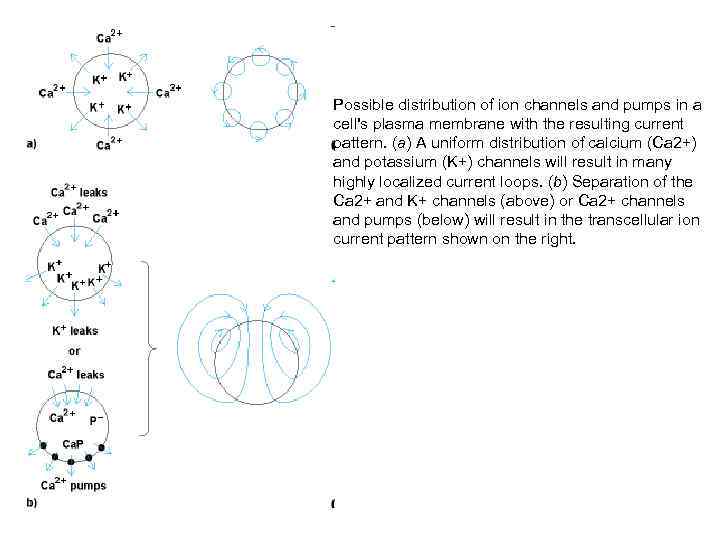
Possible distribution of ion channels and pumps in a cell's plasma membrane with the resulting current pattern. (a) A uniform distribution of calcium (Ca 2+) and potassium (K+) channels will result in many highly localized current loops. (b) Separation of the Ca 2+ and K+ channels (above) or Ca 2+ channels and pumps (below) will result in the transcellular ion current pattern shown on the right.
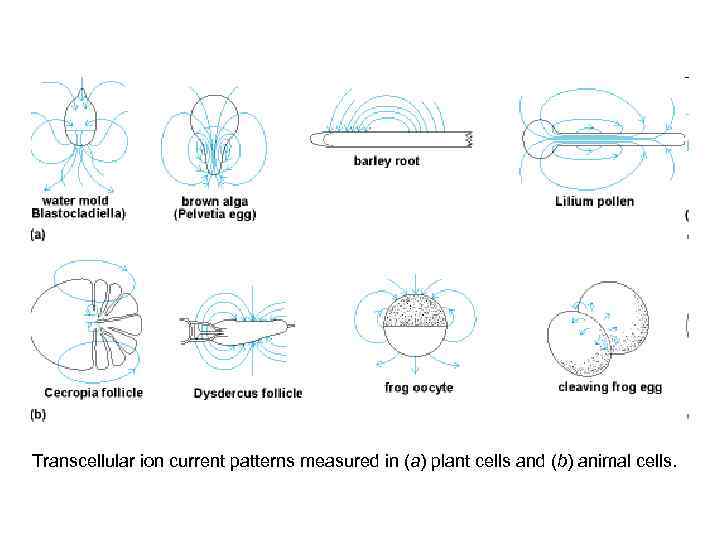
Transcellular ion current patterns measured in (a) plant cells and (b) animal cells.

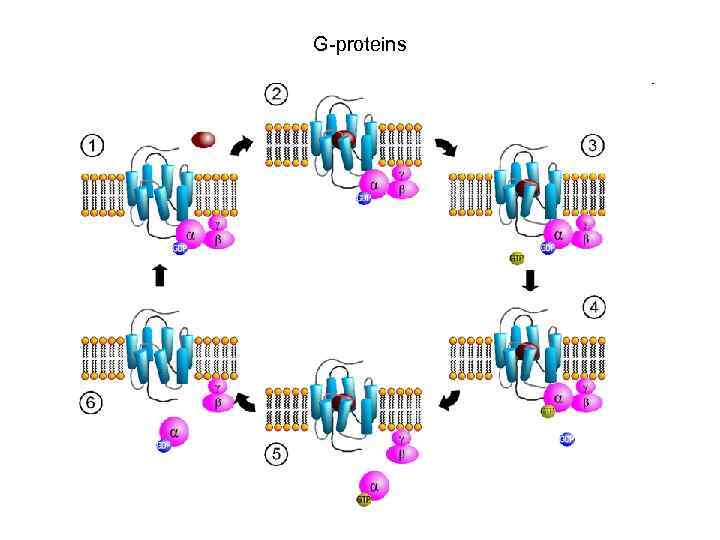
G-proteins
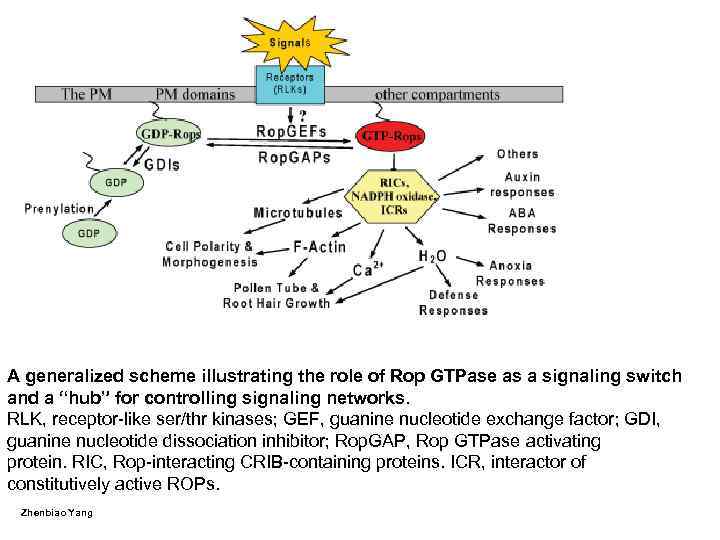
A generalized scheme illustrating the role of Rop GTPase as a signaling switch and a “hub” for controlling signaling networks. RLK, receptor-like ser/thr kinases; GEF, guanine nucleotide exchange factor; GDI, guanine nucleotide dissociation inhibitor; Rop. GAP, Rop GTPase activating protein. RIC, Rop-interacting CRIB-containing proteins. ICR, interactor of constitutively active ROPs. Zhenbiao Yang
09 - Онтогенез клетки.ppt