Inventories.pptx
- Количество слайдов: 36


Vasanthan Deva Inbaraj Aisara Bakyt Pang Bo Thibaud Keuper Anastasia Borsuk Alexey Knizhnikov Misha Sladkevich

Definition: Inventory is an asset that is intended to be sold in the ordinary course of business. Inventory may not be immediately ready for sale. Inventory items can fall into one of the following three categories: 1. Held for sale in the ordinary course of business; 2. That is in the process of being produced for sale; 3. The materials or supplies intended for consumption in the production process. This asset classification includes items purchased and held for resale. In the case of services, inventory can be the costs of a service for which related revenue has not yet been recognized.

§ Raw materials § Work in process § Finished goods

Definition: Raw materials are the inputs or resources that a company uses to manufacture its finished products. In other words, this is the unprocessed material like metal stock, rubber blanks, or unrefined natural resources that companies use in there manufacturing processes to produce finished goods to sell to consumers. Two subcategories : Direct materials. e. g. Wood Cabinet. Indirect materials. e. g. the lubricant, oils, rags, light bulbsin Debit : the raw materials inventory account Credit : the accounts payable account a manufacturing facility

Definition: Work-in-process inventory is materials that have been partially converted through the production process. These items are typically located in the production area. The valuation of this inventory may be stored in a separate work-in-process account in the general ledger. Raw materials<Work-in-process<Finished goods Some products occupies such a brief period of time that the accounting staff does not bother to track WIP at all, but can be incredibly complex for large projects.

In situations where there are many similar products in process, it is more common to follow these steps to account for work in progress inventory: 1. Assign raw materials. 2. Compile labor costs. 3. Assign overhead. 4. Record the entry.

Finished goods are goods that have been completed by the manufacturing process, or purchased in a completed form, but which have not yet been sold to customers. The cost of finished goods inventory is considered a short-term asset. The total amount of finished goods inventory is reported within a single "Inventory" line item on the balance sheet.

Evaluation Costs of purchase Other costs Costs of conversion

§ Costs of purchase are the cost of goods received including: 1. Taxes; 2. Transport; 3. Handling.

§ Conversion costs are those costs required to convert raw materials into completed products. The concept is used in cost accounting to derive the value of ending inventory, which is then reported in the financial statements. It can also be used to determine the incremental cost of creating a product, which could be useful for price setting purposes. § Conversion costs = Direct labor + Manufacturing overhead § (including fixed and variable manufacturing overheads)

§ Costs incurred in bringing the inventories to their present location and condition

• Abnormal waste • Storage costs • Administrative overheads unrelated to production • Selling costs • Foreign exchange differences • Interest costs

Abnormal waste - a significant amount of inventory waste or wreckage, which may or may not be prevented, during production or operation processes, that may be caused due to machinery breakdown or inefficient processes. It may eventually result in abnormal loss. Also called abnormal spoilage.

Storage costs - cost of storing the taxpayer's possessions Administrative overheads unrelated to production - those costs not involved in the development or production of goods or services Selling costs - expenses incurred in the marketing and distribution of a product

Foreign exchange differences – differences between the exchange of one currency for another or the conversion of one currency into another currency. Interest costs - total interest incurred over the entire term of a loan or credit facility

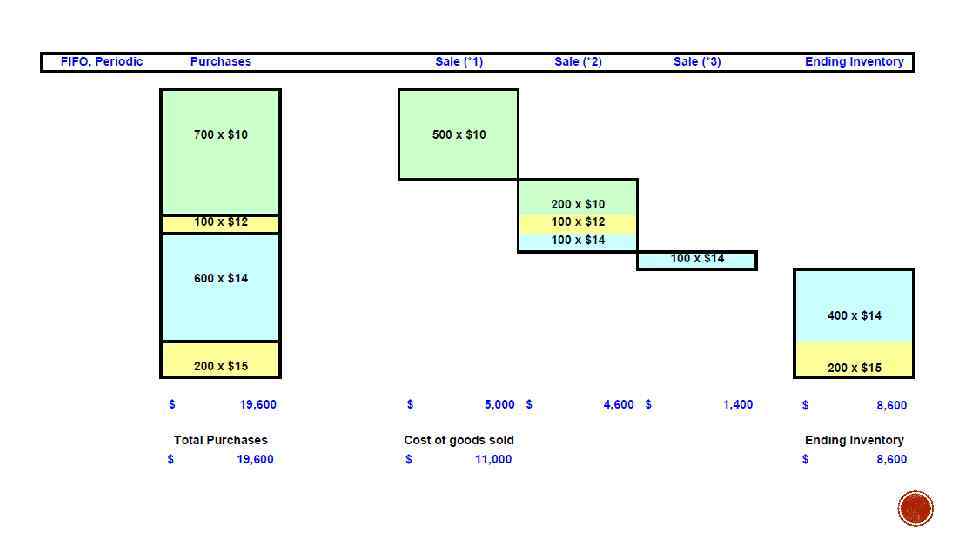
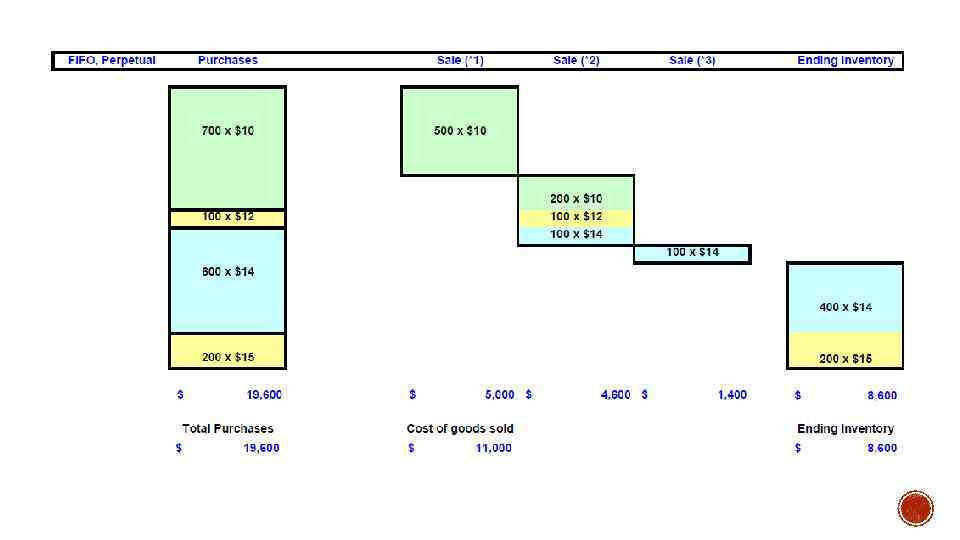
§ Perpetual: shows the amount of inventory on hand at all times. § Periodic: sales are recorded as they occur but the inventory is not updated.

§ Income methods: § FIFO § LIFO § Moving Average § Weighted Average § Methods to estimate Inventory Cost: § Gross Profit Method § Retail Method
")
Date Transactions Units Purchased May 1 Inventory May 3 Purchase May 8 Sale (*1) May 15 Purchase May 19 Purchase May 25 Sale (*2) May 27 Sale (*3) May 31 Ending Inventory Total Units Sold Unit Cost Inventory Units 700 $10 700 100 $12 800 ? ? 300 600 $14 900 200 $15 1, 100 400 ? ? 700 100 ? ? 600 500 1, 600 1, 000
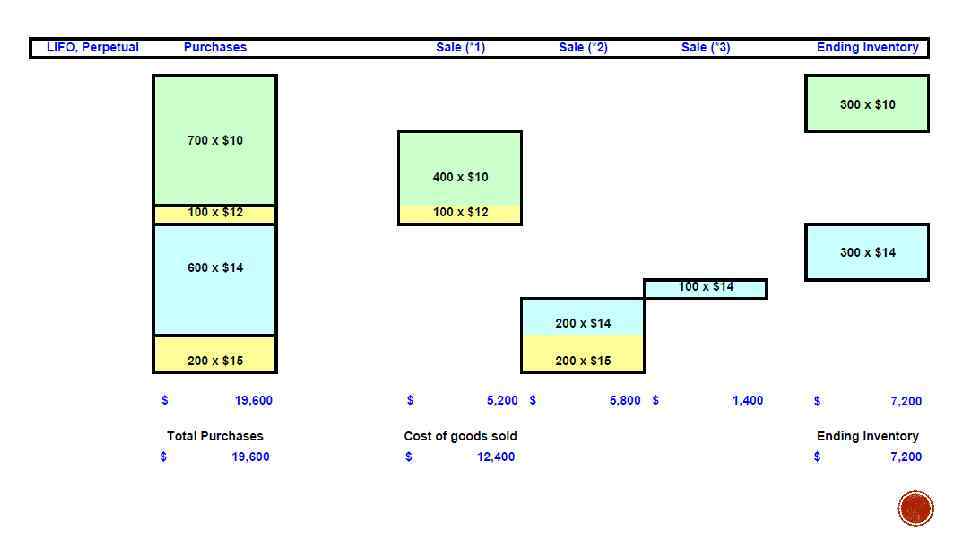
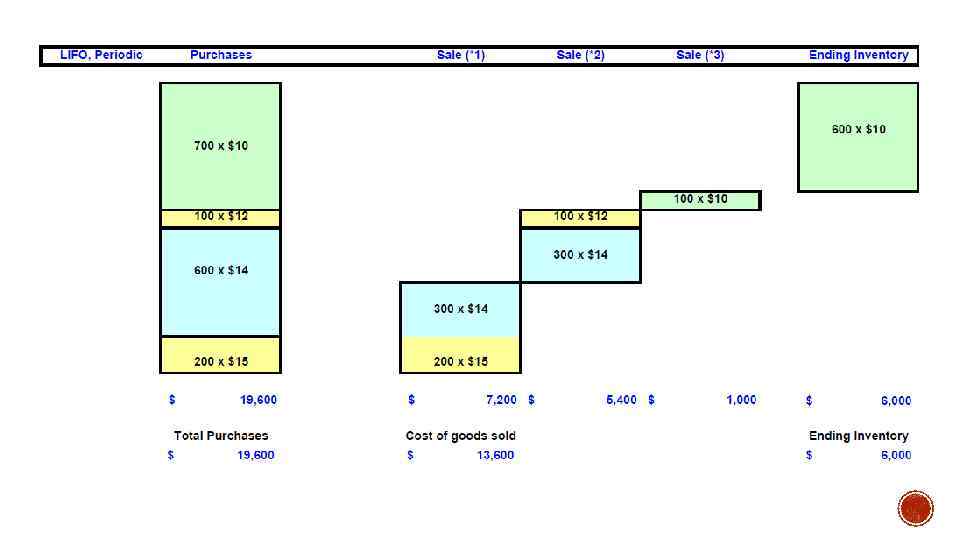

Comparison FIFO LIFO Purchase Perpetual Periodic $ $ When prices go up 19, 600 Old cost < Recent cost Cost of goods sold Ending inventory FIFO Old cost Recent cost < > LIFO Recent cost Old cost Perpetual Cost of goods sold Ending inventory $ $ FIFO 11, 000 8, 600 < > LIFO $ 12, 400 $ 7, 200 Periodic Cost of goods sold Ending inventory $ $ FIFO 11, 000 8, 600 < > LIFO $ 13, 600 $ 6, 000 FIFO Cost of goods sold Ending inventory Perpetual $ 11, 000 $ 8, 600 = = Periodic $ 11, 000 $ 8, 600 LIFO Cost of goods sold Ending inventory Perpetual $ 12, 400 $ 7, 200 < > Periodic $ 13, 600 $ 6, 000 LIFO Cost of goods sold Ending inventory Perpetual Old cost Recent cost < > Periodic Recent cost Old cost LIFO perpetual applies "Last-in First-out" during the period. LIFO periodic applies "Last-in First-out" at the end of period. Cost of goods sold Ending inventory $ $ $ $ 11, 000 12, 400 11, 000 13, 600 8, 600 7, 200 8, 600 6, 000

Moving average, Perpetual Date May 1 May 3 May 8 May 15 May 19 May 25 May 27 May 31 Units Purchased Transactions Beginning Inventory Purchase Sale (*1) Purchase Sale (*2) Sale (*3) Units sold Unit Cost $ 700 12. 00 ? ? $ 400 1, 600 May 1 May 3 May 8 May 15 May 19 May 25 May 27 May 31 Transactions Beginning Inventory Purchase Sale (*1) Purchase Sale (*2) Sale (*3) Total Purchases $ $ 1, 000 7, 000 1, 200 $ $ 14. 00 $ 8, 400 3, 000 $ Moving Cost of average unit goods sold cost $ 10. 00 $ 10. 25 $ 5, 125 $ 12. 75 $ 13. 16 $ 5, 264 $ 13. 16 $ 1, 316 $ 13. 16 19, 600 $ 11, 705 Ending inventory Cost of ending inventory = Beginning inventory + Cost of purchases - Cost of goods sold = $7, 000 + (100 x$12 + 600 x$14 + 200 x$15) - $11, 705 = $7, 000 + $12, 600 - $11, 705 = $7, 895 [Checking] Quantity of ending inventory = Beginning inventory + Units purchased - Units sold = 700 + 900 - 1, 000 = 600 units $ 7, 895 15. 00 ? ? ? Weighted average, Periodic Date 700 800 300 900 1, 100 700 600 10. 00 $ 500 600 200 Total Inventory Units Purchased Units sold Unit Cost $ $ 700 100 500 $ $ 600 200 400 1, 600 1, 000 10. 00 12. 00 ? ? 14. 00 15. 00 ? ? Inventory Units 700 800 300 900 1, 100 700 600 Purchases $ $ 7, 000 1, 200 $ $ 8, 400 3, 000 $ 19, 600 Weighted average unit cost = (700 x$10 + 100 x$12 + 600 x$14 + 200 x$15) / (700+100+600+200) Weighted Cost of Ending average unit goods sold inventory cost $ $ $ $ 12. 25 12. 25 $ 4, 900 1, 225 $ 7, 350 $ 12, 250 Cost of ending inventory = 600 x $12. 25 = $7, 350 [Checking] Cost of ending inventory = Beginning inventory + Purchases - Cost of Goods Sold = $7, 000 + (100 x$12 + 600 x$14 + 200 x$15) - $12, 250 = $7, 000 + $12, 600 - $12, 250 = $7, 350 6, 125 $ $ Cost of ending inventory = 600 x $13. 16 (Moving Average cost per unit as of May 31) = $7, 896 - $7, 895 = $1 (rounding error) $ 7, 350

§ Firms often adopt the LIFO approach for the tax benefits during periods of high inflation. § Studies indicate that firms with the following characteristics are more likely to adopt LIFO - rising prices for raw materials and labor, more variable inventory growth, an absence of other tax loss carry forwards, and large size. When firms switch from FIFO to LIFO in valuing inventory, there is likely to be a drop in net income and a concurrent increase in cash flows (because of the tax savings). The reverse will apply when firms switch from LIFO to FIFO. § Moving averaging approach is considered to yield a safe and conservative approach to reporting financial results. § Manufacturers of all types rely upon the weighted average costing methods because inventories either are stockpiled or intermingled so that it is difficult to differentiate between older and newer goods.

§ In certain business operations, taking a physical inventory is impossible or impractical. In such a situation, it is necessary to estimate the inventory cost.

§ This method might be used to estimate inventory on hand for purposes of preparing monthly or quarterly financial statements, and certainly would come into play if a fire or other catastrophe destroyed the inventory. § Assume that Tiki’s inventory was destroyed by fire. Sales for the year, prior to the date of the fire were $1, 000, and Tiki usually sells goods at a 40% gross profit rate. Therefore, Tiki can readily estimate that cost of goods sold was $600, 000. Tiki’s beginning of year inventory was $500, 000, and $800, 000 in purchases had occurred prior to the date of the fire. The inventory destroyed by fire can be estimated via the gross profit method, as shown.

§ A method that is widely used by merchandising firms to value or estimate ending inventory. § This method would only work where a category of inventory has a consistent mark-up. § The cost-to-retail percentage is multiplied times ending inventory at retail. § Ending inventory at retail can be determined by a physical count of goods on hand, at their retail value. Or, sales might be subtracted from goods available for sale at retail. § Crock Buster sells pots that cost $7. 50 for $10. The beginning inventory totaled $200, 000 (at cost), purchases were $300, 000 (at cost), and sales totaled $460, 000 (at retail).

Objective of IAS 36: - Ensure that assets are carried at no more than their recoverable amount - Define how the recoverable amount is determined
 - Financial")
Assets that IAS 36 does not apply to: - Inventories (IAS 2) - Financial assets (IFRS 9) - Deferred tax (IAS 12) - Employee benefits (IAS 19) - Construction Contracts (IAS 11) - Investment property at fair value (IAS 40) - Agricultural assets at fair value (IAS 41) - Insurance contracts (IFRS 4) - Non-current assets held for sale (IFRS 5) Assets that IAS 36 apply to: - Land, buildings and machinery (IAS 16) - Investment property and cost (IAS 40) - Intangible assets (IAS 38) Goodwill - Subsidiaries, associates and joint venture cost

Impairment describes a permanent reduction in the value of a company's assets. An Asset is impaired when its carrying amount exceeds its recoverable amount.

WHAT DOES IMPAIRMENT STAND FOR? → Carrying amount: Asset which is recognized after deducting any accumulated depreciation → Recoverable amount: fair value cost to sell an asset Carrying amount – Recoverable amount = Impairment loss
 → indication for impairment +")
1. End of reporting period (stated in Balance Sheet) → indication for impairment + 2. Intangible assets with indefinite useful life → entity must do annual test for impairment + 3. Goodwill acquired in combination → annual test for impairment

External Sources Internal Sources - decline in market value - obsolescence /physical damage of an asset - significant changes (market, technology, legal, economic) - entity changes (e. g. restructuring) - increase in market interest rates (on return on investments / ROI) - internal reporting evidence (that an asset will perform worse than expected)

Thank You
Inventories.pptx