

Условия и продукты мантийногомагматизма.pptx
- Количество слайдов: 59
 Условия и продукты мантийного магматизма Илья Векслер лекция в ПГНИУ, 8 октября 2013
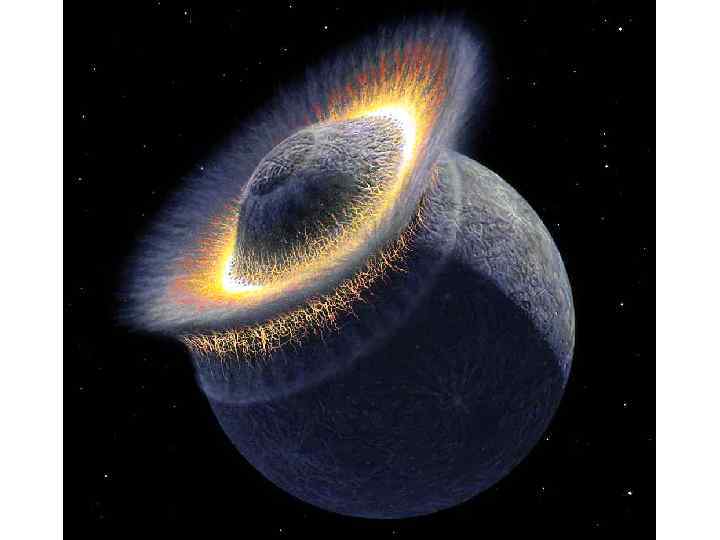
 Core and mantle
 u Low Velocity") The Earth’s mantle Upper mantle to 410 km (olivine → spinel) u Low Velocity Layer 60 -220 km Transition Zone as velocity increases ~ rapidly u 660 km (spinel → perovskite-type) Si. IV → Si. VI Lower Mantle has more gradual velocity increase
The Earth’s mantle Upper mantle to 410 km (olivine → spinel) u Low Velocity Layer 60 -220 km Transition Zone as velocity increases ~ rapidly u 660 km (spinel → perovskite-type) Si. IV → Si. VI Lower Mantle has more gradual velocity increase
 The Earth’s core Fe-Ni metallic alloy Outer Core is liquid u No S-waves Inner Core is solid
 Variation in P and S wave velocities with depth. Compositional subdivisions of the Earth are on the left, rheological subdivisions on the right. After Kearey & Vine (1990).
 Where does the heat come from?
 Sources of internal heat v Residual heat from accretion ~ 65% v Heat from radioactive decay ~ 35% v Tidal heat - not important In the centre of the Earth T can be up to 6000 °C
 The main heat-producing isotopes 44. 3% 39. 4% 14. 6% 1. 7% 40 K 232 Th 238 U 235 U 3 b. y. ago heat production was 2 times greater
 Mechanisms of heat transfer v Radiation v Conduction v Convection
 The geothermal gradient Diagrammatic cross-section through the upper 200 -300 km of the Earth
 The geothermal gradient Estimate of the geothermal gradient to the center of the Earth (after Stacey, 1992).
 Heat flow The mean heat flux from the interior of the Earth is 87 m. Wm− 2, for a global heat loss of 4. 42 × 1013 W Global heat flux variations (Pollack et al. , 1993) Cross-section of the mantle based on a seismic tomography model. (Li & Romanowicz, 1996).
 Thermal structure in a 3 D spherical mantle convection model (red is hot, blue is cold). J. H. Davies and H. -Peter Bunge http: //www. ocean. cf. ac. uk/people/huw/AGU 99/mantlecirc. html
 The pressure gradient v. P increases = rgh v. Nearly linear through mantle ~ 0. 03 GPa/km v. Core: r increases more rapidly since alloy more dense Dziewonski & Anderson (1981)
 Bulk Earth’s mantle Al Ca S Ni 1. 41 2. 9 1. 8 1. 54 Fe 5. 8 O 30. 1 Fe 32. 1 Mg 13. 9 Si 15. 1 Mg 22. 8 Al Ca 2. 2 2. 3 Si 21. 5 O 44. 8
 composition (wt. %) Ringwood (1975) Si. O 2 Mg. O Fe.") Upper mantle (“Pyrolite”) composition (wt. %) Ringwood (1975) Si. O 2 Mg. O Fe. O Al 2 O 3 Ca. O Na 2 O K 2 O Sum 45. 0 37. 8 8. 05 4. 45 3. 55 0. 36 0. 03 99. 24 Mineral assemblage Olivine Orthopyroxene Clinopyroxene Garnet 57. 9 13. 5 16. 3 12. 3
Upper mantle (“Pyrolite”) composition (wt. %) Ringwood (1975) Si. O 2 Mg. O Fe. O Al 2 O 3 Ca. O Na 2 O K 2 O Sum 45. 0 37. 8 8. 05 4. 45 3. 55 0. 36 0. 03 99. 24 Mineral assemblage Olivine Orthopyroxene Clinopyroxene Garnet 57. 9 13. 5 16. 3 12. 3
.") Products of mantle melting After Kushiro (2001).
Products of mantle melting After Kushiro (2001).
 Spider diagram for oceanic basalts increasing incompatibility
. Igneous Petrogenesis.") Nd and Sr isotopes of ocean basalts From Wilson (1989). Igneous Petrogenesis.
Nd and Sr isotopes of ocean basalts From Wilson (1989). Igneous Petrogenesis.
 Phase diagram for 4 -phase lherzolite
 Increase the temperature") How does the mantle melt ? 1) Increase the temperature
How does the mantle melt ? 1) Increase the temperature
 Lower the pressure – Adiabatic rise of mantle with no conductive heat loss") 2) Lower the pressure – Adiabatic rise of mantle with no conductive heat loss – Decompression partial melting could melt at least 30%
2) Lower the pressure – Adiabatic rise of mantle with no conductive heat loss – Decompression partial melting could melt at least 30%
 Add volatiles (especially H 2 O)") 3) Add volatiles (especially H 2 O)
3) Add volatiles (especially H 2 O)
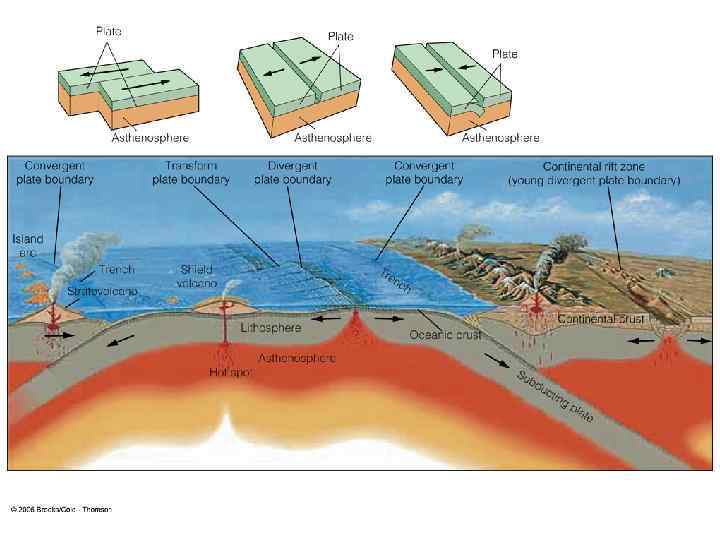
 Magmatism at divergent margins
 Mid-ocean ridges
 Deep sea drilling
 Oceanic Crust and Upper Mantle Structure Typical Ophiolite Figure 13. 4. Lithology and thickness of a typical ophiolite sequence, based on the Samial Ophiolite in Oman. After Boudier and Nicolas (1985) Earth Planet. Sci. Lett. , 76, 84 -92.
") Mantle melting model After Langmuir et al. (1992)
Mantle melting model After Langmuir et al. (1992)
 A modern concept of the axial magma chamber beneath a fastspreading ridge After Perfit et al. (1994)
 Model for magma chamber beneath a slow-spreading ridge, such as the Mid-Atlantic Ridge v Dike-like mush zone and a smaller transition zone beneath well-developed rift valley v Most of body well below the liquidus temperature, so convection and mixing is far less likely than at fast ridges Depth (km) 2 After Sinton and Detrick (1992) Rift Valley 4 6 Moho Transition zone Gabbro Mush 8 10 5 0 Distance (km) 5 10
 Global MORB production: 14 kg/y ~10
 Magmatism at convergent margins
 Subduction zones
 Convergence") Typical thermal model for a subduction zone Temperature will be higher if a) Convergence rate is slower b) Subducted slab is young and near the ridge (warmer) c) Arc is young (< 50 -100 Ma)
Typical thermal model for a subduction zone Temperature will be higher if a) Convergence rate is slower b) Subducted slab is young and near the ridge (warmer) c) Arc is young (< 50 -100 Ma)
 The principal source components of IA magmas 1. Crustal portion of the subducted slab 2. Mantle wedge between slab and arc crust 3. Arc crust 4. Lithospheric mantle of subducting plate 5. Asthenosphere beneath slab
 Island arc petrogenesis
 Volcanic Rocks of Island Arcs • Complex tectonic situation and broad spectrum of volcanic products • High proportion of basaltic andesite – Most andesites occur in subduction zone settings Basalts are still very common and important!
 Continental arc magmatism
 Continental Arc Magmatism
 Intraplate magmatism
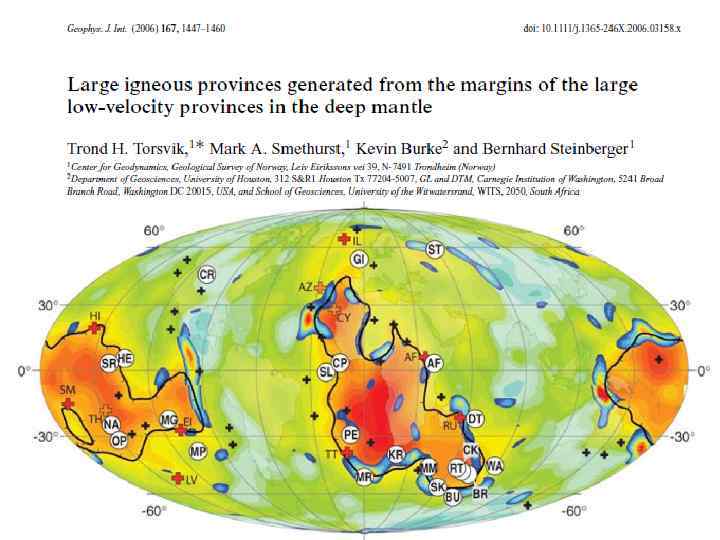
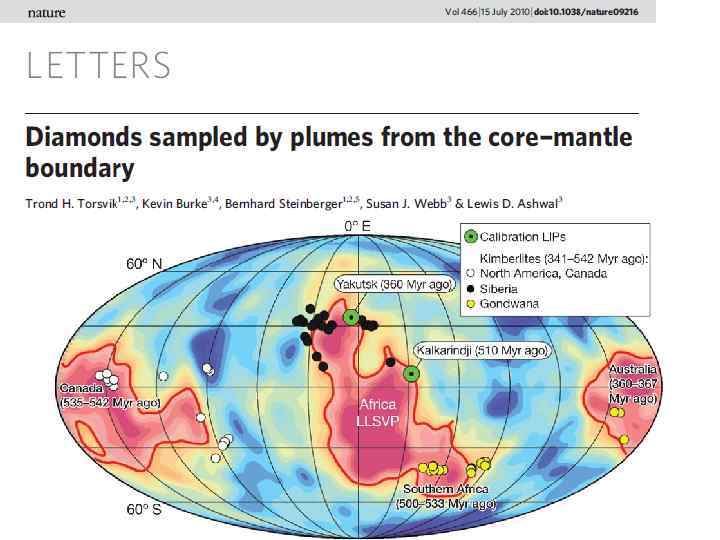
") Large Igneous Provinces (LIPs)
Large Igneous Provinces (LIPs)
 Model of the plate movement
 with selected more recent") Ocean islands and seamounts Hotspots and trails from Crough (1983) with selected more recent hotspots from Anderson and Schramm (2005). Also shown are the geoid anomaly contours of Crough and Jurdy (1980, in meters).
Ocean islands and seamounts Hotspots and trails from Crough (1983) with selected more recent hotspots from Anderson and Schramm (2005). Also shown are the geoid anomaly contours of Crough and Jurdy (1980, in meters).
.") Flood basalt provinces of Gondwanaland prior to break-up and separation. After Cox (1978).
Flood basalt provinces of Gondwanaland prior to break-up and separation. After Cox (1978).
 Relationship of the Etendeka and Paraná large igneous provinces to the Tristan hot spot. After Wilson (1989).
 Etendeka: basalts and rhyolites
 Etendeka: dyke swarms
 Etendeka: granitic intrusions
 Tristan da Cunha
 Tristan da Cunha
") Various mantle convection models After Tackley (2000)
Various mantle convection models After Tackley (2000)
 A schematic crosssection through the Earth showing the three types of proposed by Courtillot et al. (2003). (1) “Primary” plumes, rising from the D" layer at the coremantle boundary (2) “Superplumes” are broader and less concentrated, and stall at the 660 -km transition zone where the spawn a series of “secondary” plumes. (3) “Tertiary” hotspots have a superficial origin.
 Melting at convergent plate margins (mid-ocean ridges) Ø Mechanism: decompression Ø Degree") Summary (I) Melting at convergent plate margins (mid-ocean ridges) Ø Mechanism: decompression Ø Degree of melting: high Ø Source: depleted upper mantle Ø Products: olivne tholeiitic basalts, narrow range of compositions
Summary (I) Melting at convergent plate margins (mid-ocean ridges) Ø Mechanism: decompression Ø Degree of melting: high Ø Source: depleted upper mantle Ø Products: olivne tholeiitic basalts, narrow range of compositions
 Melting at divergent plate margins (subduction zones) Ø Mechanism: wet melting Ø") Summary (II) Melting at divergent plate margins (subduction zones) Ø Mechanism: wet melting Ø Degree of melting: high Ø Source: crust and mantle wedge Ø Products: boninites, tholeiitic basalts, andesites, rhyolites
Summary (II) Melting at divergent plate margins (subduction zones) Ø Mechanism: wet melting Ø Degree of melting: high Ø Source: crust and mantle wedge Ø Products: boninites, tholeiitic basalts, andesites, rhyolites
 Intraplate melting (continental rifts, ocean islands, LIPs) Ø Mechanism: rising plumes from") Summary (III) Intraplate melting (continental rifts, ocean islands, LIPs) Ø Mechanism: rising plumes from deep mantle Ø Degree of melting: variable, often low Ø Source: lower mantle, upper mantle, crust Ø Products: alkaline and tholeiitic basalts, rhyolites, foidites, kimberlites, carbonatites, etc.
Summary (III) Intraplate melting (continental rifts, ocean islands, LIPs) Ø Mechanism: rising plumes from deep mantle Ø Degree of melting: variable, often low Ø Source: lower mantle, upper mantle, crust Ø Products: alkaline and tholeiitic basalts, rhyolites, foidites, kimberlites, carbonatites, etc.