8eee581c1ce3f922e9bbb5dbb623d535.ppt
- Количество слайдов: 74
 Using TAU Performance Technology in ESMF Sameer Shende, Nancy Collins University of Oregon, UCAR sameer@cs. uoregon. edu, nancy@ucar. edu
 Outline r r Motivation Part I: Overview of TAU ¦ Instrumentation Options Ø PDT Ø MPI Ø CCA ¦ r r r Measurement Options Part II: Performance Analysis and Visualization with TAU Part III: Case Study: Using TAU with ESMF Conclusion Using TAU Performance Technology in ESMF 2 ESMF Team Meeting July 14, 2004
 TAU Performance System Framework r r r Tuning and Analysis Utilities Performance system framework for scalable parallel and distributed highperformance computing Targets a general complex system computation model ¦ nodes / contexts / threads ¦ Multi-level: system / software / parallelism ¦ Measurement and analysis abstraction Integrated toolkit for performance instrumentation, measurement, analysis, and visualization ¦ Portable, configurable performance profiling/tracing facility ¦ Open software approach University of Oregon, LANL, FZJ Germany http: //www. cs. uoregon. edu/research/paracomp/tau Using TAU Performance Technology in ESMF 3 ESMF Team Meeting July 14, 2004
 TAU Performance Systems Goals r Multi-level performance instrumentation ¦ r r Flexible and configurable performance measurement Widely-ported parallel performance profiling system ¦ ¦ r r r Computer system architectures and operating systems Different programming languages and compilers Support for multiple parallel programming paradigms ¦ r Multi-language automatic source instrumentation Multi-threading, message passing, mixed-mode, hybrid Support for performance mapping Support for object-oriented and generic programming Integration in complex software systems and applications Using TAU Performance Technology in ESMF 4 ESMF Team Meeting July 14, 2004
 Definitions – Profiling r Profiling ¦ Recording of summary information during execution Ø inclusive, ¦ exclusive time, # calls, hardware statistics, … Reflects performance behavior of program entities Ø functions, loops, basic blocks Ø user-defined “semantic” entities ¦ ¦ ¦ Very good for low-cost performance assessment Helps to expose performance bottlenecks and hotspots Implemented through Ø sampling: periodic OS interrupts or hardware counter traps Ø instrumentation: direct insertion of measurement code Using TAU Performance Technology in ESMF 5 ESMF Team Meeting July 14, 2004
 Definitions – Tracing r Tracing ¦ Recording of information about significant points (events) during program execution Ø entering/exiting code region (function, loop, block, …) Ø thread/process interactions (e. g. , send/receive message) ¦ Save information in event record Ø timestamp Ø CPU identifier, thread identifier Ø Event type and event-specific information ¦ ¦ ¦ Event trace is a time-sequenced stream of event records Can be used to reconstruct dynamic program behavior Typically requires code instrumentation Using TAU Performance Technology in ESMF 6 ESMF Team Meeting July 14, 2004
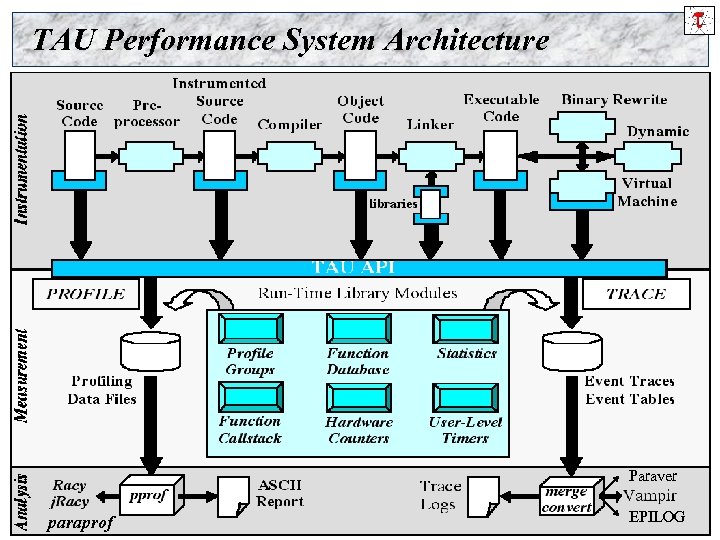 TAU Performance System Architecture Paraver paraprof Using TAU Performance Technology in ESMF 7 EPILOG ESMF Team Meeting July 14, 2004
 Strategies for Empirical Performance Evaluation r Empirical performance evaluation as a series of performance experiments ¦ ¦ Experiment trials describing instrumentation and measurement requirements Where/When/How axes of empirical performance space Ø where are performance measurements made in program l routines, loops, statements… Ø when is performance instrumentation done l compile-time, while pre-processing, runtime… Ø how are performance measurement/instrumentation options chosen l profiling with hw counters, tracing, callpath profiling… Using TAU Performance Technology in ESMF 8 ESMF Team Meeting July 14, 2004
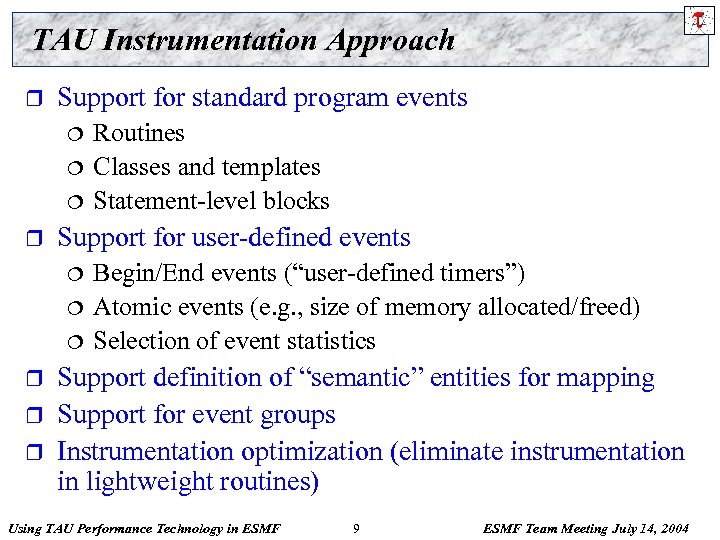 TAU Instrumentation Approach r Support for standard program events ¦ ¦ ¦ r Support for user-defined events ¦ ¦ ¦ r r r Routines Classes and templates Statement-level blocks Begin/End events (“user-defined timers”) Atomic events (e. g. , size of memory allocated/freed) Selection of event statistics Support definition of “semantic” entities for mapping Support for event groups Instrumentation optimization (eliminate instrumentation in lightweight routines) Using TAU Performance Technology in ESMF 9 ESMF Team Meeting July 14, 2004
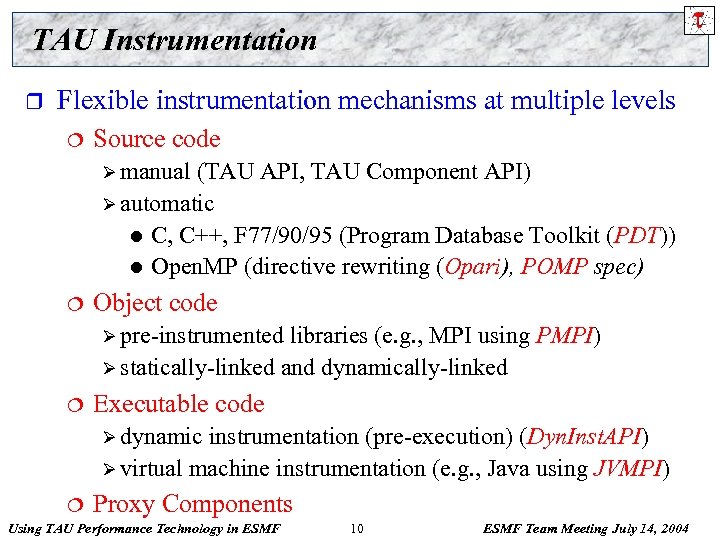 TAU Instrumentation r Flexible instrumentation mechanisms at multiple levels ¦ Source code Ø manual (TAU API, TAU Component API) Ø automatic l C, C++, F 77/90/95 (Program Database Toolkit (PDT)) l Open. MP (directive rewriting (Opari), POMP spec) ¦ Object code Ø pre-instrumented libraries (e. g. , MPI using PMPI) Ø statically-linked and dynamically-linked ¦ Executable code Ø dynamic instrumentation (pre-execution) (Dyn. Inst. API) Ø virtual machine instrumentation (e. g. , Java using JVMPI) ¦ Proxy Components Using TAU Performance Technology in ESMF 10 ESMF Team Meeting July 14, 2004
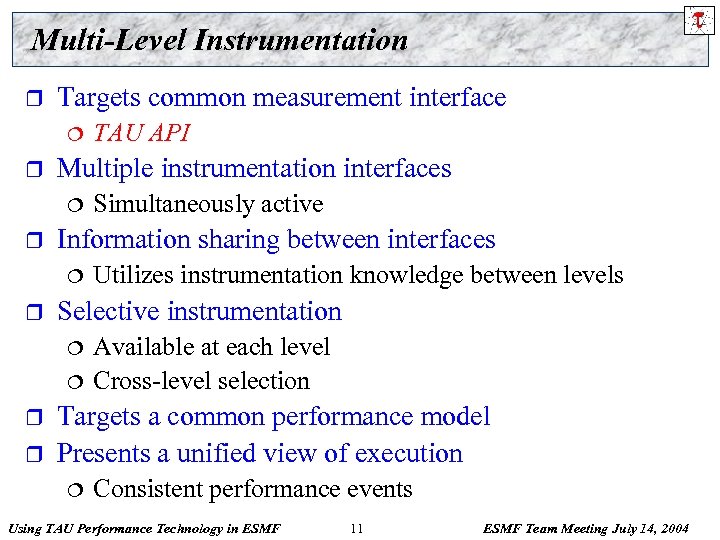 Multi-Level Instrumentation r Targets common measurement interface ¦ r Multiple instrumentation interfaces ¦ r Utilizes instrumentation knowledge between levels Selective instrumentation ¦ r Simultaneously active Information sharing between interfaces ¦ r TAU API Available at each level Cross-level selection Targets a common performance model Presents a unified view of execution ¦ Consistent performance events Using TAU Performance Technology in ESMF 11 ESMF Team Meeting July 14, 2004
![Using TAU r Install TAU % configure [options] ; make clean install r Instrument Using TAU r Install TAU % configure [options] ; make clean install r Instrument](https://present5.com/presentation/8eee581c1ce3f922e9bbb5dbb623d535/image-12.jpg) Using TAU r Install TAU % configure [options] ; make clean install r Instrument application ¦ r Typically modify application makefile ¦ r include TAU’s stub makefile, modify variables Set environment variables ¦ r TAU Profiling API directory where profiles/traces are to be stored Execute application % mpirun –np
Using TAU r Install TAU % configure [options] ; make clean install r Instrument application ¦ r Typically modify application makefile ¦ r include TAU’s stub makefile, modify variables Set environment variables ¦ r TAU Profiling API directory where profiles/traces are to be stored Execute application % mpirun –np
![Compiling % configure [options] % make clean install Creates <arch>/lib/Makefile. tau<options> stub Makefile and Compiling % configure [options] % make clean install Creates <arch>/lib/Makefile. tau<options> stub Makefile and](https://present5.com/presentation/8eee581c1ce3f922e9bbb5dbb623d535/image-13.jpg) Compiling % configure [options] % make clean install Creates
Compiling % configure [options] % make clean install Creates
![TAU Measurement System Configuration r configure [OPTIONS] ¦ ¦ ¦ {-c++=<CC>, -cc=<cc>} Specify C++ TAU Measurement System Configuration r configure [OPTIONS] ¦ ¦ ¦ {-c++=<CC>, -cc=<cc>} Specify C++](https://present5.com/presentation/8eee581c1ce3f922e9bbb5dbb623d535/image-14.jpg) TAU Measurement System Configuration r configure [OPTIONS] ¦ ¦ ¦ {-c++=
TAU Measurement System Configuration r configure [OPTIONS] ¦ ¦ ¦ {-c++=
![TAU Measurement System Configuration r configure [OPTIONS] ¦ ¦ ¦ ¦ ¦ -TRACE Generate TAU Measurement System Configuration r configure [OPTIONS] ¦ ¦ ¦ ¦ ¦ -TRACE Generate](https://present5.com/presentation/8eee581c1ce3f922e9bbb5dbb623d535/image-15.jpg) TAU Measurement System Configuration r configure [OPTIONS] ¦ ¦ ¦ ¦ ¦ -TRACE Generate binary TAU traces -PROFILE (default) Generate profiles (summary) -PROFILECALLPATH Generate call path profiles -PROFILESTATS Generate std. dev. statistics -MULTIPLECOUNTERS Measure one/more metric -CPUTIME Use usertime+system time -PAPIWALLCLOCK Use PAPI’s wallclock time -PAPIVIRTUAL Use PAPI’s process virtual time -COMPENSATE Use perturbation compensation -LINUXTIMERS Use fast x 86 Linux timers Using TAU Performance Technology in ESMF 15 ESMF Team Meeting July 14, 2004
TAU Measurement System Configuration r configure [OPTIONS] ¦ ¦ ¦ ¦ ¦ -TRACE Generate binary TAU traces -PROFILE (default) Generate profiles (summary) -PROFILECALLPATH Generate call path profiles -PROFILESTATS Generate std. dev. statistics -MULTIPLECOUNTERS Measure one/more metric -CPUTIME Use usertime+system time -PAPIWALLCLOCK Use PAPI’s wallclock time -PAPIVIRTUAL Use PAPI’s process virtual time -COMPENSATE Use perturbation compensation -LINUXTIMERS Use fast x 86 Linux timers Using TAU Performance Technology in ESMF 15 ESMF Team Meeting July 14, 2004
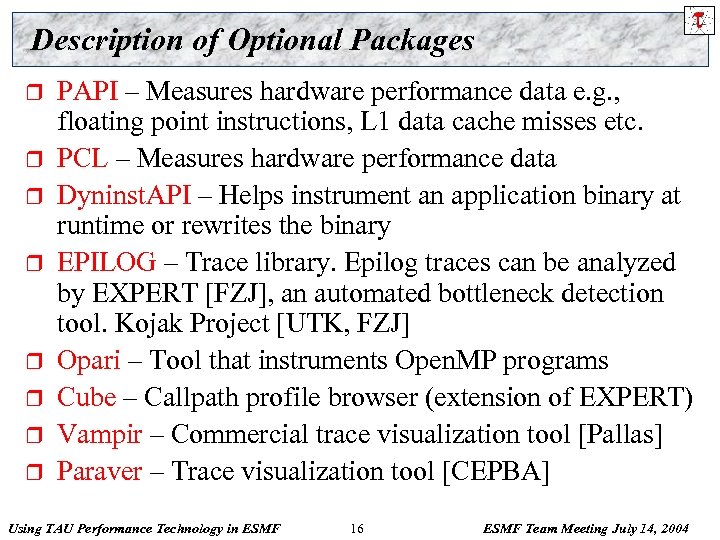 Description of Optional Packages r r r r PAPI – Measures hardware performance data e. g. , floating point instructions, L 1 data cache misses etc. PCL – Measures hardware performance data Dyninst. API – Helps instrument an application binary at runtime or rewrites the binary EPILOG – Trace library. Epilog traces can be analyzed by EXPERT [FZJ], an automated bottleneck detection tool. Kojak Project [UTK, FZJ] Opari – Tool that instruments Open. MP programs Cube – Callpath profile browser (extension of EXPERT) Vampir – Commercial trace visualization tool [Pallas] Paraver – Trace visualization tool [CEPBA] Using TAU Performance Technology in ESMF 16 ESMF Team Meeting July 14, 2004
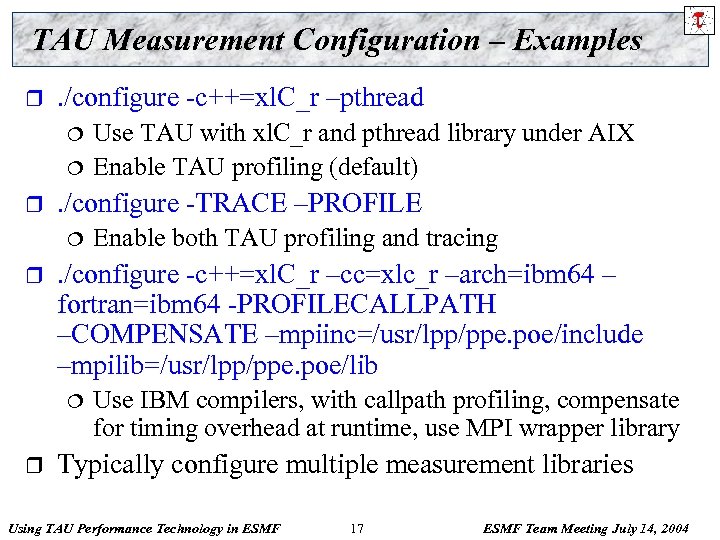 TAU Measurement Configuration – Examples r . /configure -c++=xl. C_r –pthread ¦ ¦ r . /configure -TRACE –PROFILE ¦ r Enable both TAU profiling and tracing . /configure -c++=xl. C_r –cc=xlc_r –arch=ibm 64 – fortran=ibm 64 -PROFILECALLPATH –COMPENSATE –mpiinc=/usr/lpp/ppe. poe/include –mpilib=/usr/lpp/ppe. poe/lib ¦ r Use TAU with xl. C_r and pthread library under AIX Enable TAU profiling (default) Use IBM compilers, with callpath profiling, compensate for timing overhead at runtime, use MPI wrapper library Typically configure multiple measurement libraries Using TAU Performance Technology in ESMF 17 ESMF Team Meeting July 14, 2004
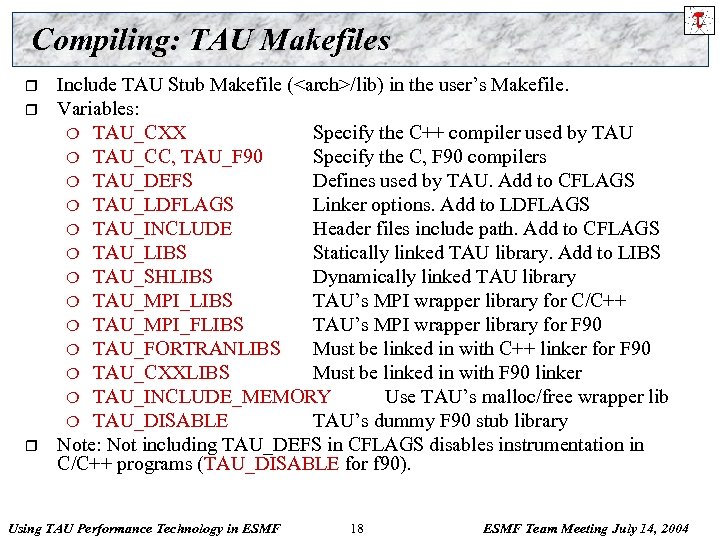 Compiling: TAU Makefiles r r r Include TAU Stub Makefile (
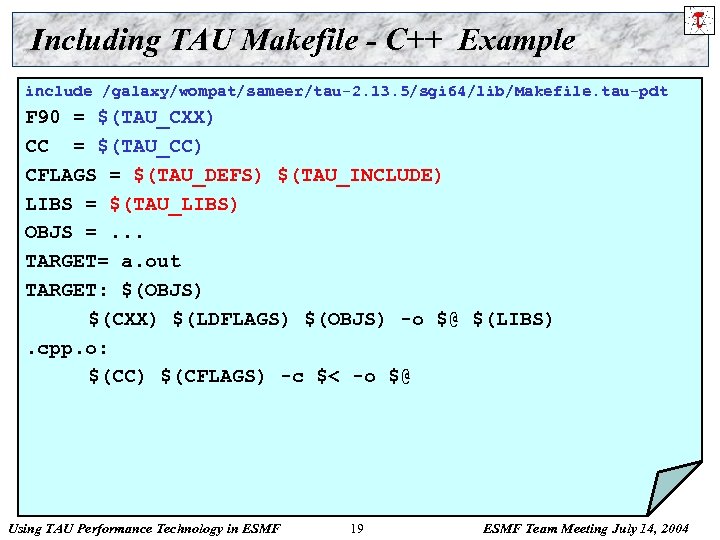 Including TAU Makefile - C++ Example include /galaxy/wompat/sameer/tau-2. 13. 5/sgi 64/lib/Makefile. tau-pdt F 90 = $(TAU_CXX) CC = $(TAU_CC) CFLAGS = $(TAU_DEFS) $(TAU_INCLUDE) LIBS = $(TAU_LIBS) OBJS =. . . TARGET= a. out TARGET: $(OBJS) $(CXX) $(LDFLAGS) $(OBJS) -o $@ $(LIBS). cpp. o: $(CC) $(CFLAGS) -c $< -o $@ Using TAU Performance Technology in ESMF 19 ESMF Team Meeting July 14, 2004
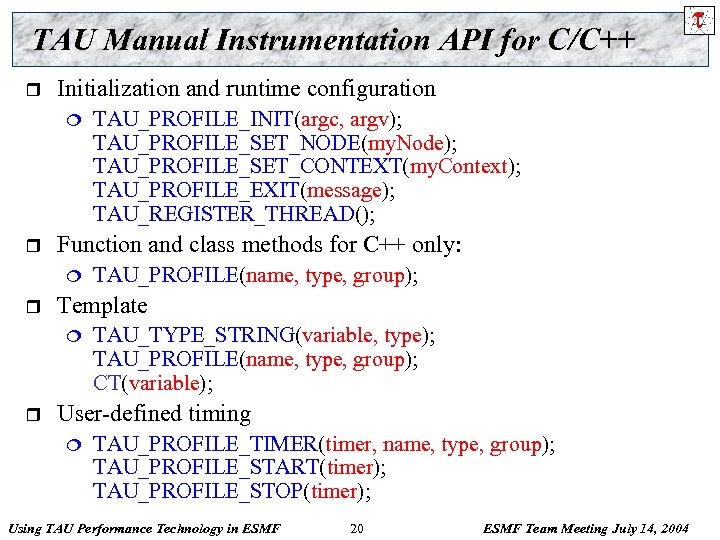 TAU Manual Instrumentation API for C/C++ r Initialization and runtime configuration ¦ r Function and class methods for C++ only: ¦ r TAU_PROFILE(name, type, group); Template ¦ r TAU_PROFILE_INIT(argc, argv); TAU_PROFILE_SET_NODE(my. Node); TAU_PROFILE_SET_CONTEXT(my. Context); TAU_PROFILE_EXIT(message); TAU_REGISTER_THREAD(); TAU_TYPE_STRING(variable, type); TAU_PROFILE(name, type, group); CT(variable); User-defined timing ¦ TAU_PROFILE_TIMER(timer, name, type, group); TAU_PROFILE_START(timer); TAU_PROFILE_STOP(timer); Using TAU Performance Technology in ESMF 20 ESMF Team Meeting July 14, 2004
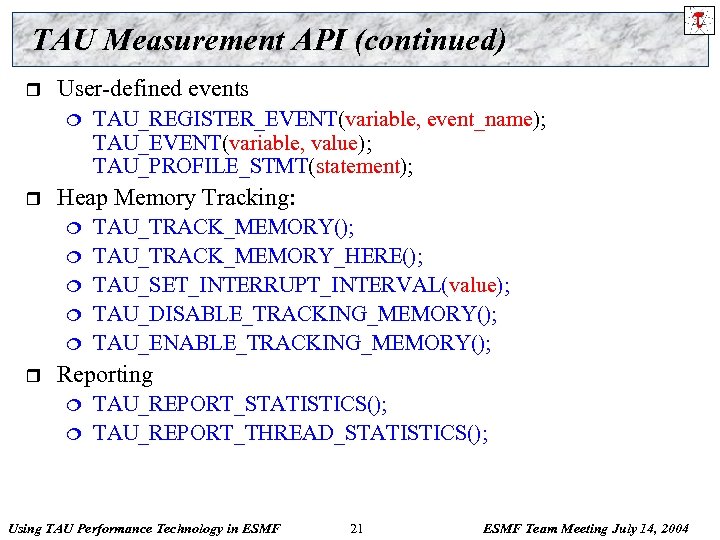 TAU Measurement API (continued) r User-defined events ¦ r Heap Memory Tracking: ¦ ¦ ¦ r TAU_REGISTER_EVENT(variable, event_name); TAU_EVENT(variable, value); TAU_PROFILE_STMT(statement); TAU_TRACK_MEMORY(); TAU_TRACK_MEMORY_HERE(); TAU_SET_INTERRUPT_INTERVAL(value); TAU_DISABLE_TRACKING_MEMORY(); TAU_ENABLE_TRACKING_MEMORY(); Reporting ¦ ¦ TAU_REPORT_STATISTICS(); TAU_REPORT_THREAD_STATISTICS(); Using TAU Performance Technology in ESMF 21 ESMF Team Meeting July 14, 2004
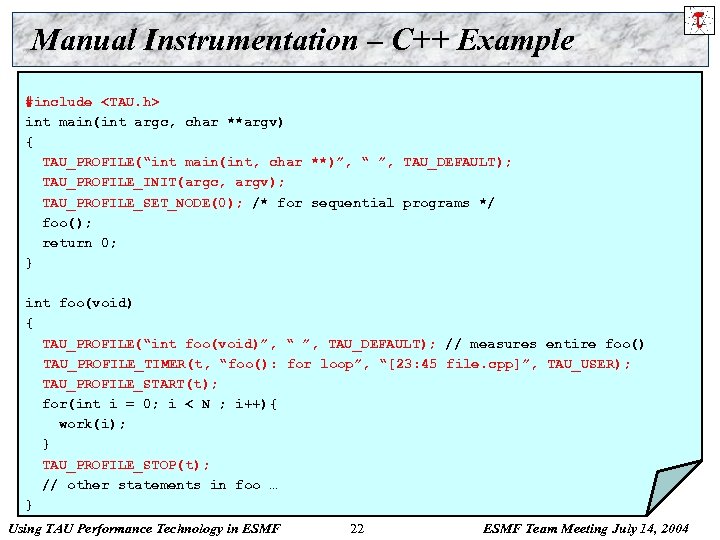 Manual Instrumentation – C++ Example #include
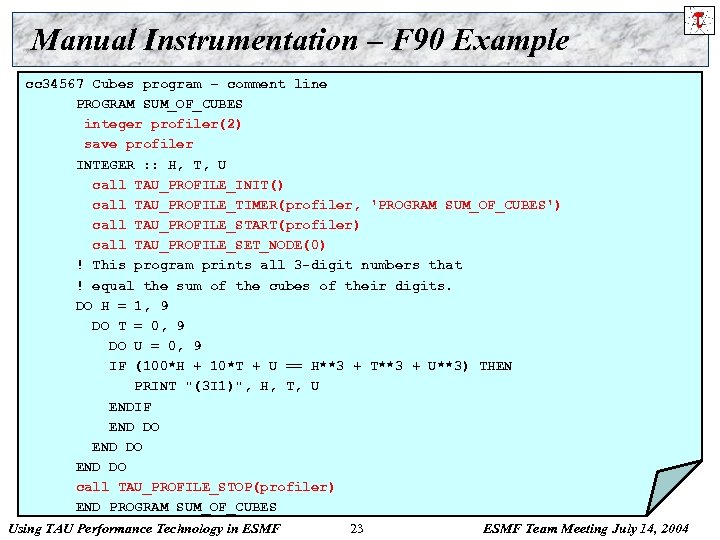 Manual Instrumentation – F 90 Example cc 34567 Cubes program – comment line PROGRAM SUM_OF_CUBES integer profiler(2) save profiler INTEGER : : H, T, U call TAU_PROFILE_INIT() call TAU_PROFILE_TIMER(profiler, 'PROGRAM SUM_OF_CUBES') call TAU_PROFILE_START(profiler) call TAU_PROFILE_SET_NODE(0) ! This program prints all 3 -digit numbers that ! equal the sum of the cubes of their digits. DO H = 1, 9 DO T = 0, 9 DO U = 0, 9 IF (100*H + 10*T + U == H**3 + T**3 + U**3) THEN PRINT "(3 I 1)", H, T, U ENDIF END DO call TAU_PROFILE_STOP(profiler) END PROGRAM SUM_OF_CUBES Using TAU Performance Technology in ESMF 23 ESMF Team Meeting July 14, 2004
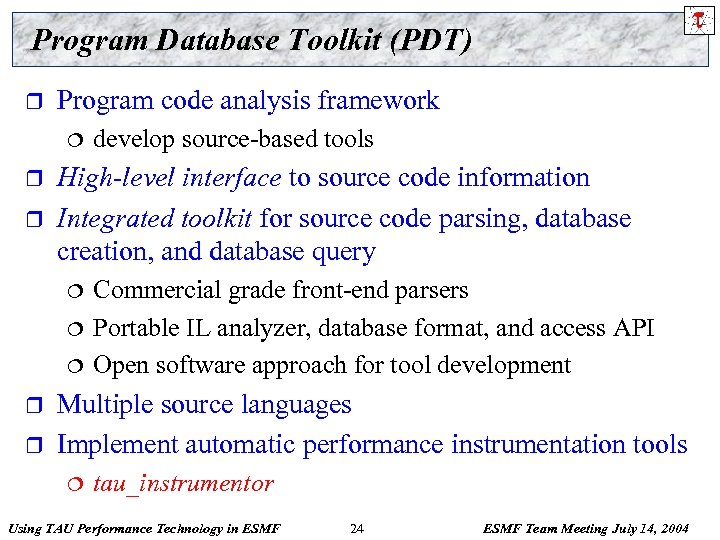 Program Database Toolkit (PDT) r Program code analysis framework ¦ r r High-level interface to source code information Integrated toolkit for source code parsing, database creation, and database query ¦ ¦ ¦ r r develop source-based tools Commercial grade front-end parsers Portable IL analyzer, database format, and access API Open software approach for tool development Multiple source languages Implement automatic performance instrumentation tools ¦ tau_instrumentor Using TAU Performance Technology in ESMF 24 ESMF Team Meeting July 14, 2004
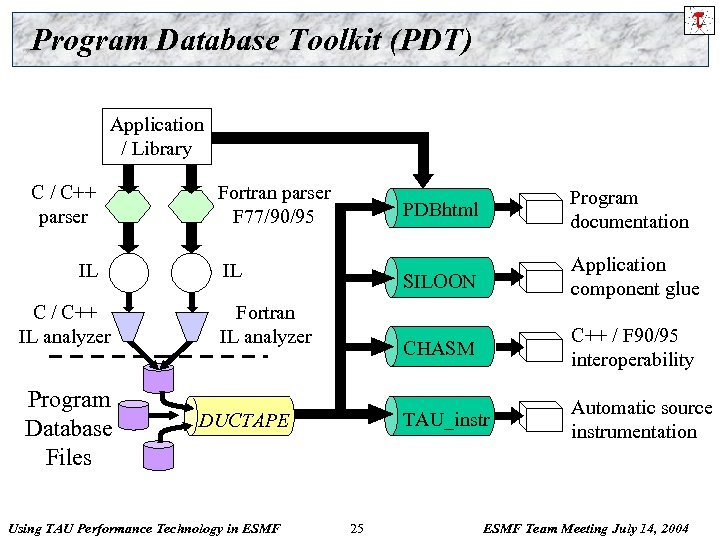 Program Database Toolkit (PDT) Application / Library C / C++ parser IL C / C++ IL analyzer Program Database Files Fortran parser F 77/90/95 PDBhtml SILOON DUCTAPE Using TAU Performance Technology in ESMF 25 C++ / F 90/95 interoperability TAU_instr Fortran IL analyzer Application component glue CHASM IL Program documentation Automatic source instrumentation ESMF Team Meeting July 14, 2004
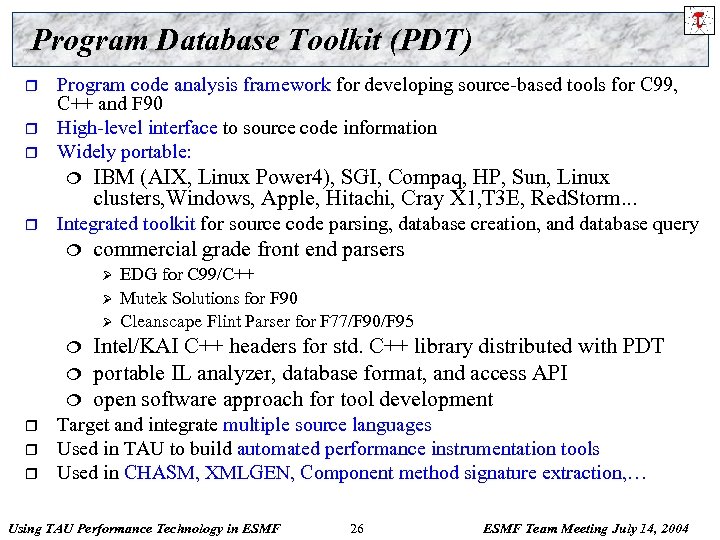 Program Database Toolkit (PDT) r r r Program code analysis framework for developing source-based tools for C 99, C++ and F 90 High-level interface to source code information Widely portable: ¦ r IBM (AIX, Linux Power 4), SGI, Compaq, HP, Sun, Linux clusters, Windows, Apple, Hitachi, Cray X 1, T 3 E, Red. Storm. . . Integrated toolkit for source code parsing, database creation, and database query ¦ commercial grade front end parsers Ø Ø Ø ¦ ¦ ¦ r r r EDG for C 99/C++ Mutek Solutions for F 90 Cleanscape Flint Parser for F 77/F 90/F 95 Intel/KAI C++ headers for std. C++ library distributed with PDT portable IL analyzer, database format, and access API open software approach for tool development Target and integrate multiple source languages Used in TAU to build automated performance instrumentation tools Used in CHASM, XMLGEN, Component method signature extraction, … Using TAU Performance Technology in ESMF 26 ESMF Team Meeting July 14, 2004
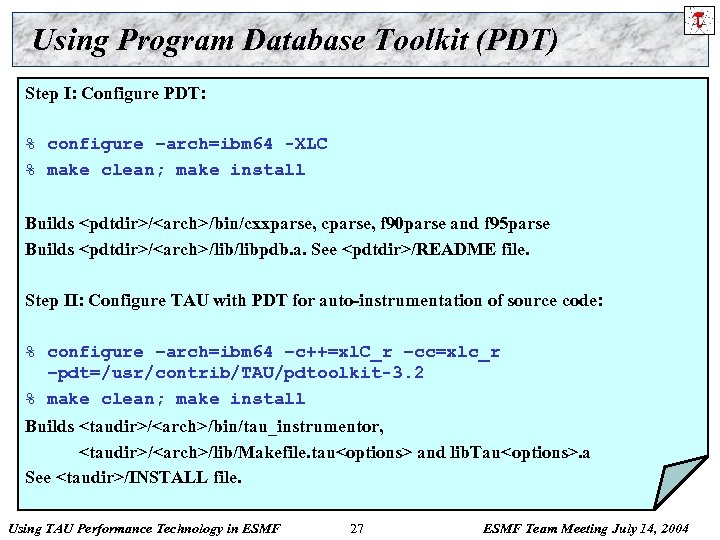 Using Program Database Toolkit (PDT) Step I: Configure PDT: % configure –arch=ibm 64 -XLC % make clean; make install Builds
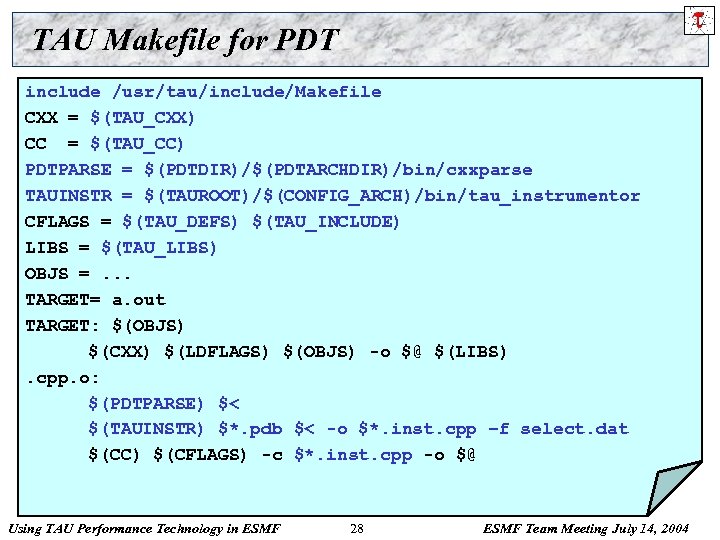 TAU Makefile for PDT include /usr/tau/include/Makefile CXX = $(TAU_CXX) CC = $(TAU_CC) PDTPARSE = $(PDTDIR)/$(PDTARCHDIR)/bin/cxxparse TAUINSTR = $(TAUROOT)/$(CONFIG_ARCH)/bin/tau_instrumentor CFLAGS = $(TAU_DEFS) $(TAU_INCLUDE) LIBS = $(TAU_LIBS) OBJS =. . . TARGET= a. out TARGET: $(OBJS) $(CXX) $(LDFLAGS) $(OBJS) -o $@ $(LIBS). cpp. o: $(PDTPARSE) $< $(TAUINSTR) $*. pdb $< -o $*. inst. cpp –f select. dat $(CC) $(CFLAGS) -c $*. inst. cpp -o $@ Using TAU Performance Technology in ESMF 28 ESMF Team Meeting July 14, 2004
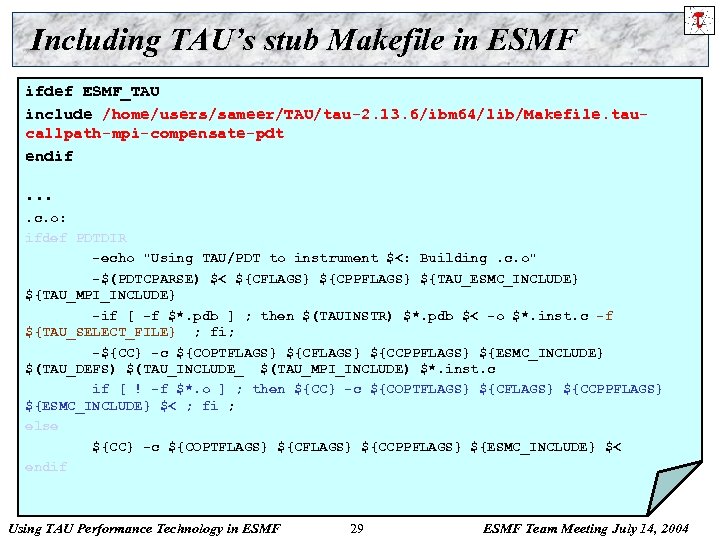 Including TAU’s stub Makefile in ESMF ifdef ESMF_TAU include /home/users/sameer/TAU/tau-2. 13. 6/ibm 64/lib/Makefile. taucallpath-mpi-compensate-pdt endif …. c. o: ifdef PDTDIR -echo "Using TAU/PDT to instrument $<: Building. c. o" -$(PDTCPARSE) $< ${CFLAGS} ${CPPFLAGS} ${TAU_ESMC_INCLUDE} ${TAU_MPI_INCLUDE} -if [ -f $*. pdb ] ; then $(TAUINSTR) $*. pdb $< -o $*. inst. c -f ${TAU_SELECT_FILE} ; fi; -${CC} -c ${COPTFLAGS} ${CCPPFLAGS} ${ESMC_INCLUDE} $(TAU_DEFS) $(TAU_INCLUDE_ $(TAU_MPI_INCLUDE) $*. inst. c if [ ! -f $*. o ] ; then ${CC} -c ${COPTFLAGS} ${CCPPFLAGS} ${ESMC_INCLUDE} $< ; fi ; else ${CC} -c ${COPTFLAGS} ${CCPPFLAGS} ${ESMC_INCLUDE} $< endif Using TAU Performance Technology in ESMF 29 ESMF Team Meeting July 14, 2004
![Using PDT: tau_instrumentor % tau_instrumentor Usage : tau_instrumentor <pdbfile> <sourcefile> [-o <outputfile>] [-noinline] [ Using PDT: tau_instrumentor % tau_instrumentor Usage : tau_instrumentor <pdbfile> <sourcefile> [-o <outputfile>] [-noinline] [](https://present5.com/presentation/8eee581c1ce3f922e9bbb5dbb623d535/image-30.jpg) Using PDT: tau_instrumentor % tau_instrumentor Usage : tau_instrumentor
Using PDT: tau_instrumentor % tau_instrumentor Usage : tau_instrumentor
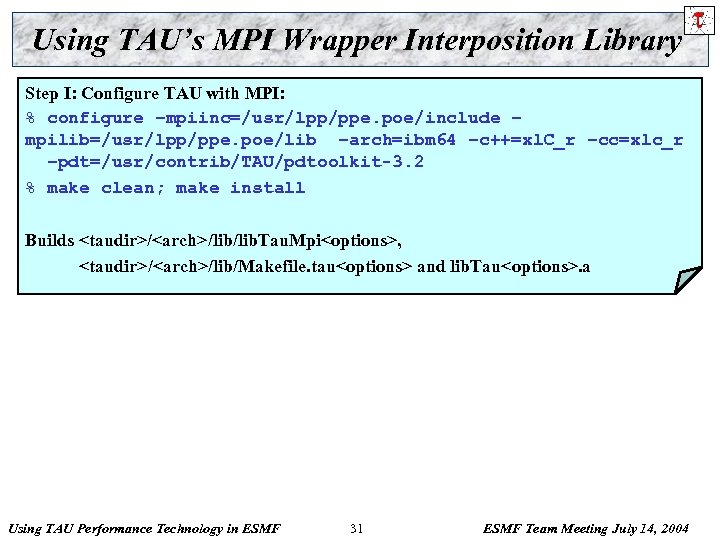 Using TAU’s MPI Wrapper Interposition Library Step I: Configure TAU with MPI: % configure –mpiinc=/usr/lpp/ppe. poe/include – mpilib=/usr/lpp/ppe. poe/lib –arch=ibm 64 –c++=xl. C_r –cc=xlc_r –pdt=/usr/contrib/TAU/pdtoolkit-3. 2 % make clean; make install Builds
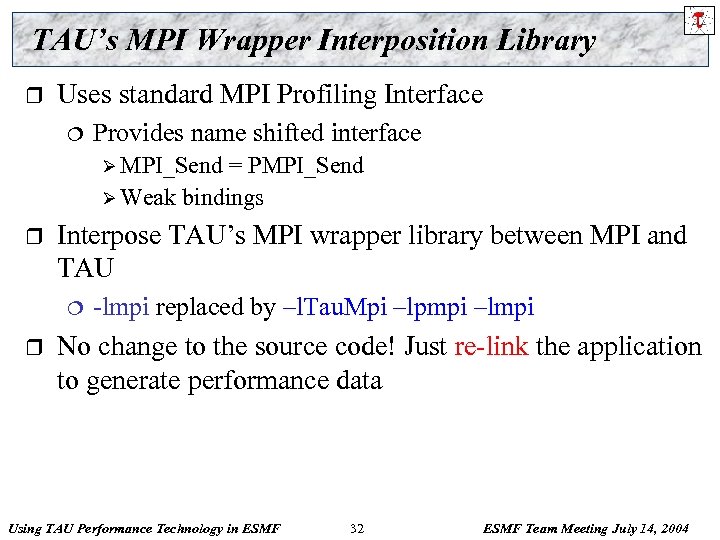 TAU’s MPI Wrapper Interposition Library r Uses standard MPI Profiling Interface ¦ Provides name shifted interface Ø MPI_Send = PMPI_Send Ø Weak bindings r Interpose TAU’s MPI wrapper library between MPI and TAU ¦ r -lmpi replaced by –l. Tau. Mpi –lpmpi –lmpi No change to the source code! Just re-link the application to generate performance data Using TAU Performance Technology in ESMF 32 ESMF Team Meeting July 14, 2004
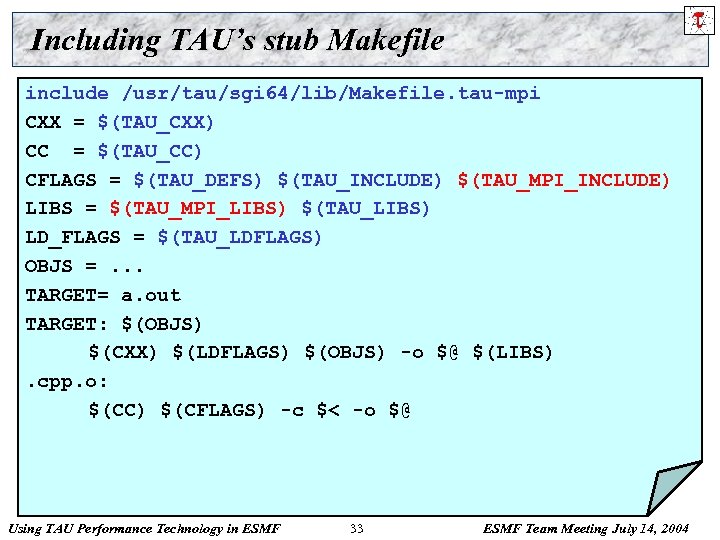 Including TAU’s stub Makefile include /usr/tau/sgi 64/lib/Makefile. tau-mpi CXX = $(TAU_CXX) CC = $(TAU_CC) CFLAGS = $(TAU_DEFS) $(TAU_INCLUDE) $(TAU_MPI_INCLUDE) LIBS = $(TAU_MPI_LIBS) $(TAU_LIBS) LD_FLAGS = $(TAU_LDFLAGS) OBJS =. . . TARGET= a. out TARGET: $(OBJS) $(CXX) $(LDFLAGS) $(OBJS) -o $@ $(LIBS). cpp. o: $(CC) $(CFLAGS) -c $< -o $@ Using TAU Performance Technology in ESMF 33 ESMF Team Meeting July 14, 2004
![CCA Performance Observation Component Common Component Architecture for Scientific Components [www. cca-forum. org] r CCA Performance Observation Component Common Component Architecture for Scientific Components [www. cca-forum. org] r](https://present5.com/presentation/8eee581c1ce3f922e9bbb5dbb623d535/image-34.jpg) CCA Performance Observation Component Common Component Architecture for Scientific Components [www. cca-forum. org] r Design measurement port and measurement interfaces r ¦ Timer Ø start/stop Ø set ¦ name/type/group Control Ø enable/disable ¦ groups Query Ø get timer names Ø metrics, counters, dump to disk ¦ Event Ø user-defined events Using TAU Performance Technology in ESMF 34 ESMF Team Meeting July 14, 2004
CCA Performance Observation Component Common Component Architecture for Scientific Components [www. cca-forum. org] r Design measurement port and measurement interfaces r ¦ Timer Ø start/stop Ø set ¦ name/type/group Control Ø enable/disable ¦ groups Query Ø get timer names Ø metrics, counters, dump to disk ¦ Event Ø user-defined events Using TAU Performance Technology in ESMF 34 ESMF Team Meeting July 14, 2004
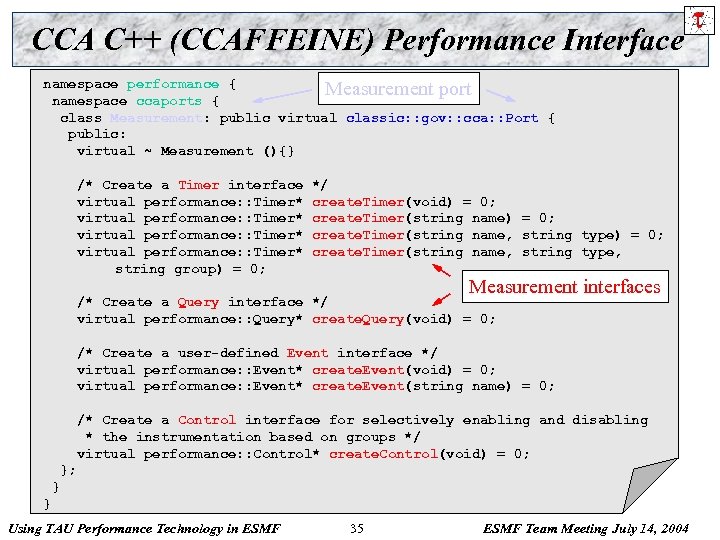 CCA C++ (CCAFFEINE) Performance Interface namespace performance { Measurement port namespace ccaports { class Measurement: public virtual classic: : gov: : cca: : Port { public: virtual ~ Measurement (){} /* Create a Timer interface */ virtual performance: : Timer* create. Timer(void) = 0; virtual performance: : Timer* create. Timer(string name, string type) = 0; virtual performance: : Timer* create. Timer(string name, string type, string group) = 0; Measurement interfaces /* Create a Query interface */ virtual performance: : Query* create. Query(void) = 0; /* Create a user-defined Event interface */ virtual performance: : Event* create. Event(void) = 0; virtual performance: : Event* create. Event(string name) = 0; /* Create a Control interface for selectively enabling and disabling * the instrumentation based on groups */ virtual performance: : Control* create. Control(void) = 0; }; } } Using TAU Performance Technology in ESMF 35 ESMF Team Meeting July 14, 2004
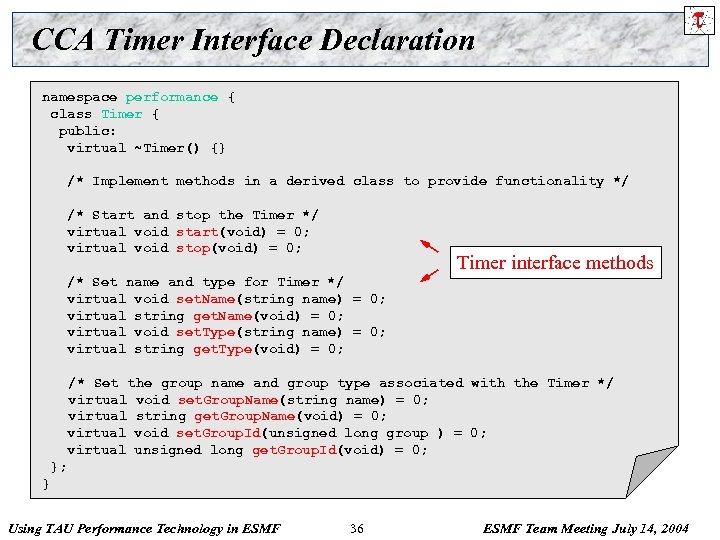 CCA Timer Interface Declaration namespace performance { class Timer { public: virtual ~Timer() {} /* Implement methods in a derived class to provide functionality */ /* Start and stop the Timer */ virtual void start(void) = 0; virtual void stop(void) = 0; Timer interface methods /* Set name and type for Timer */ virtual void set. Name(string name) = 0; virtual string get. Name(void) = 0; virtual void set. Type(string name) = 0; virtual string get. Type(void) = 0; /* Set the group name and group type associated with the Timer */ virtual void set. Group. Name(string name) = 0; virtual string get. Group. Name(void) = 0; virtual void set. Group. Id(unsigned long group ) = 0; virtual unsigned long get. Group. Id(void) = 0; }; } Using TAU Performance Technology in ESMF 36 ESMF Team Meeting July 14, 2004
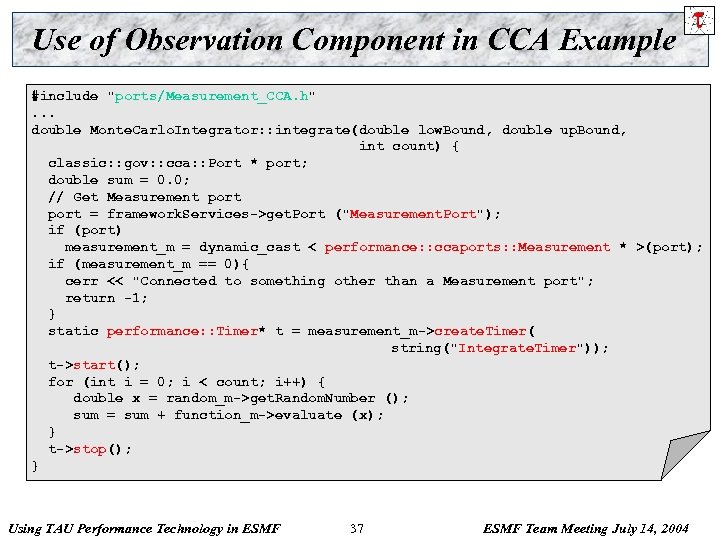 Use of Observation Component in CCA Example #include "ports/Measurement_CCA. h". . . double Monte. Carlo. Integrator: : integrate(double low. Bound, double up. Bound, int count) { classic: : gov: : cca: : Port * port; double sum = 0. 0; // Get Measurement port = framework. Services->get. Port ("Measurement. Port"); if (port) measurement_m = dynamic_cast < performance: : ccaports: : Measurement * >(port); if (measurement_m == 0){ cerr << "Connected to something other than a Measurement port"; return -1; } static performance: : Timer* t = measurement_m->create. Timer( string("Integrate. Timer")); t->start(); for (int i = 0; i < count; i++) { double x = random_m->get. Random. Number (); sum = sum + function_m->evaluate (x); } t->stop(); } Using TAU Performance Technology in ESMF 37 ESMF Team Meeting July 14, 2004
![Using TAU Component in ESMF/CCA [S. Zhou] Using TAU Performance Technology in ESMF 38 Using TAU Component in ESMF/CCA [S. Zhou] Using TAU Performance Technology in ESMF 38](https://present5.com/presentation/8eee581c1ce3f922e9bbb5dbb623d535/image-38.jpg) Using TAU Component in ESMF/CCA [S. Zhou] Using TAU Performance Technology in ESMF 38 ESMF Team Meeting July 14, 2004
Using TAU Component in ESMF/CCA [S. Zhou] Using TAU Performance Technology in ESMF 38 ESMF Team Meeting July 14, 2004
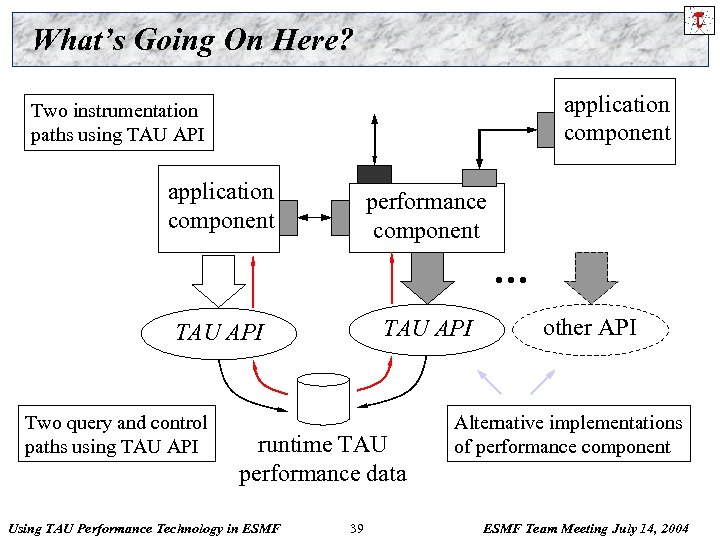 What’s Going On Here? application component Two instrumentation paths using TAU API application component performance component … TAU API Two query and control paths using TAU API runtime TAU performance data Using TAU Performance Technology in ESMF 39 other API Alternative implementations of performance component ESMF Team Meeting July 14, 2004
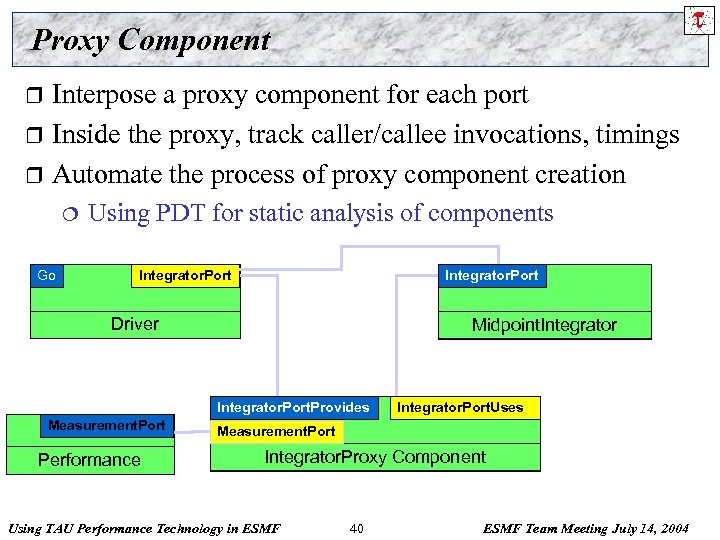 Proxy Component Interpose a proxy component for each port r Inside the proxy, track caller/callee invocations, timings r Automate the process of proxy component creation r ¦ Go Using PDT for static analysis of components Integrator. Port Driver Midpoint. Integrator. Port. Provides Measurement. Port Performance Integrator. Port. Uses Measurement. Port Integrator. Proxy Component Using TAU Performance Technology in ESMF 40 ESMF Team Meeting July 14, 2004
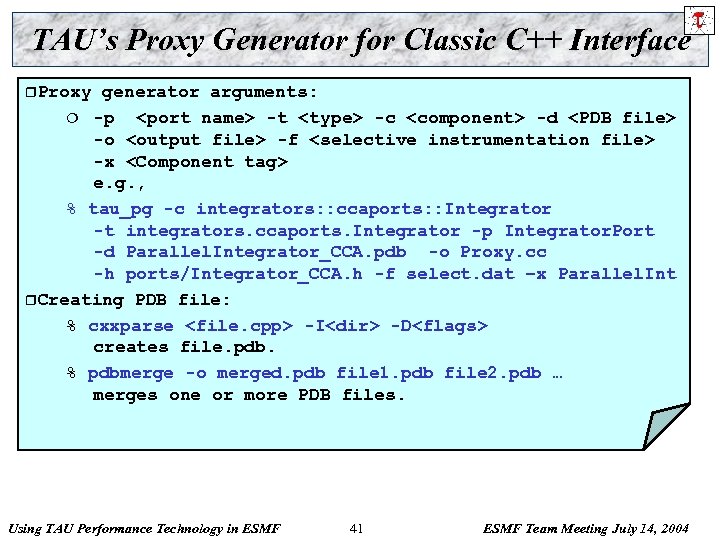 TAU’s Proxy Generator for Classic C++ Interface r. Proxy generator arguments: -p
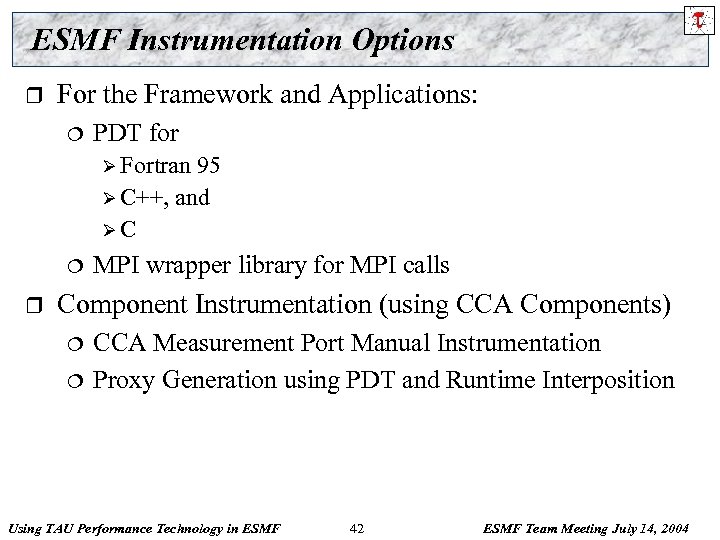 ESMF Instrumentation Options r For the Framework and Applications: ¦ PDT for Ø Fortran 95 Ø C++, and ØC ¦ r MPI wrapper library for MPI calls Component Instrumentation (using CCA Components) ¦ ¦ CCA Measurement Port Manual Instrumentation Proxy Generation using PDT and Runtime Interposition Using TAU Performance Technology in ESMF 42 ESMF Team Meeting July 14, 2004
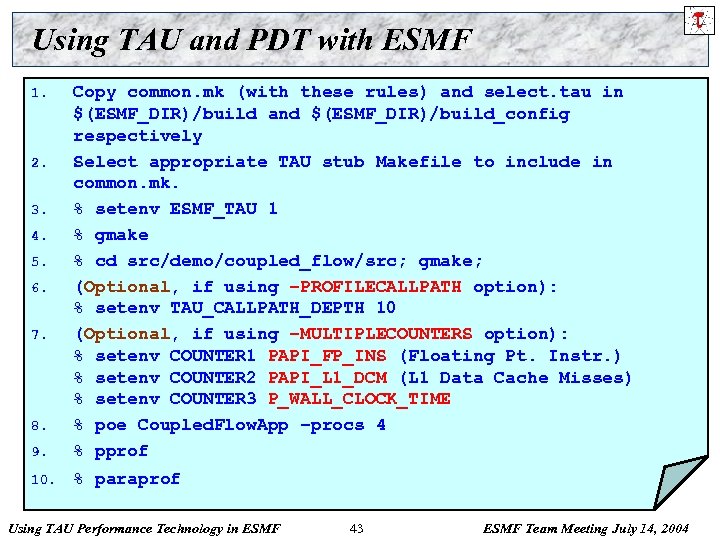 Using TAU and PDT with ESMF 9. Copy common. mk (with these rules) and select. tau in $(ESMF_DIR)/build and $(ESMF_DIR)/build_config respectively Select appropriate TAU stub Makefile to include in common. mk. % setenv ESMF_TAU 1 % gmake % cd src/demo/coupled_flow/src; gmake; (Optional, if using –PROFILECALLPATH option): % setenv TAU_CALLPATH_DEPTH 10 (Optional, if using –MULTIPLECOUNTERS option): % setenv COUNTER 1 PAPI_FP_INS (Floating Pt. Instr. ) % setenv COUNTER 2 PAPI_L 1_DCM (L 1 Data Cache Misses) % setenv COUNTER 3 P_WALL_CLOCK_TIME % poe Coupled. Flow. App –procs 4 % pprof 10. % paraprof 1. 2. 3. 4. 5. 6. 7. 8. Using TAU Performance Technology in ESMF 43 ESMF Team Meeting July 14, 2004
 TAU Analysis r Parallel profile analysis ¦ pprof Ø parallel ¦ profiler with text-based display paraprof Ø Graphical, r scalable, parallel profile analysis and display Trace analysis and visualization ¦ ¦ ¦ Trace merging and clock adjustment (if necessary) Trace format conversion (ALOG, SDDF, VTF, Paraver) Trace visualization using Vampir (Pallas/Intel) Using TAU Performance Technology in ESMF 44 ESMF Team Meeting July 14, 2004
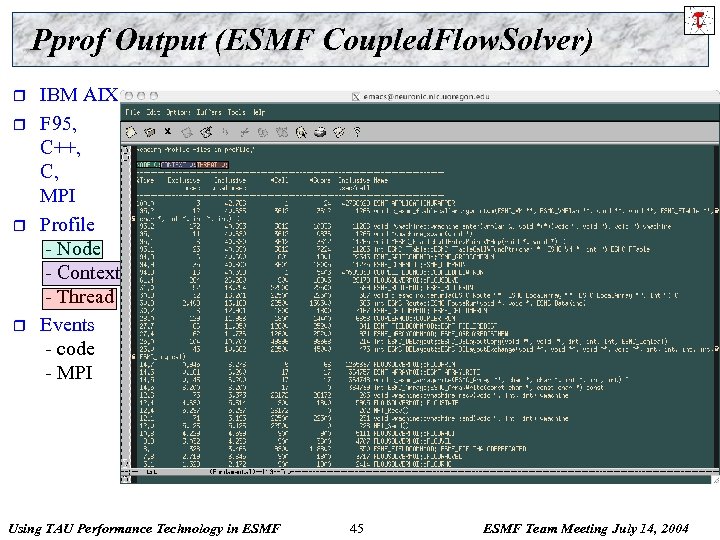 Pprof Output (ESMF Coupled. Flow. Solver) r r IBM AIX F 95, C++, C, MPI Profile - Node - Context - Thread Events - code - MPI Using TAU Performance Technology in ESMF 45 ESMF Team Meeting July 14, 2004
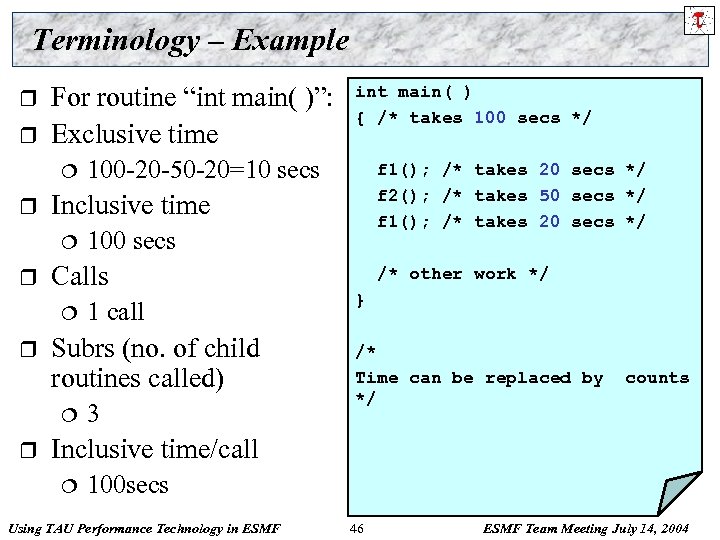 Terminology – Example r r For routine “int main( )”: Exclusive time ¦ r Inclusive time ¦ r 1 call Subrs (no. of child routines called) ¦ r 100 secs Calls ¦ r 100 -20 -50 -20=10 secs 3 int main( ) { /* takes 100 secs */ f 1(); /* takes 20 secs */ f 2(); /* takes 50 secs */ f 1(); /* takes 20 secs */ /* other work */ } /* Time can be replaced by counts */ Inclusive time/call ¦ 100 secs Using TAU Performance Technology in ESMF 46 ESMF Team Meeting July 14, 2004
 Performance Analysis and Visualization r r Analysis of parallel profile and trace measurement Parallel profile analysis ¦ ¦ ¦ r r Performance data management framework (Perf. DMF) Parallel trace analysis ¦ ¦ r Para. Prof Cube Profile Browser (UTK, FZJ) Profile generation from trace data Translation to VTF 3. 0 and EPILOG Integration with VNG (Technical University of Dresden) Online parallel analysis and visualization Using TAU Performance Technology in ESMF 47 ESMF Team Meeting July 14, 2004
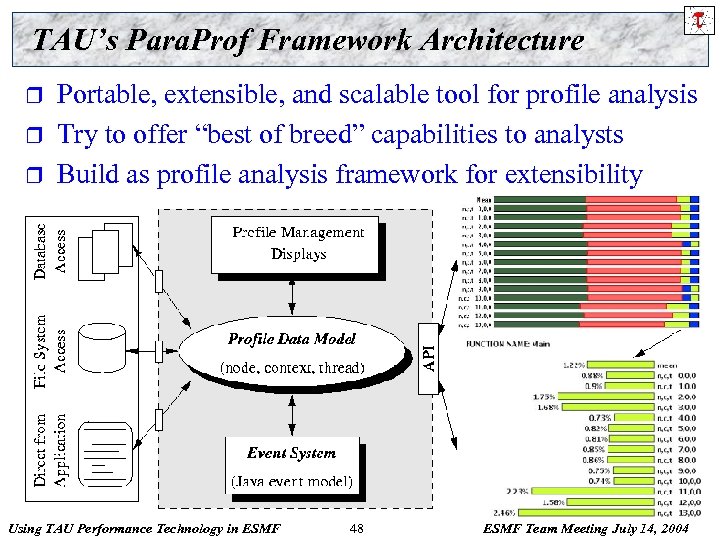 TAU’s Para. Prof Framework Architecture r r r Portable, extensible, and scalable tool for profile analysis Try to offer “best of breed” capabilities to analysts Build as profile analysis framework for extensibility Using TAU Performance Technology in ESMF 48 ESMF Team Meeting July 14, 2004
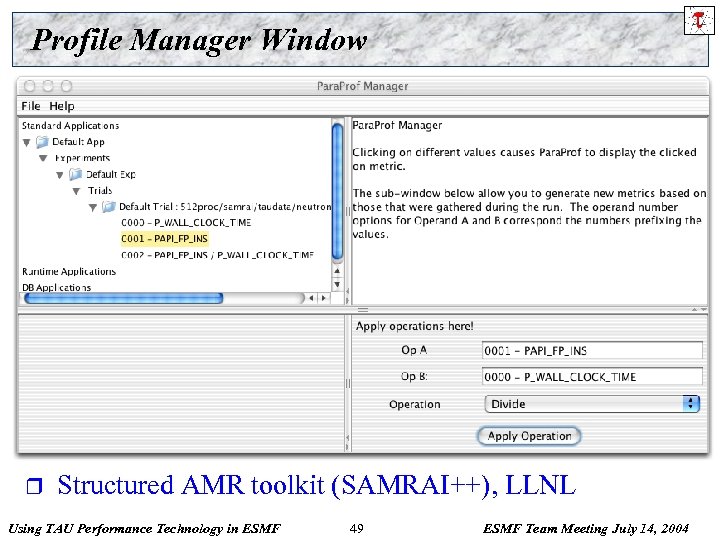 Profile Manager Window r Structured AMR toolkit (SAMRAI++), LLNL Using TAU Performance Technology in ESMF 49 ESMF Team Meeting July 14, 2004
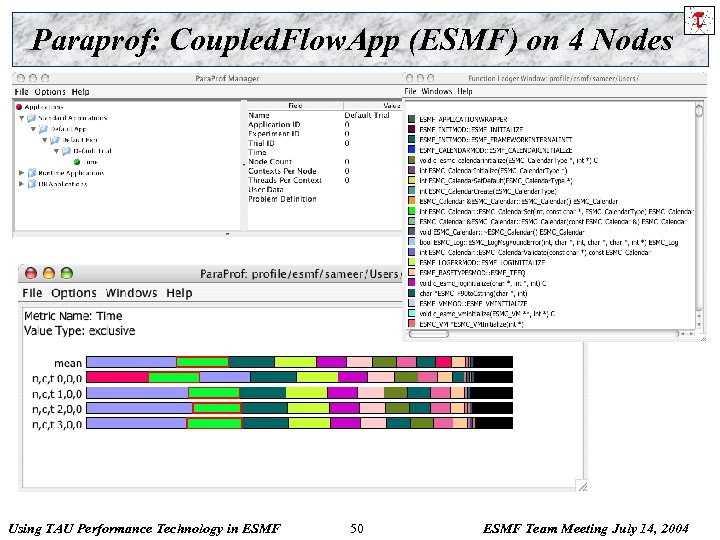 Paraprof: Coupled. Flow. App (ESMF) on 4 Nodes Using TAU Performance Technology in ESMF 50 ESMF Team Meeting July 14, 2004
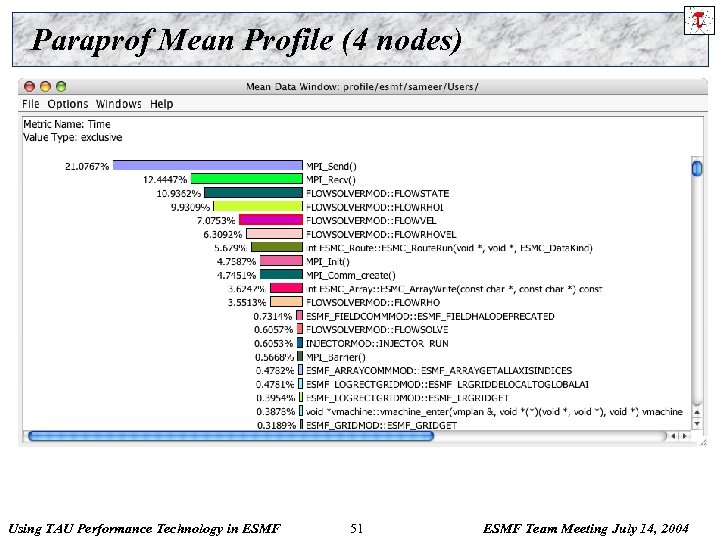 Paraprof Mean Profile (4 nodes) Using TAU Performance Technology in ESMF 51 ESMF Team Meeting July 14, 2004
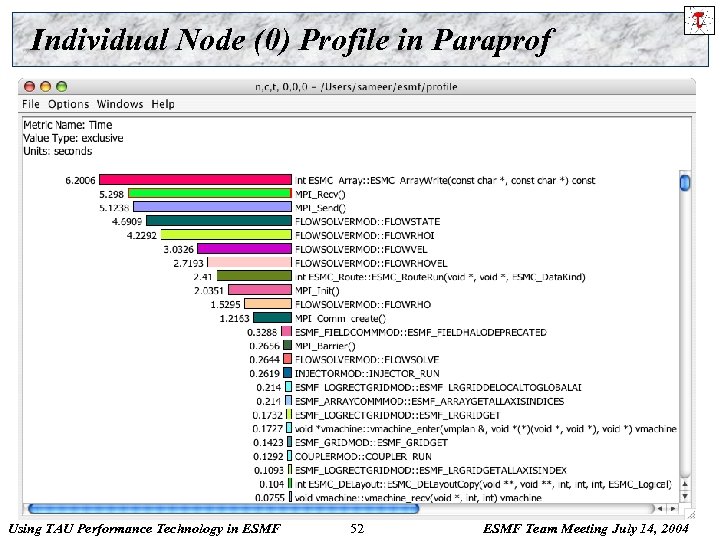 Individual Node (0) Profile in Paraprof Using TAU Performance Technology in ESMF 52 ESMF Team Meeting July 14, 2004
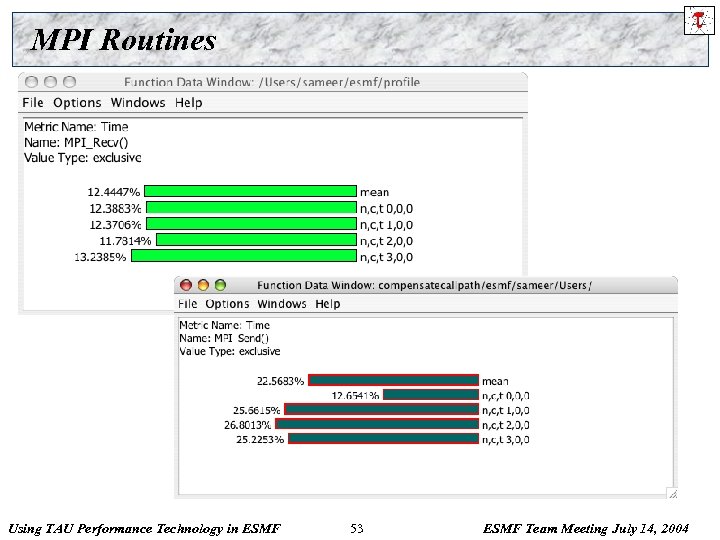 MPI Routines Using TAU Performance Technology in ESMF 53 ESMF Team Meeting July 14, 2004
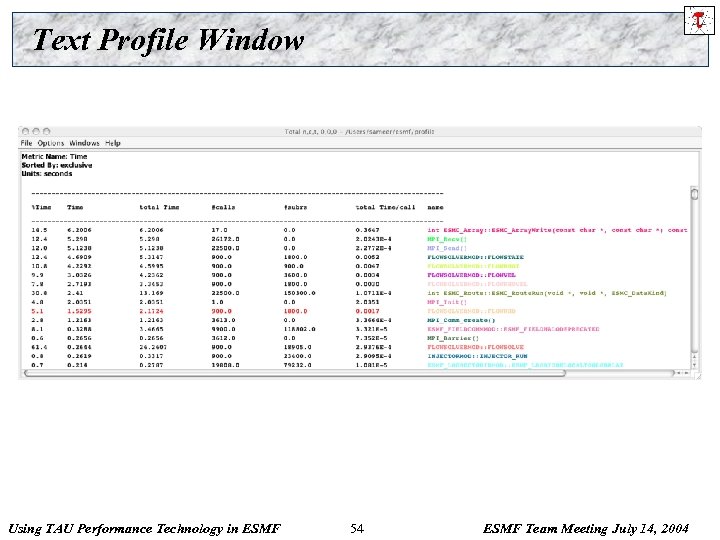 Text Profile Window Using TAU Performance Technology in ESMF 54 ESMF Team Meeting July 14, 2004
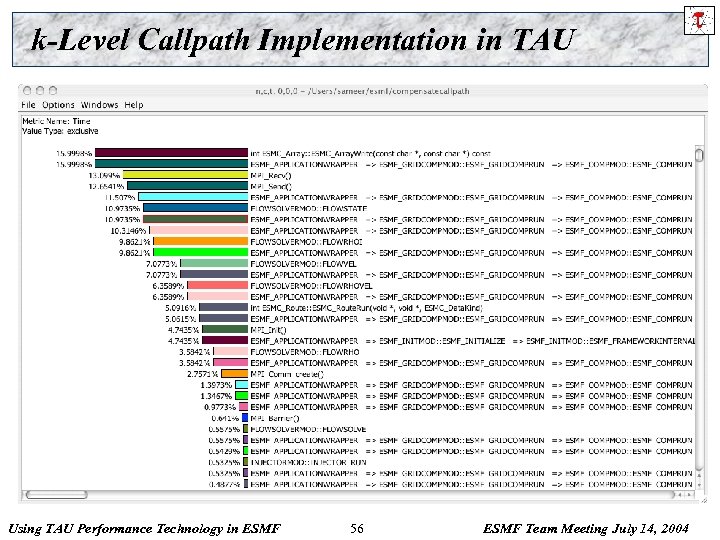
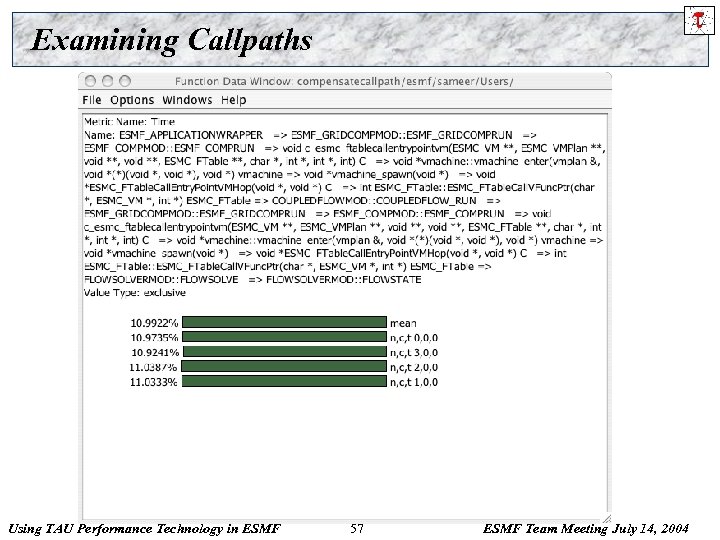
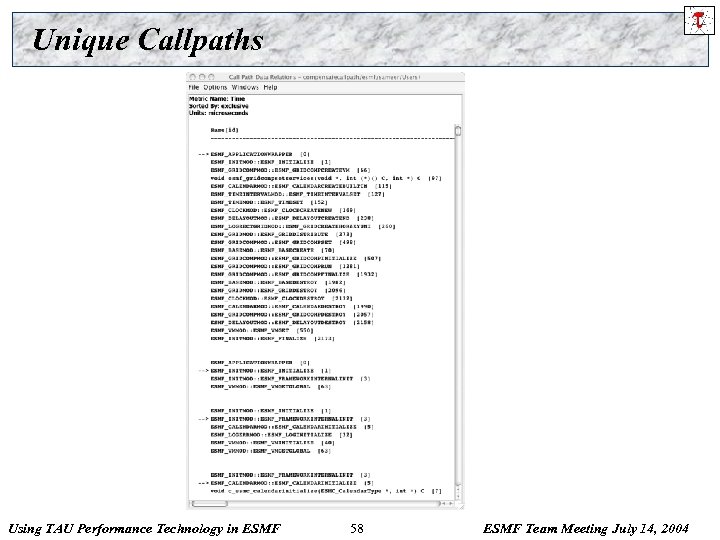
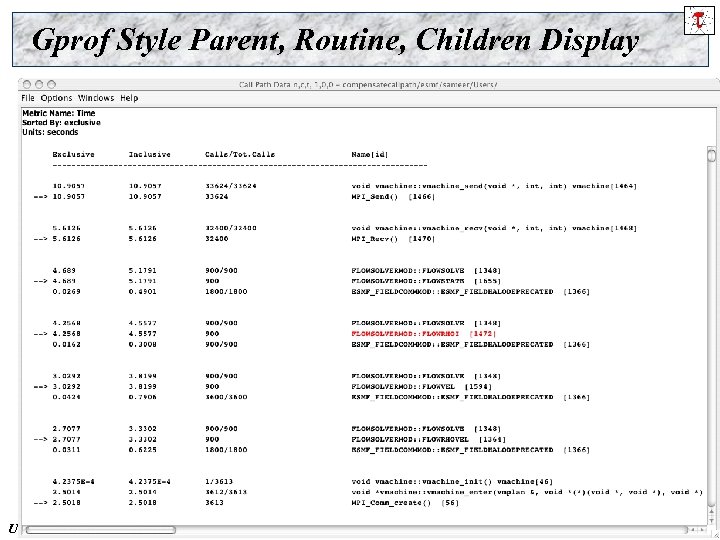
 k-Level Callpath Implementation in TAU r r TAU maintains a performance event (routine) callstack Profiled routine (child) looks in callstack for parent ¦ ¦ Previous profiled performance event is the parent A callpath profile structure created first time parent calls TAU records parent in a callgraph map for child String representing k-level callpath used as its key Ø r Map returns pointer to callpath profile structure ¦ ¦ r r r “a( )=>b( )=>c()” : name for time spent in “c” when called by “b” when “b” is called by “a” k-level callpath is profiled using this profiling data Set environment variable TAU_CALLPATH_DEPTH to depth Build upon TAU’s performance mapping technology Measurement is independent of instrumentation Use –PROFILECALLPATH to configure TAU Using TAU Performance Technology in ESMF 55 ESMF Team Meeting July 14, 2004
 k-Level Callpath Implementation in TAU Using TAU Performance Technology in ESMF 56 ESMF Team Meeting July 14, 2004
 Examining Callpaths Using TAU Performance Technology in ESMF 57 ESMF Team Meeting July 14, 2004
 Unique Callpaths Using TAU Performance Technology in ESMF 58 ESMF Team Meeting July 14, 2004
 Gprof Style Parent, Routine, Children Display Using TAU Performance Technology in ESMF 59 ESMF Team Meeting July 14, 2004
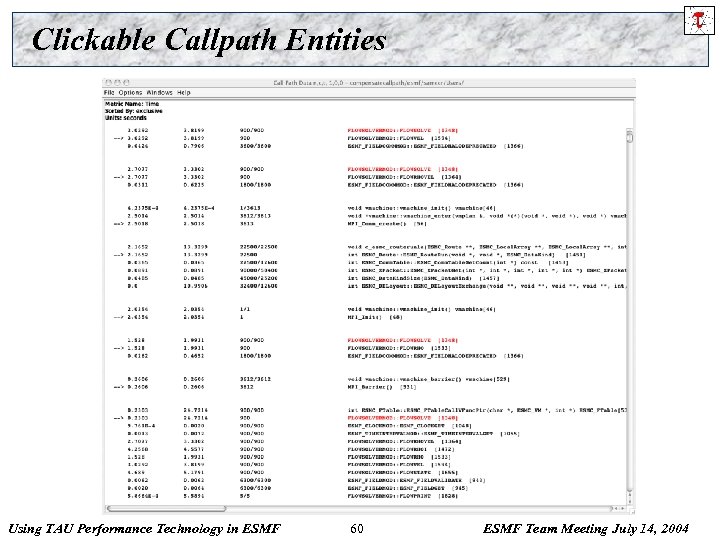 Clickable Callpath Entities Using TAU Performance Technology in ESMF 60 ESMF Team Meeting July 14, 2004
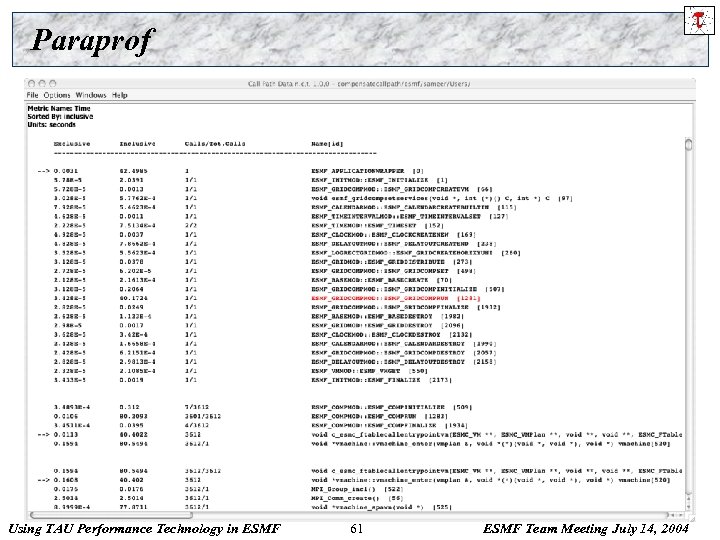 Paraprof Using TAU Performance Technology in ESMF 61 ESMF Team Meeting July 14, 2004
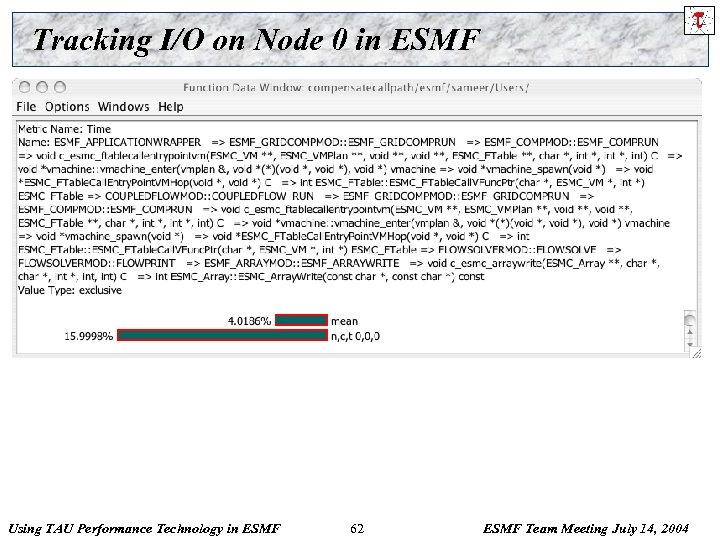 Tracking I/O on Node 0 in ESMF Using TAU Performance Technology in ESMF 62 ESMF Team Meeting July 14, 2004
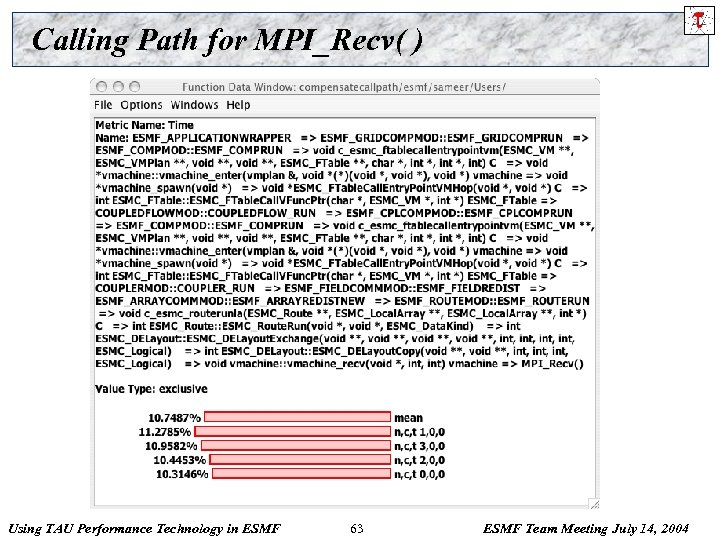 Calling Path for MPI_Recv( ) Using TAU Performance Technology in ESMF 63 ESMF Team Meeting July 14, 2004
![CUBE (UTK, FZJ) Browser [Sept. 2004] Using TAU Performance Technology in ESMF 64 ESMF CUBE (UTK, FZJ) Browser [Sept. 2004] Using TAU Performance Technology in ESMF 64 ESMF](https://present5.com/presentation/8eee581c1ce3f922e9bbb5dbb623d535/image-64.jpg) CUBE (UTK, FZJ) Browser [Sept. 2004] Using TAU Performance Technology in ESMF 64 ESMF Team Meeting July 14, 2004
CUBE (UTK, FZJ) Browser [Sept. 2004] Using TAU Performance Technology in ESMF 64 ESMF Team Meeting July 14, 2004
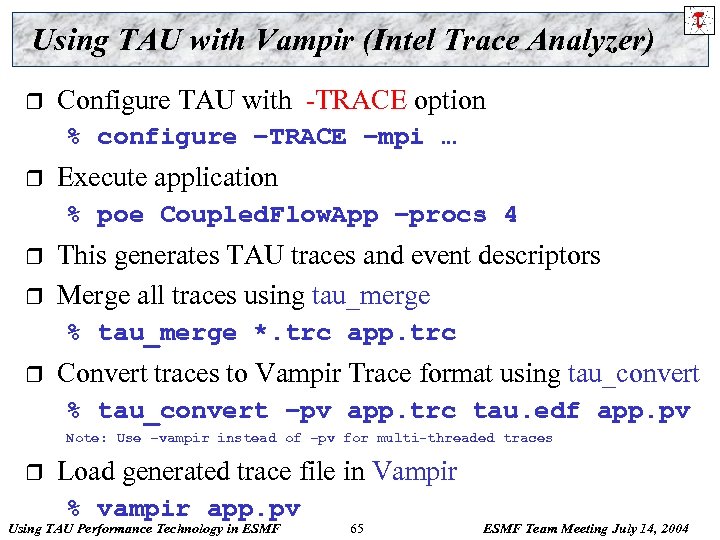 Using TAU with Vampir (Intel Trace Analyzer) r Configure TAU with -TRACE option % configure –TRACE –mpi … r Execute application % poe Coupled. Flow. App –procs 4 r r This generates TAU traces and event descriptors Merge all traces using tau_merge % tau_merge *. trc app. trc r Convert traces to Vampir Trace format using tau_convert % tau_convert –pv app. trc tau. edf app. pv Note: Use –vampir instead of –pv for multi-threaded traces r Load generated trace file in Vampir % vampir app. pv Using TAU Performance Technology in ESMF 65 ESMF Team Meeting July 14, 2004
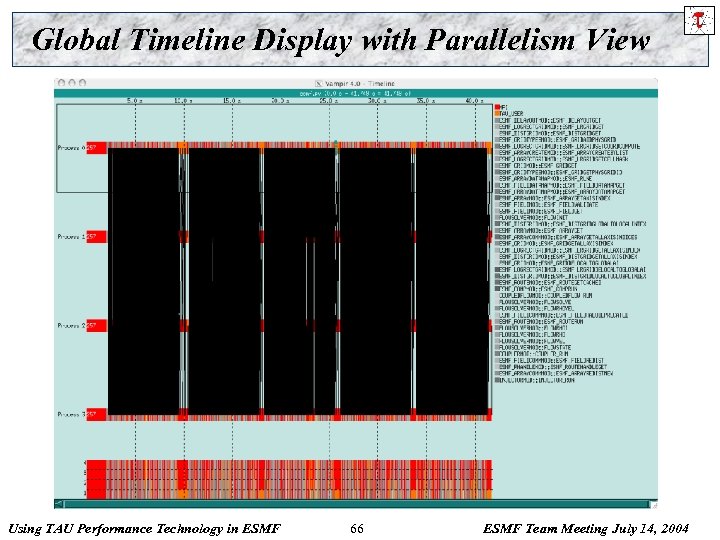 Global Timeline Display with Parallelism View Using TAU Performance Technology in ESMF 66 ESMF Team Meeting July 14, 2004
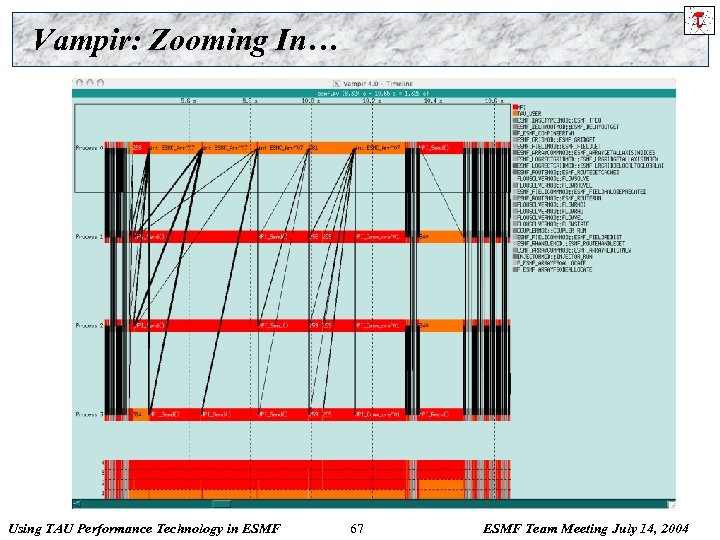 Vampir: Zooming In… Using TAU Performance Technology in ESMF 67 ESMF Team Meeting July 14, 2004
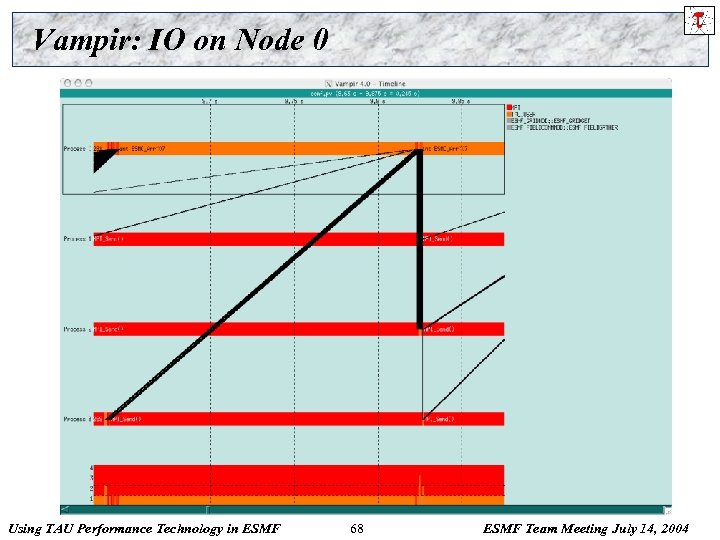 Vampir: IO on Node 0 Using TAU Performance Technology in ESMF 68 ESMF Team Meeting July 14, 2004
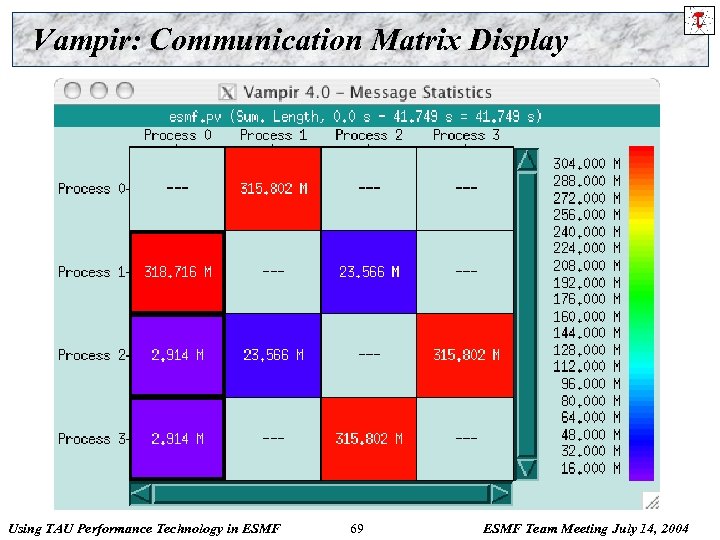 Vampir: Communication Matrix Display Using TAU Performance Technology in ESMF 69 ESMF Team Meeting July 14, 2004
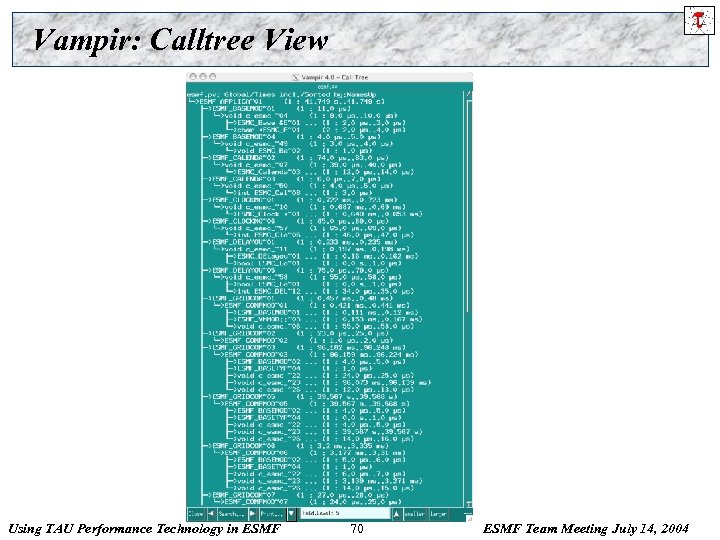 Vampir: Calltree View Using TAU Performance Technology in ESMF 70 ESMF Team Meeting July 14, 2004
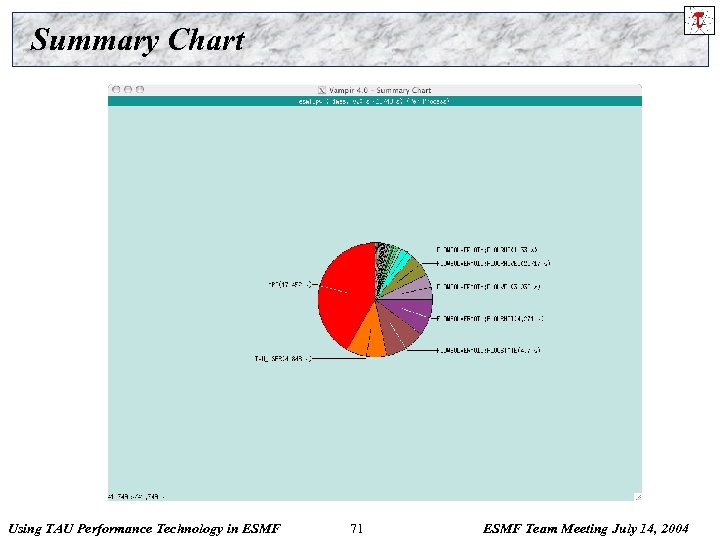 Summary Chart Using TAU Performance Technology in ESMF 71 ESMF Team Meeting July 14, 2004
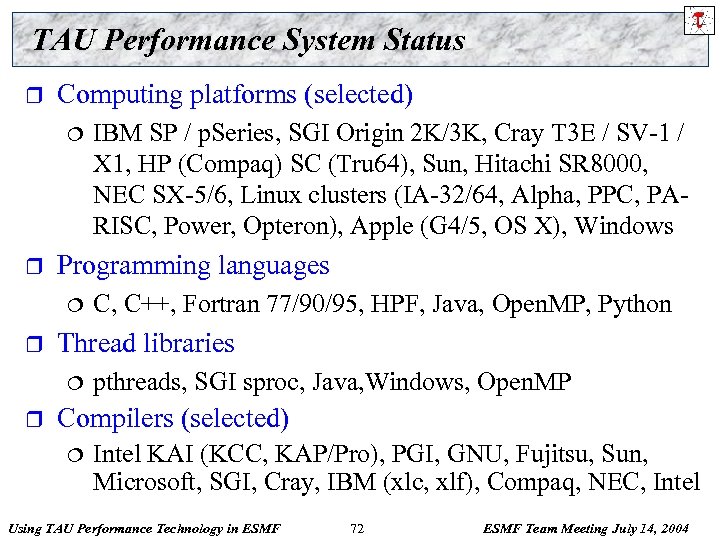 TAU Performance System Status r Computing platforms (selected) ¦ r Programming languages ¦ r C, C++, Fortran 77/90/95, HPF, Java, Open. MP, Python Thread libraries ¦ r IBM SP / p. Series, SGI Origin 2 K/3 K, Cray T 3 E / SV-1 / X 1, HP (Compaq) SC (Tru 64), Sun, Hitachi SR 8000, NEC SX-5/6, Linux clusters (IA-32/64, Alpha, PPC, PARISC, Power, Opteron), Apple (G 4/5, OS X), Windows pthreads, SGI sproc, Java, Windows, Open. MP Compilers (selected) ¦ Intel KAI (KCC, KAP/Pro), PGI, GNU, Fujitsu, Sun, Microsoft, SGI, Cray, IBM (xlc, xlf), Compaq, NEC, Intel Using TAU Performance Technology in ESMF 72 ESMF Team Meeting July 14, 2004
 Concluding Remarks Complex parallel systems and software pose challenging performance analysis problems that require robust methodologies and tools r To build more sophisticated performance tools, existing proven performance technology must be utilized r Performance tools must be integrated with software and systems models and technology r Performance engineered software ¦ Function consistently and coherently in software and system environments ¦ r TAU performance system offers robust performance technology that can be broadly integrated Using TAU Performance Technology in ESMF 73 ESMF Team Meeting July 14, 2004
 Support Acknowledgements r r Department of Energy (DOE) ¦ Office of Science contracts ¦ University of Utah DOE ASCI Level 1 sub-contract ¦ DOE ASCI Level 3 (LANL, LLNL) NSF National Young Investigator (NYI) award Research Centre Juelich ¦ John von Neumann Institute for Computing ¦ Dr. Bernd Mohr Los Alamos National Laboratory Using TAU Performance Technology in ESMF 74 ESMF Team Meeting July 14, 2004


