afdd7d8e5253b5ae1f73c63661095db1.ppt
- Количество слайдов: 58
 Using Statspack in Oracle 8 i and 9 i to Identify Problems Ian Jones Database Specialists, Inc. www. dbspecialists. com 3/19/2018 1
 Session Topics § Statspack introduction and features § Mechanics – installing – generating snapshots – producing reports § Discussion of the generic report § Examples 3/19/2018 2
 Session Topics § Statspack introduction and features § Mechanics – installing – generating snapshots – producing reports § Discussion of the generic report § Examples 3/19/2018 3
 What is Statspack? § An Oracle provided set of SQL*Plus scripts and a PL/SQL package that allows the convenient collection, automation, storage and reporting of performance and diagnostic data § A PERFSTAT schema containing 42 ‘stats$’ tables and a PL/SQL package ‘statspack’ § Replacement for utlbstat/utlestat 3/19/2018 4
 Overview of How Statspack Works § Oracle instances constantly update lots of internal statistics, most visible through the v$ views e. g. system statistics, wait events and SQL activity, etc (timed_statistics, resource_limit, 9 i statistics_level) § Using ‘statspack. snap’ we save away these values from 34 v$ views into stats$ tables when desired § Then we run the statspack report script ‘spreport. sql’ which calculates and displays the differences between any two sets of statistics § Straightforward and effective 3/19/2018 5
 What Questions Can Statspack Answer? § § § What work load is the database under now? What activities/events are we waiting for? Which SQL is consuming most resources? Which segments are most problematic? Where is the I/O, and are we CPU bound? How does all this compare with earlier data? Statspack provides diagnostic data to solve problems. 3/19/2018 6
 Why Use Statspack? § § § Simple and quick to install and use Provided with all editions version 8. 1. 6+ Written by Oracle - in sync with RDBMS Small system overhead (varies with level) Source code is available for review Snapshot data held in tables and available for historical or custom analysis 3/19/2018 7
 Replacement For (utl)bstat/estat § Statspack has an improved design over bstat/estat – Flexible reporting because data held in tables – Different levels of data collection – User defined thresholds § Wider range of data – SQL statements – Wait events – Segment statistics (9. 2) § Bstat/estat not updated with new features 3/19/2018 8
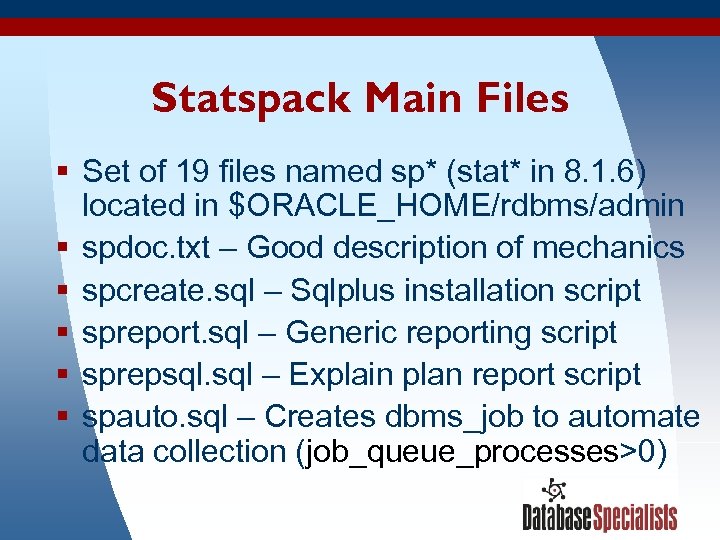 Statspack Main Files § Set of 19 files named sp* (stat* in 8. 1. 6) located in $ORACLE_HOME/rdbms/admin § spdoc. txt – Good description of mechanics § spcreate. sql – Sqlplus installation script § spreport. sql – Generic reporting script § sprepsql. sql – Explain plan report script § spauto. sql – Creates dbms_job to automate data collection (job_queue_processes>0) 3/19/2018 9
 Session Topics § Statspack introduction and features § Mechanics – installing – generating snapshots – producing reports § Discussion of the generic report § Examples 3/19/2018 10
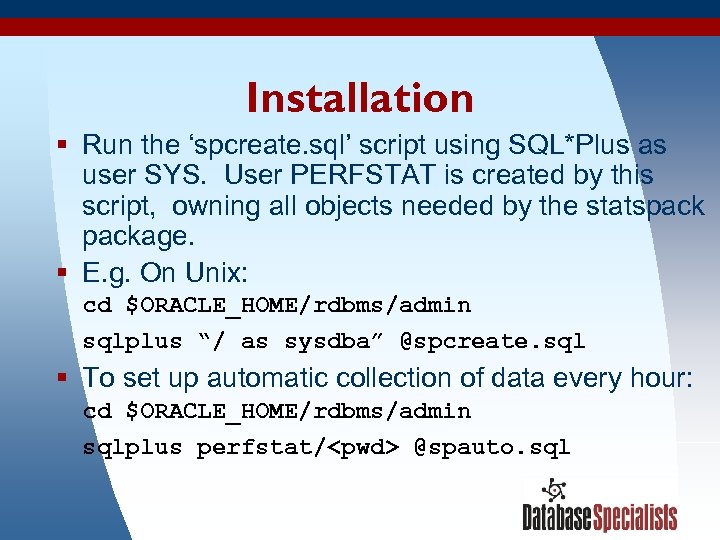 Installation § Run the ‘spcreate. sql’ script using SQL*Plus as user SYS. User PERFSTAT is created by this script, owning all objects needed by the statspackage. § E. g. On Unix: cd $ORACLE_HOME/rdbms/admin sqlplus “/ as sysdba” @spcreate. sql § To set up automatic collection of data every hour: cd $ORACLE_HOME/rdbms/admin sqlplus perfstat/
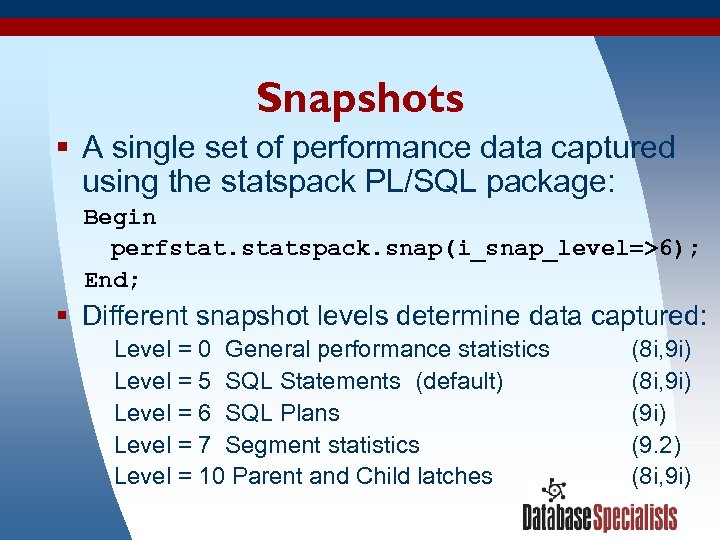 Snapshots § A single set of performance data captured using the statspack PL/SQL package: Begin perfstatspack. snap(i_snap_level=>6); End; § Different snapshot levels determine data captured: Level = 0 General performance statistics Level = 5 SQL Statements (default) Level = 6 SQL Plans Level = 7 Segment statistics Level = 10 Parent and Child latches 3/19/2018 (8 i, 9 i) (9 i) (9. 2) (8 i, 9 i) 12
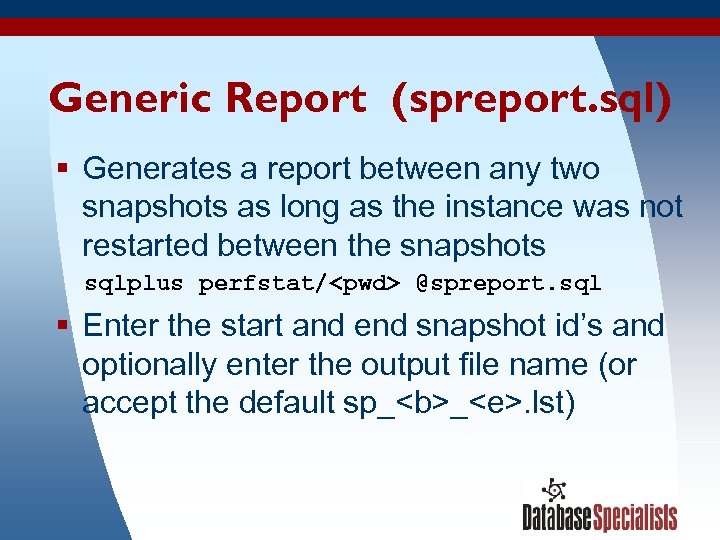 Generic Report (spreport. sql) § Generates a report between any two snapshots as long as the instance was not restarted between the snapshots sqlplus perfstat/
 Session Topics § Statspack introduction and features § Mechanics – installing – generating snapshots – producing reports § Discussion of the generic report § Examples 3/19/2018 14
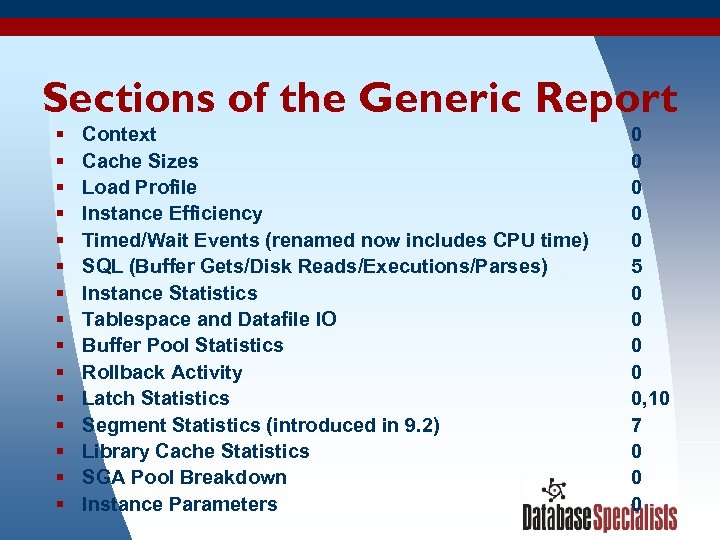 Sections of the Generic Report § Context § Cache Sizes § Load Profile § Instance Efficiency § Timed/Wait Events (renamed now includes CPU time) § SQL (Buffer Gets/Disk Reads/Executions/Parses) § Instance Statistics § Tablespace and Datafile IO § Buffer Pool Statistics § Rollback Activity § Latch Statistics § Segment Statistics (introduced in 9. 2) § Library Cache Statistics § SGA Pool Breakdown § 3/19/2018 Instance Parameters 0 0 0 5 0 0 0, 10 7 0 0 0 15
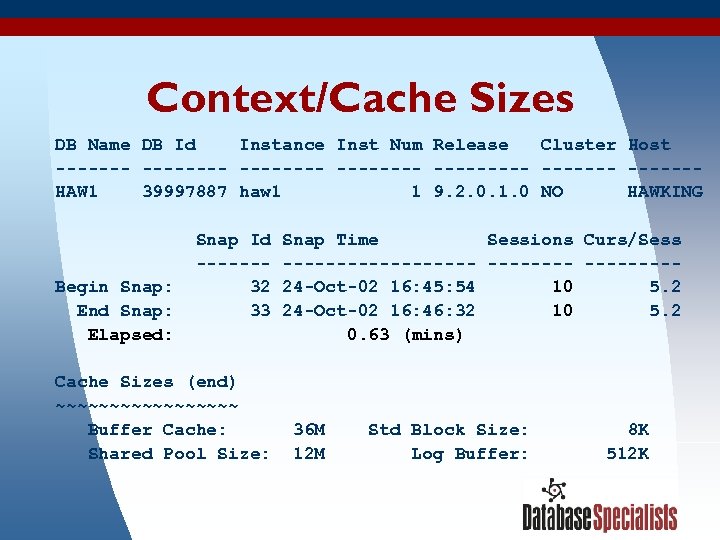 Context/Cache Sizes DB Name DB Id Instance Inst Num Release Cluster Host -------- ------HAW 1 39997887 haw 1 1 9. 2. 0. 1. 0 NO HAWKING Begin Snap: End Snap: Elapsed: Snap Id ------32 33 Cache Sizes (end) ~~~~~~~~~ Buffer Cache: Shared Pool Size: 3/19/2018 Snap Time Sessions Curs/Sess ---------24 -Oct-02 16: 45: 54 10 5. 2 24 -Oct-02 16: 46: 32 10 5. 2 0. 63 (mins) 36 M 12 M Std Block Size: Log Buffer: 8 K 512 K 16
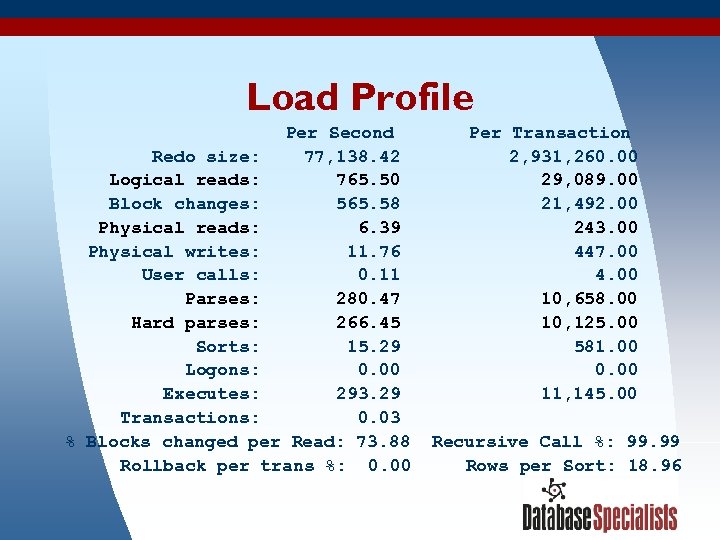 Load Profile Per Second Redo size: 77, 138. 42 Logical reads: 765. 50 Block changes: 565. 58 Physical reads: 6. 39 Physical writes: 11. 76 User calls: 0. 11 Parses: 280. 47 Hard parses: 266. 45 Sorts: 15. 29 Logons: 0. 00 Executes: 293. 29 Transactions: 0. 03 % Blocks changed per Read: 73. 88 Rollback per trans %: 0. 00 3/19/2018 Per Transaction 2, 931, 260. 00 29, 089. 00 21, 492. 00 243. 00 447. 00 4. 00 10, 658. 00 10, 125. 00 581. 00 0. 00 11, 145. 00 Recursive Call %: 99. 99 Rows per Sort: 18. 96 17
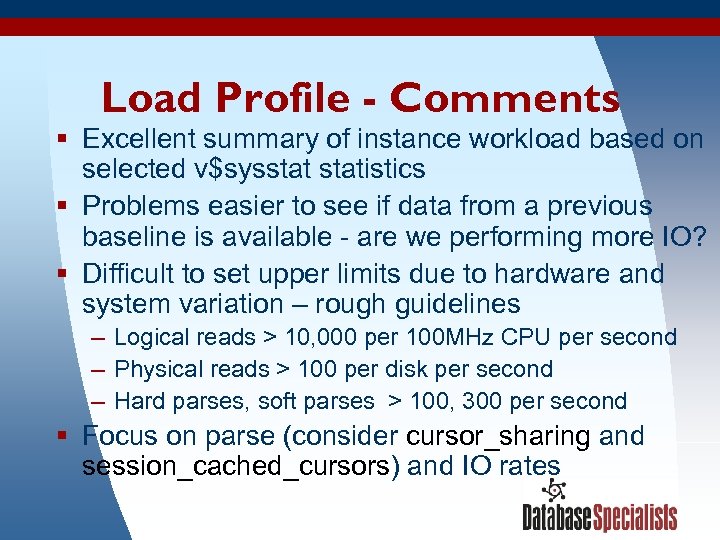 Load Profile - Comments § Excellent summary of instance workload based on selected v$sysstatistics § Problems easier to see if data from a previous baseline is available - are we performing more IO? § Difficult to set upper limits due to hardware and system variation – rough guidelines – Logical reads > 10, 000 per 100 MHz CPU per second – Physical reads > 100 per disk per second – Hard parses, soft parses > 100, 300 per second § Focus on parse (consider cursor_sharing and session_cached_cursors) and IO rates 3/19/2018 18
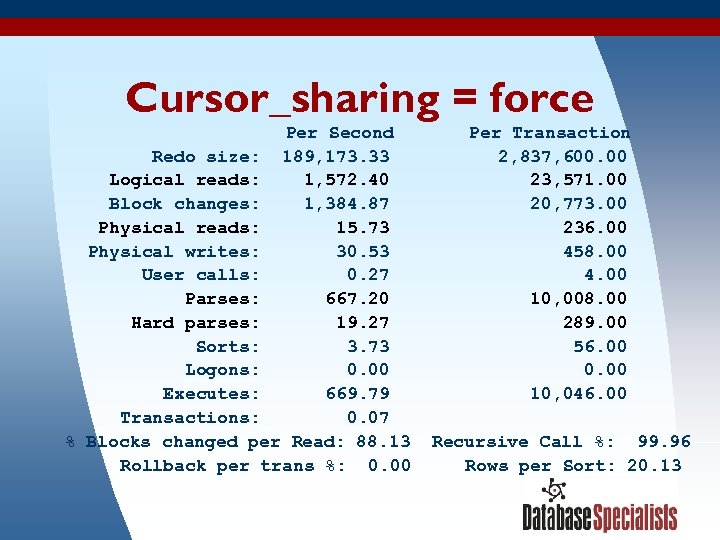 Cursor_sharing = force Per Second Redo size: 189, 173. 33 Logical reads: 1, 572. 40 Block changes: 1, 384. 87 Physical reads: 15. 73 Physical writes: 30. 53 User calls: 0. 27 Parses: 667. 20 Hard parses: 19. 27 Sorts: 3. 73 Logons: 0. 00 Executes: 669. 79 Transactions: 0. 07 % Blocks changed per Read: 88. 13 Rollback per trans %: 0. 00 3/19/2018 Per Transaction 2, 837, 600. 00 23, 571. 00 20, 773. 00 236. 00 458. 00 4. 00 10, 008. 00 289. 00 56. 00 0. 00 10, 046. 00 Recursive Call %: 99. 96 Rows per Sort: 20. 13 19
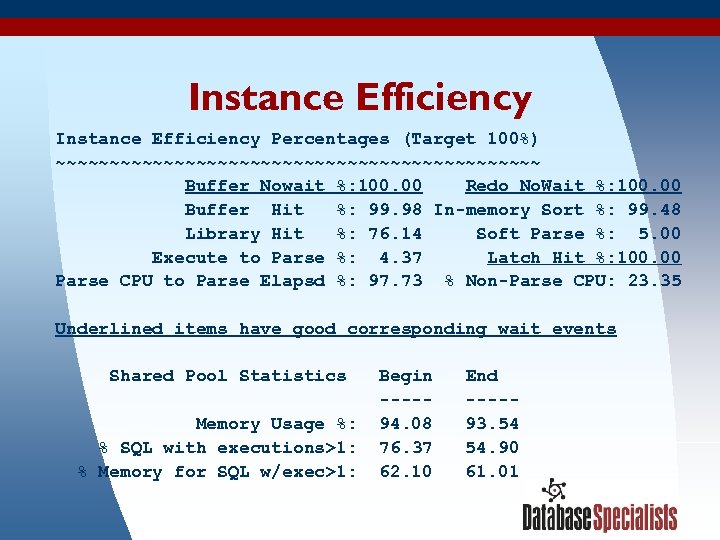 Instance Efficiency Percentages (Target 100%) ~~~~~~~~~~~~~~~~~~~~~~~ Buffer Nowait %: 100. 00 Redo No. Wait %: 100. 00 Buffer Hit %: 99. 98 In-memory Sort %: 99. 48 Library Hit %: 76. 14 Soft Parse %: 5. 00 Execute to Parse %: 4. 37 Latch Hit %: 100. 00 Parse CPU to Parse Elapsd %: 97. 73 % Non-Parse CPU: 23. 35 Underlined items have good corresponding wait events Shared Pool Statistics Memory Usage %: % SQL with executions>1: % Memory for SQL w/exec>1: 3/19/2018 Begin ----94. 08 76. 37 62. 10 End ----93. 54 54. 90 61. 01 20
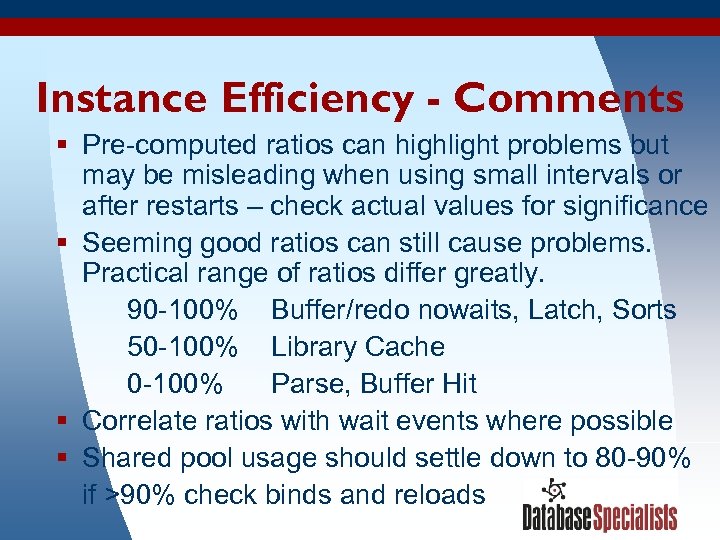 Instance Efficiency - Comments § Pre-computed ratios can highlight problems but may be misleading when using small intervals or after restarts – check actual values for significance § Seeming good ratios can still cause problems. Practical range of ratios differ greatly. 90 -100% Buffer/redo nowaits, Latch, Sorts 50 -100% Library Cache 0 -100% Parse, Buffer Hit § Correlate ratios with wait events where possible § Shared pool usage should settle down to 80 -90% if >90% check binds and reloads 3/19/2018 21
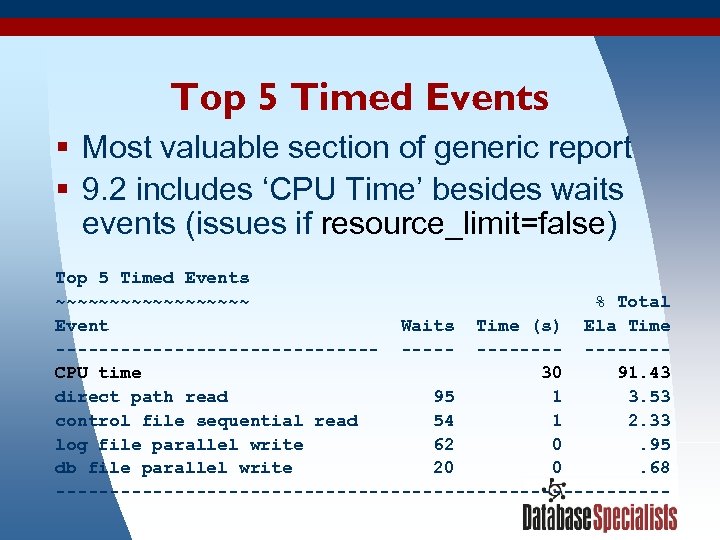 Top 5 Timed Events § Most valuable section of generic report § 9. 2 includes ‘CPU Time’ besides waits events (issues if resource_limit=false) Top 5 Timed Events ~~~~~~~~~ % Total Event Waits Time (s) Ela Time --------------- -------CPU time 30 91. 43 direct path read 95 1 3. 53 control file sequential read 54 1 2. 33 log file parallel write 62 0. 95 db file parallel write 20 0. 68 ----------------------------3/19/2018 22
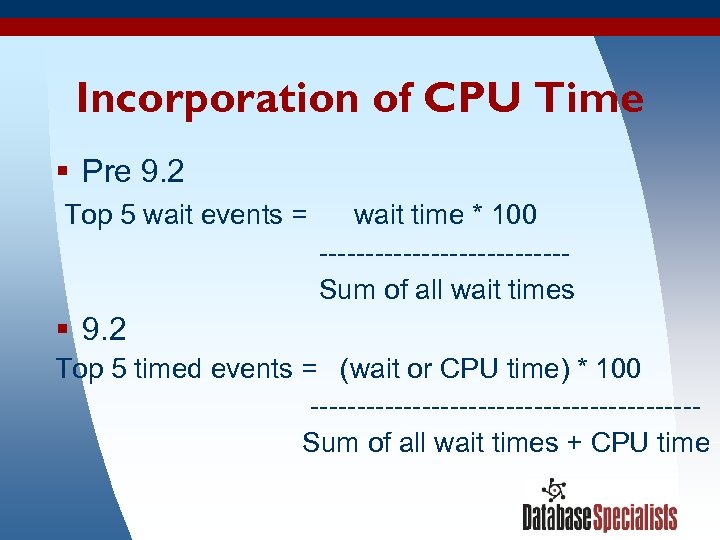 Incorporation of CPU Time § Pre 9. 2 Top 5 wait events = wait time * 100 -------------Sum of all wait times § 9. 2 Top 5 timed events = (wait or CPU time) * 100 ---------------------Sum of all wait times + CPU time 3/19/2018 23
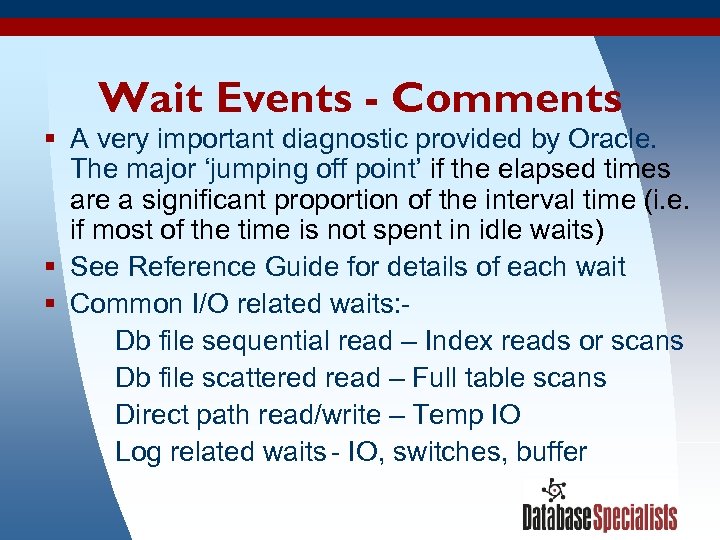 Wait Events - Comments § A very important diagnostic provided by Oracle. The major ‘jumping off point’ if the elapsed times are a significant proportion of the interval time (i. e. if most of the time is not spent in idle waits) § See Reference Guide for details of each wait § Common I/O related waits: Db file sequential read – Index reads or scans Db file scattered read – Full table scans Direct path read/write – Temp IO Log related waits - IO, switches, buffer 3/19/2018 24
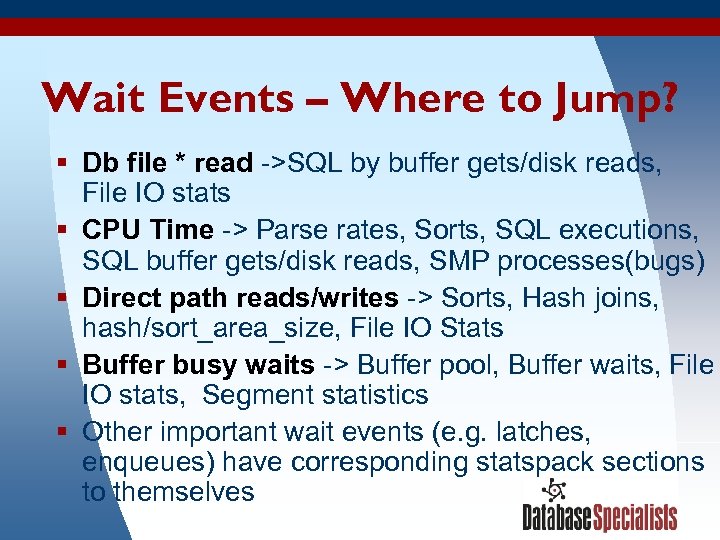 Wait Events – Where to Jump? § Db file * read ->SQL by buffer gets/disk reads, File IO stats § CPU Time -> Parse rates, Sorts, SQL executions, SQL buffer gets/disk reads, SMP processes(bugs) § Direct path reads/writes -> Sorts, Hash joins, hash/sort_area_size, File IO Stats § Buffer busy waits -> Buffer pool, Buffer waits, File IO stats, Segment statistics § Other important wait events (e. g. latches, enqueues) have corresponding statspack sections to themselves 3/19/2018 25
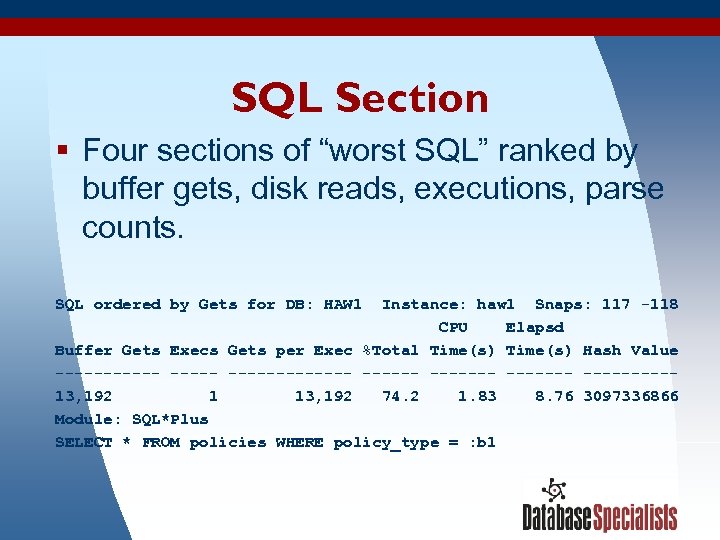 SQL Section § Four sections of “worst SQL” ranked by buffer gets, disk reads, executions, parse counts. SQL ordered by Gets for DB: HAW 1 Instance: haw 1 Snaps: 117 -118 CPU Elapsd Buffer Gets Execs Gets per Exec %Total Time(s) Hash Value --------- ---------13, 192 1 13, 192 74. 2 1. 83 8. 76 3097336866 Module: SQL*Plus SELECT * FROM policies WHERE policy_type = : b 1 3/19/2018 26
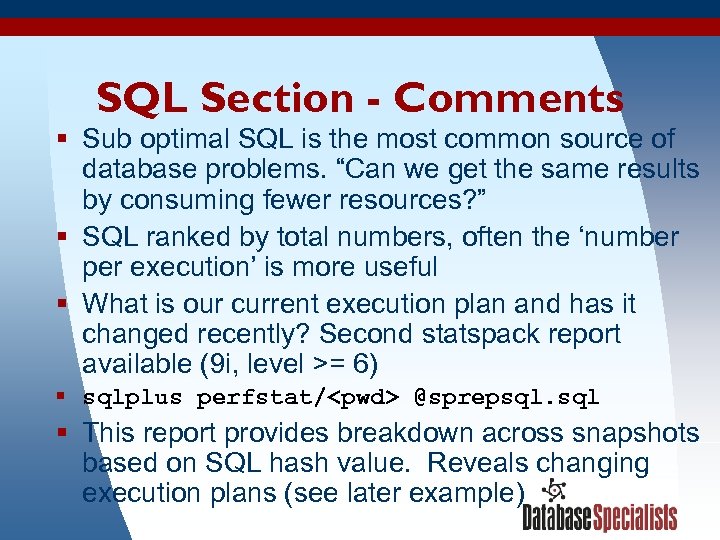 SQL Section - Comments § Sub optimal SQL is the most common source of database problems. “Can we get the same results by consuming fewer resources? ” § SQL ranked by total numbers, often the ‘number per execution’ is more useful § What is our current execution plan and has it changed recently? Second statspack report available (9 i, level >= 6) § sqlplus perfstat/
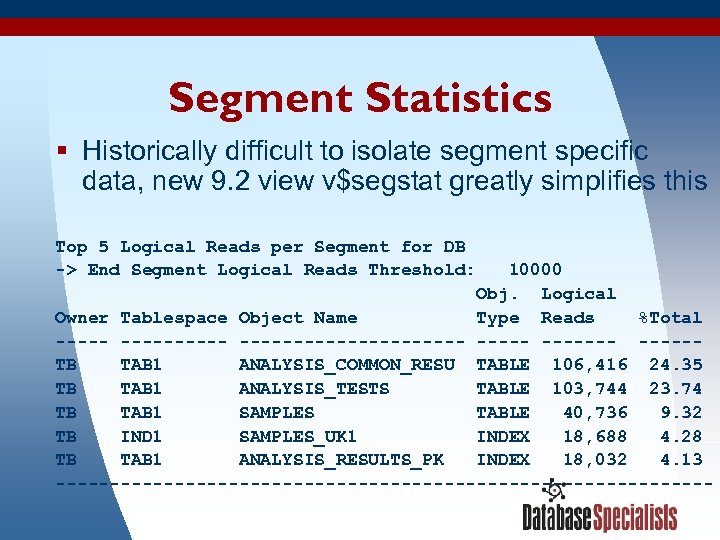 Segment Statistics § Historically difficult to isolate segment specific data, new 9. 2 view v$segstat greatly simplifies this Top 5 Logical Reads per Segment for DB -> End Segment Logical Reads Threshold: 10000 Obj. Logical Owner Tablespace Object Name Type Reads %Total ----------- -------TB TAB 1 ANALYSIS_COMMON_RESU TABLE 106, 416 24. 35 TB TAB 1 ANALYSIS_TESTS TABLE 103, 744 23. 74 TB TAB 1 SAMPLES TABLE 40, 736 9. 32 TB IND 1 SAMPLES_UK 1 INDEX 18, 688 4. 28 TB TAB 1 ANALYSIS_RESULTS_PK INDEX 18, 032 4. 13 ------------------------------3/19/2018 28
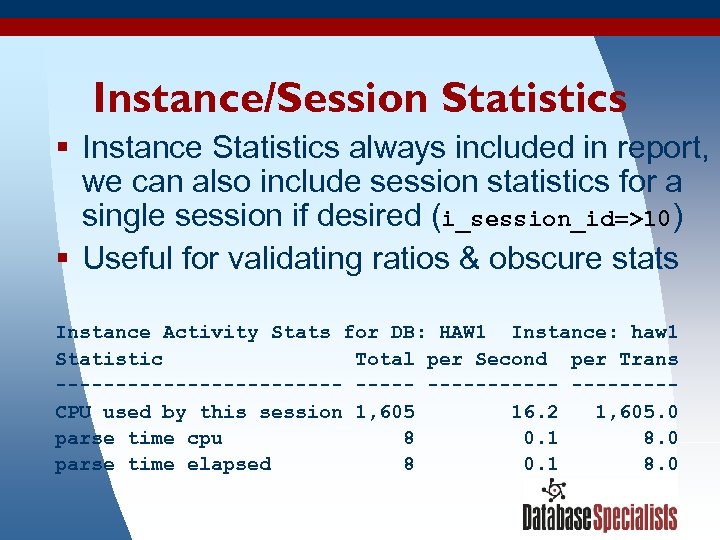 Instance/Session Statistics § Instance Statistics always included in report, we can also include session statistics for a single session if desired (i_session_id=>10) § Useful for validating ratios & obscure stats Instance Activity Stats for DB: HAW 1 Instance: haw 1 Statistic Total per Second per Trans ------------ ----CPU used by this session 1, 605 16. 2 1, 605. 0 parse time cpu 8 0. 1 8. 0 parse time elapsed 8 0. 1 8. 0 3/19/2018 29
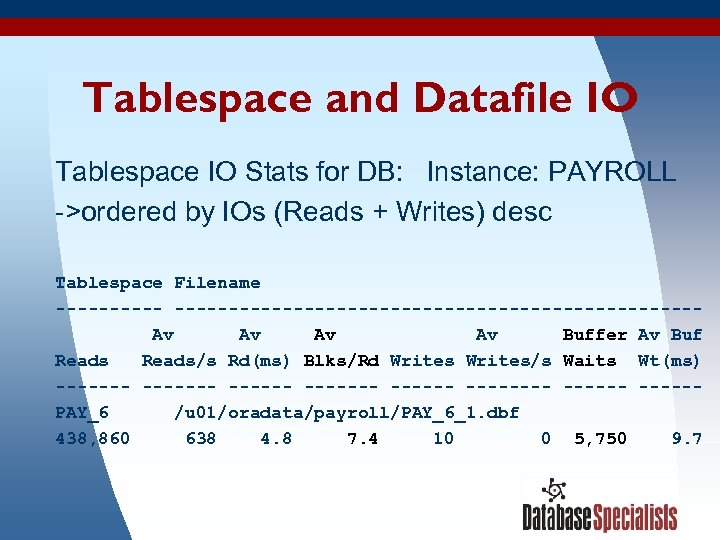 Tablespace and Datafile IO Tablespace IO Stats for DB: Instance: PAYROLL ->ordered by IOs (Reads + Writes) desc Tablespace Filename -----------------------------Av Av Buffer Av Buf Reads/s Rd(ms) Blks/Rd Writes/s Waits Wt(ms) ------- --------PAY_6 /u 01/oradata/payroll/PAY_6_1. dbf 438, 860 638 4. 8 7. 4 10 0 5, 750 9. 7 3/19/2018 30
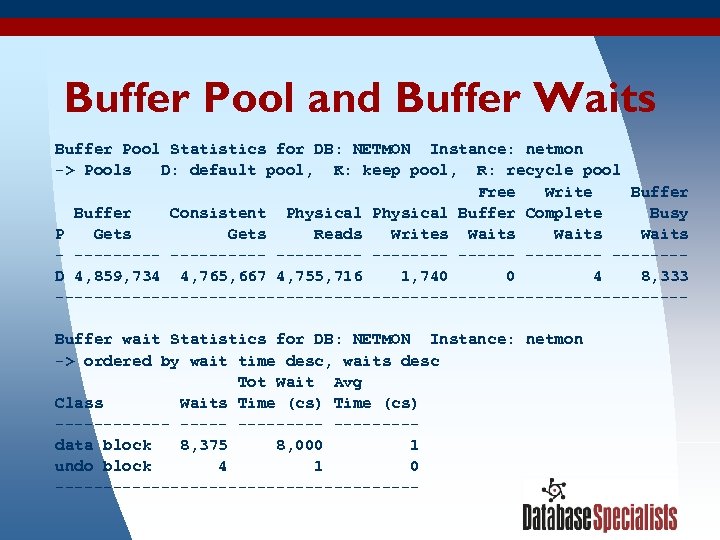 Buffer Pool and Buffer Waits Buffer Pool Statistics for DB: NETMON Instance: netmon -> Pools D: default pool, K: keep pool, R: recycle pool Free Write Buffer Consistent Physical Buffer Complete Busy P Gets Reads Writes Waits - ---------- --------D 4, 859, 734 4, 765, 667 4, 755, 716 1, 740 0 4 8, 333 ---------------------------------Buffer wait Statistics for DB: NETMON Instance: netmon -> ordered by wait time desc, waits desc Tot Wait Avg Class Waits Time (cs) --------- ----data block 8, 375 8, 000 1 undo block 4 1 0 -------------------3/19/2018 31
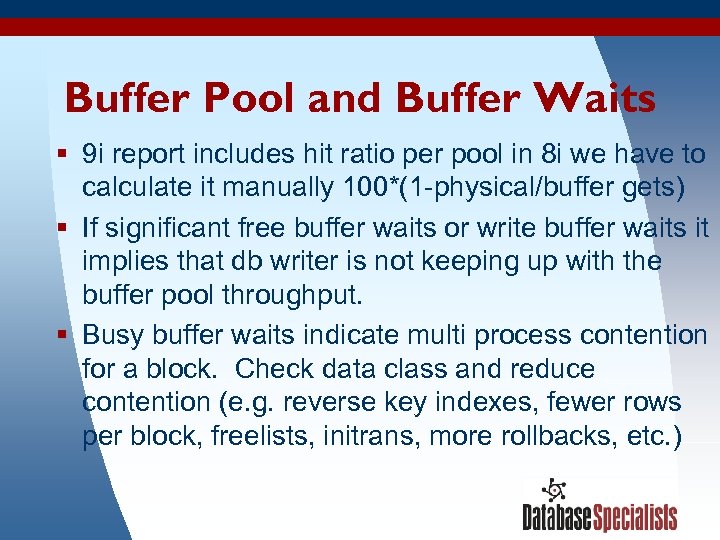 Buffer Pool and Buffer Waits § 9 i report includes hit ratio per pool in 8 i we have to calculate it manually 100*(1 -physical/buffer gets) § If significant free buffer waits or write buffer waits it implies that db writer is not keeping up with the buffer pool throughput. § Busy buffer waits indicate multi process contention for a block. Check data class and reduce contention (e. g. reverse key indexes, fewer rows per block, freelists, initrans, more rollbacks, etc. ) 3/19/2018 32
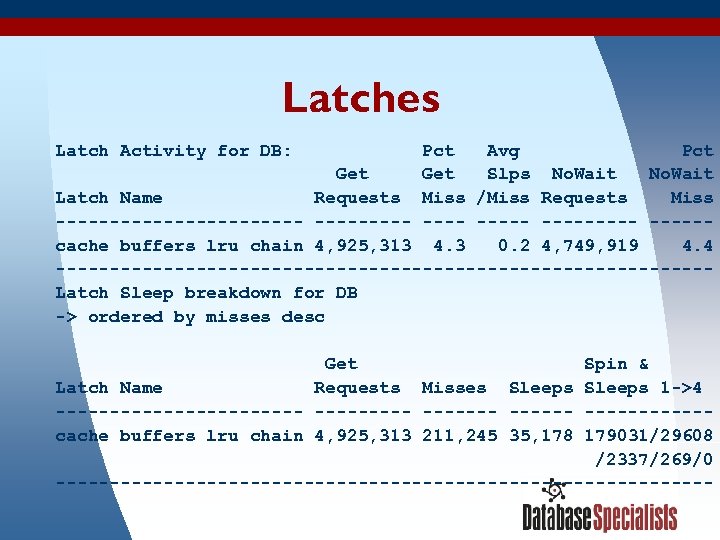 Latches Latch Activity for DB: Pct Avg Pct Get Slps No. Wait Latch Name Requests Miss /Miss Requests Miss ------------ ----- -----cache buffers lru chain 4, 925, 313 4. 3 0. 2 4, 749, 919 4. 4 ------------------------------Latch Sleep breakdown for DB -> ordered by misses desc Get Spin & Latch Name Requests Misses Sleeps 1 ->4 ------------ ------cache buffers lru chain 4, 925, 313 211, 245 35, 178 179031/29608 /2337/269/0 ------------------------------3/19/2018 33
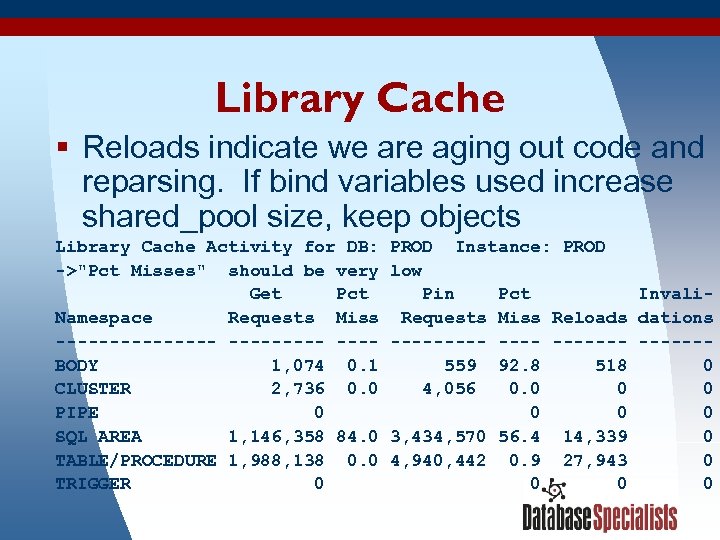 Library Cache § Reloads indicate we are aging out code and reparsing. If bind variables used increase shared_pool size, keep objects Library Cache Activity for DB: ->"Pct Misses" should be very Get Pct Namespace Requests Miss -------- ---BODY 1, 074 0. 1 CLUSTER 2, 736 0. 0 PIPE 0 SQL AREA 1, 146, 358 84. 0 TABLE/PROCEDURE 1, 988, 138 0. 0 TRIGGER 0 3/19/2018 PROD Instance: PROD low Pin Pct Invali. Requests Miss Reloads dations ------- ------559 92. 8 518 0 4, 056 0. 0 0 0 3, 434, 570 56. 4 14, 339 0 4, 940, 442 0. 9 27, 943 0 0 34
 Session Topics § Statspack introduction and features § Mechanics – installing – generating snapshots – producing reports § Discussion of the generic report § Examples 3/19/2018 35
 Examples 1. 2. 3. 4. 5. Monitoring Madness Out of Sorts Distributed SQL Changing Plans Freelists and 9 i Auto Managed Segment 3/19/2018 36
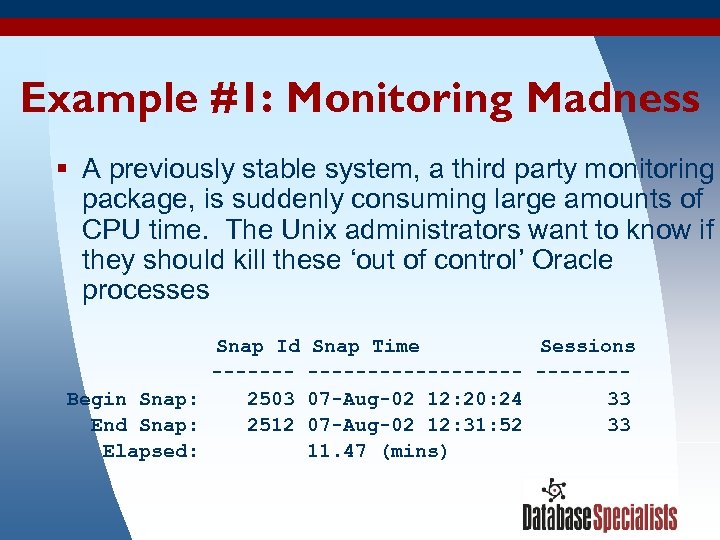 Example #1: Monitoring Madness § A previously stable system, a third party monitoring package, is suddenly consuming large amounts of CPU time. The Unix administrators want to know if they should kill these ‘out of control’ Oracle processes Snap Id ------Begin Snap: 2503 End Snap: 2512 Elapsed: 3/19/2018 Snap Time Sessions ---------07 -Aug-02 12: 20: 24 33 07 -Aug-02 12: 31: 52 33 11. 47 (mins) 37
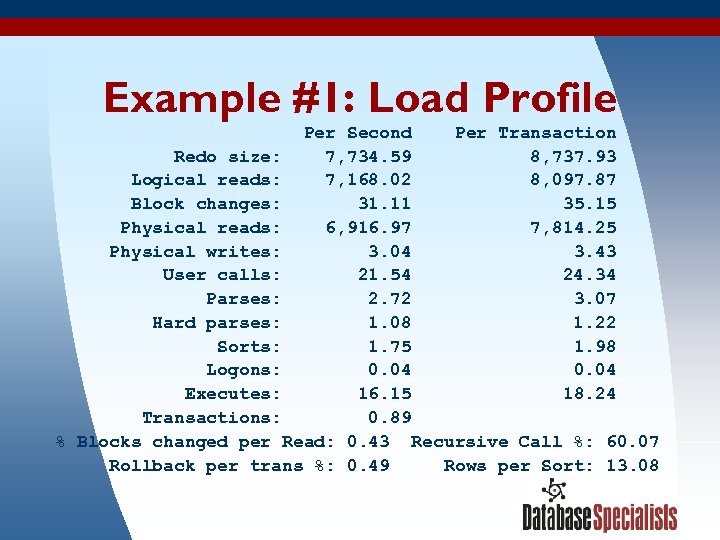 Example #1: Load Profile Per Second Per Transaction Redo size: 7, 734. 59 8, 737. 93 Logical reads: 7, 168. 02 8, 097. 87 Block changes: 31. 11 35. 15 Physical reads: 6, 916. 97 7, 814. 25 Physical writes: 3. 04 3. 43 User calls: 21. 54 24. 34 Parses: 2. 72 3. 07 Hard parses: 1. 08 1. 22 Sorts: 1. 75 1. 98 Logons: 0. 04 Executes: 16. 15 18. 24 Transactions: 0. 89 % Blocks changed per Read: 0. 43 Recursive Call %: 60. 07 Rollback per trans %: 0. 49 Rows per Sort: 13. 08 3/19/2018 38
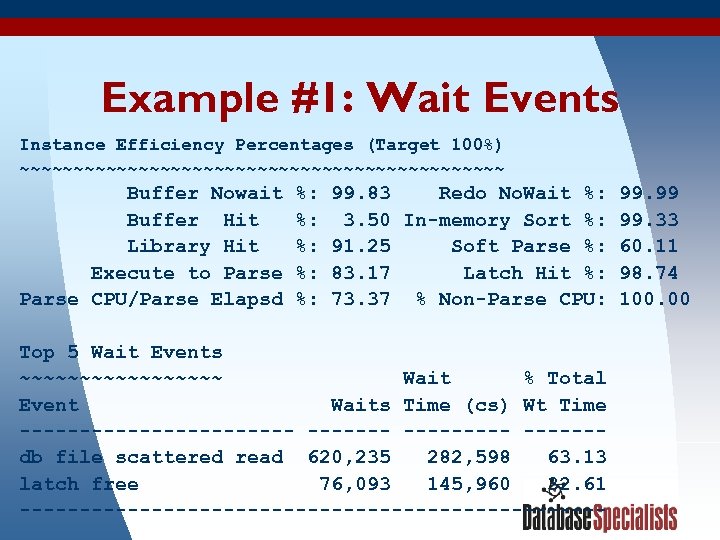 Example #1: Wait Events Instance Efficiency Percentages (Target 100%) ~~~~~~~~~~~~~~~~~~~~~~~ Buffer Nowait Buffer Hit Library Hit Execute to Parse CPU/Parse Elapsd %: %: %: 99. 83 Redo No. Wait %: 99. 99 3. 50 In-memory Sort %: 99. 33 91. 25 Soft Parse %: 60. 11 83. 17 Latch Hit %: 98. 74 73. 37 % Non-Parse CPU: 100. 00 Top 5 Wait Events ~~~~~~~~~ Wait % Total Event Waits Time (cs) Wt Time ------------ ------db file scattered read 620, 235 282, 598 63. 13 latch free 76, 093 145, 960 32. 61 3/19/2018 ------------------------- 39
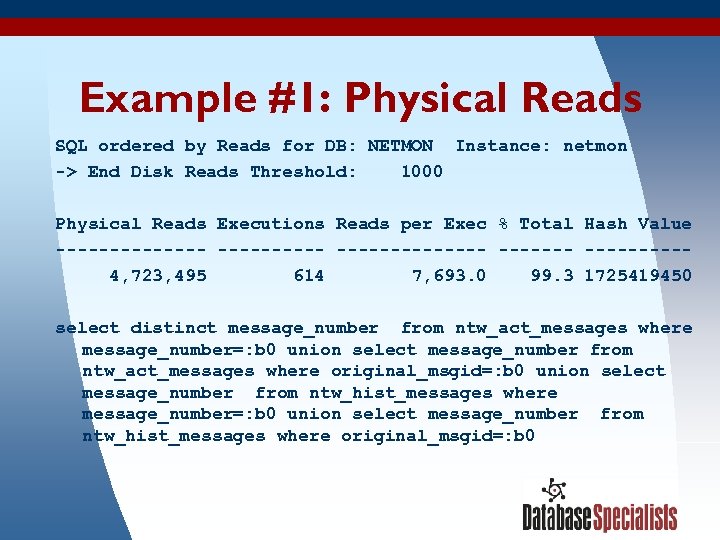 Example #1: Physical Reads SQL ordered by Reads for DB: NETMON Instance: netmon -> End Disk Reads Threshold: 1000 Physical Reads Executions Reads per Exec % Total Hash Value ----------------4, 723, 495 614 7, 693. 0 99. 3 1725419450 select distinct message_number from ntw_act_messages where message_number=: b 0 union select message_number from ntw_act_messages where original_msgid=: b 0 union select message_number from ntw_hist_messages where message_number=: b 0 union select message_number from ntw_hist_messages where original_msgid=: b 0 3/19/2018 40
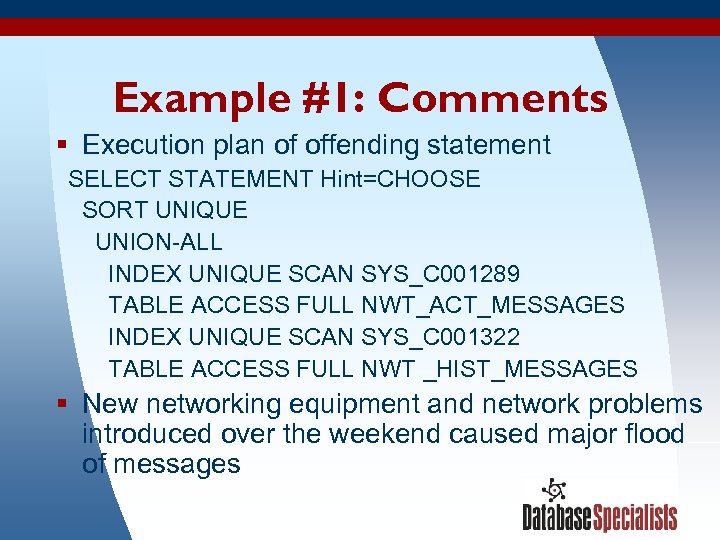 Example #1: Comments § Execution plan of offending statement SELECT STATEMENT Hint=CHOOSE SORT UNIQUE UNION-ALL INDEX UNIQUE SCAN SYS_C 001289 TABLE ACCESS FULL NWT_ACT_MESSAGES INDEX UNIQUE SCAN SYS_C 001322 TABLE ACCESS FULL NWT _HIST_MESSAGES § New networking equipment and network problems introduced over the weekend caused major flood of messages 3/19/2018 41
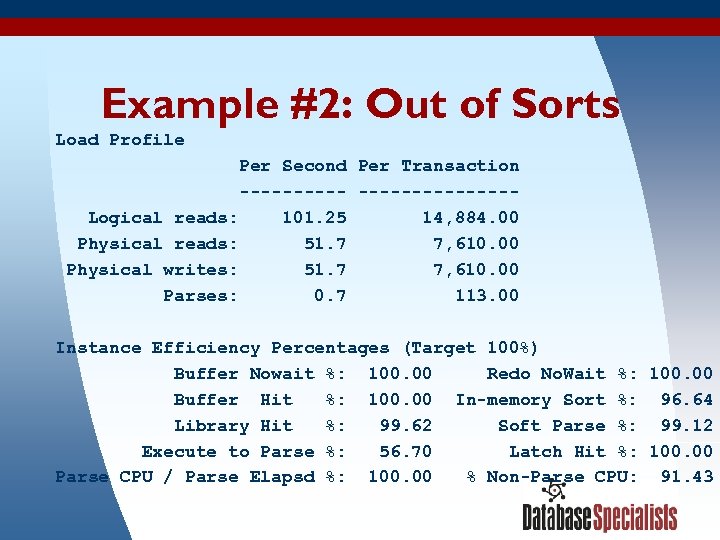 Example #2: Out of Sorts Load Profile Per Second Per Transaction --------------Logical reads: 101. 25 14, 884. 00 Physical reads: 51. 7 7, 610. 00 Physical writes: 51. 7 7, 610. 00 Parses: 0. 7 113. 00 Instance Efficiency Percentages (Target 100%) Buffer Nowait %: 100. 00 Redo No. Wait %: 100. 00 Buffer Hit %: 100. 00 In-memory Sort %: 96. 64 Library Hit %: 99. 62 Soft Parse %: 99. 12 Execute to Parse %: 56. 70 Latch Hit %: 100. 00 Parse CPU / Parse Elapsd %: 100. 00 % Non-Parse CPU: 91. 43 3/19/2018 42
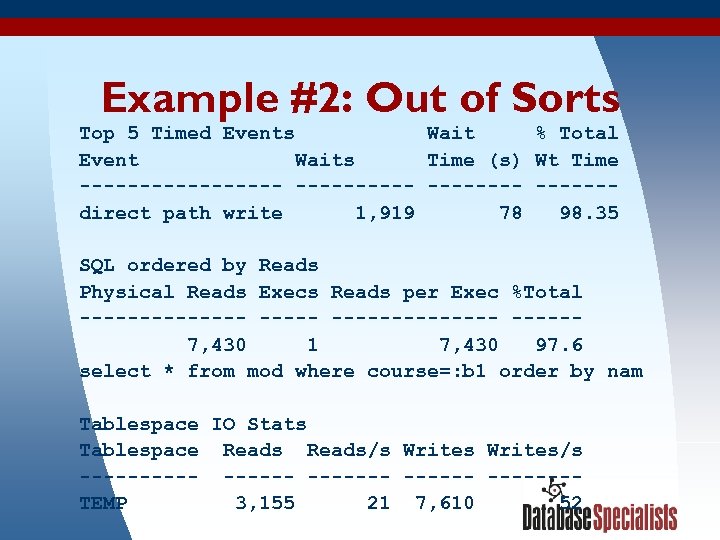 Example #2: Out of Sorts Top 5 Timed Events Wait % Total Event Waits Time (s) Wt Time --------- ------direct path write 1, 919 78 98. 35 SQL ordered by Reads Physical Reads Execs Reads per Exec %Total --------------7, 430 1 7, 430 97. 6 select * from mod where course=: b 1 order by nam Tablespace IO Stats Tablespace Reads/s Writes/s ------ -------TEMP 3, 155 21 7, 610 52 3/19/2018 43
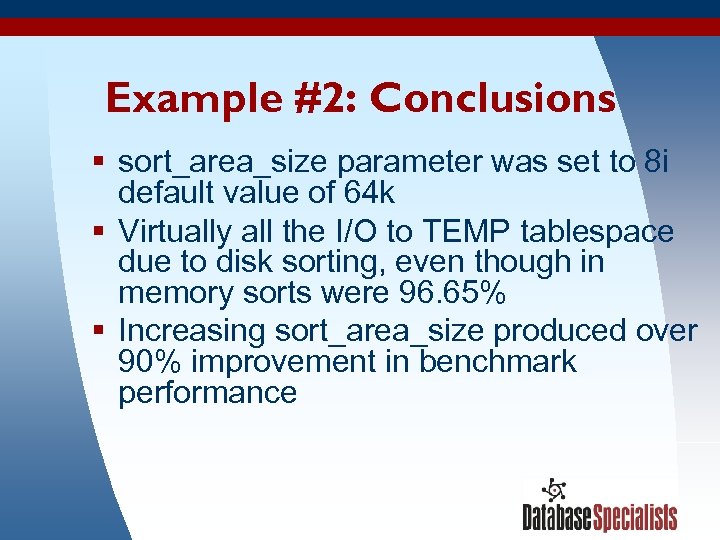 Example #2: Conclusions § sort_area_size parameter was set to 8 i default value of 64 k § Virtually all the I/O to TEMP tablespace due to disk sorting, even though in memory sorts were 96. 65% § Increasing sort_area_size produced over 90% improvement in benchmark performance 3/19/2018 44
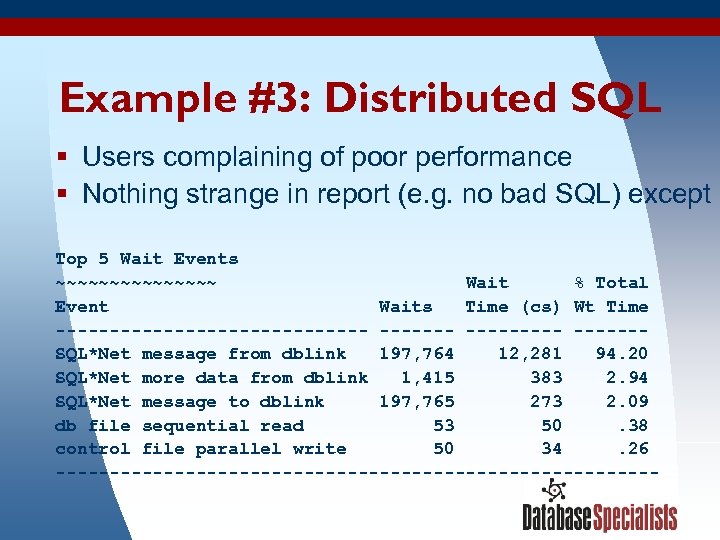 Example #3: Distributed SQL § Users complaining of poor performance § Nothing strange in report (e. g. no bad SQL) except Top 5 Wait Events ~~~~~~~~ Wait % Total Event Waits Time (cs) Wt Time --------------- ------SQL*Net message from dblink 197, 764 12, 281 94. 20 SQL*Net more data from dblink 1, 415 383 2. 94 SQL*Net message to dblink 197, 765 273 2. 09 db file sequential read 53 50. 38 control file parallel write 50 34. 26 ----------------------------3/19/2018 45
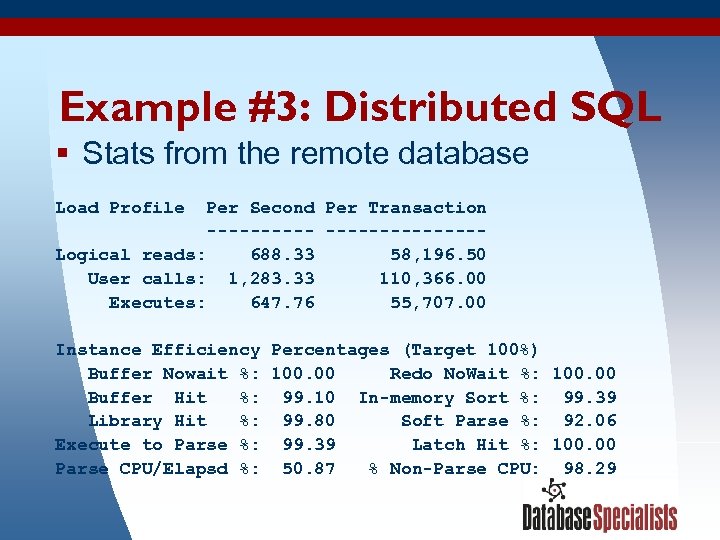 Example #3: Distributed SQL § Stats from the remote database Load Profile Per Second Per Transaction --------------Logical reads: 688. 33 58, 196. 50 User calls: 1, 283. 33 110, 366. 00 Executes: 647. 76 55, 707. 00 Instance Efficiency Percentages (Target 100%) Buffer Nowait %: 100. 00 Redo No. Wait %: 100. 00 Buffer Hit %: 99. 10 In-memory Sort %: 99. 39 Library Hit %: 99. 80 Soft Parse %: 92. 06 Execute to Parse %: 99. 39 Latch Hit %: 100. 00 Parse CPU/Elapsd %: 50. 87 % Non-Parse CPU: 98. 29 3/19/2018 46
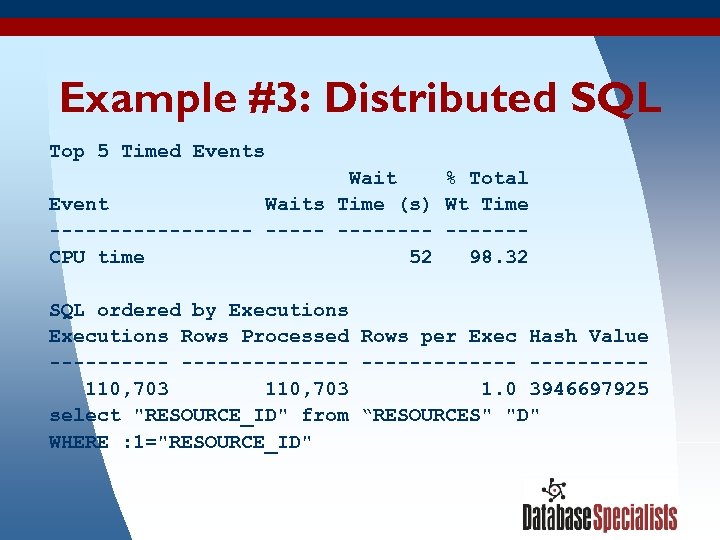 Example #3: Distributed SQL Top 5 Timed Events Wait % Total Event Waits Time (s) Wt Time --------- ------CPU time 52 98. 32 SQL ordered by Executions Rows Processed Rows per Exec Hash Value --------------110, 703 1. 0 3946697925 select "RESOURCE_ID" from “RESOURCES" "D" WHERE : 1="RESOURCE_ID" 3/19/2018 47
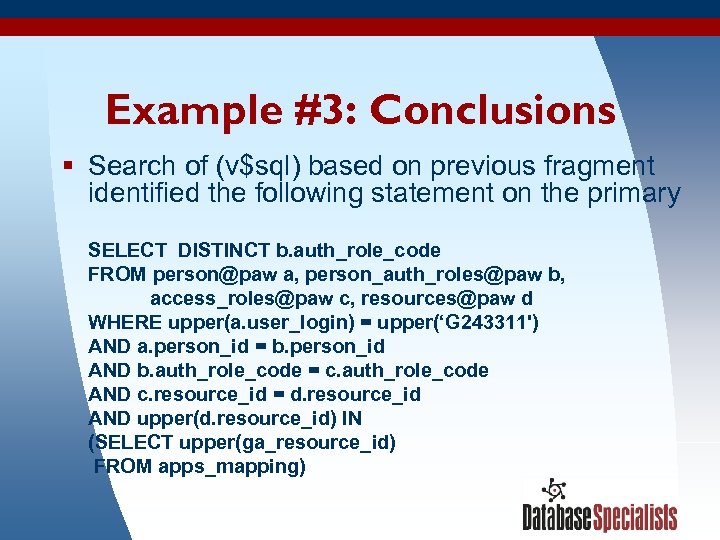 Example #3: Conclusions § Search of (v$sql) based on previous fragment identified the following statement on the primary SELECT DISTINCT b. auth_role_code FROM person@paw a, person_auth_roles@paw b, access_roles@paw c, resources@paw d WHERE upper(a. user_login) = upper(‘G 243311') AND a. person_id = b. person_id AND b. auth_role_code = c. auth_role_code AND c. resource_id = d. resource_id AND upper(d. resource_id) IN (SELECT upper(ga_resource_id) FROM apps_mapping) 3/19/2018 48
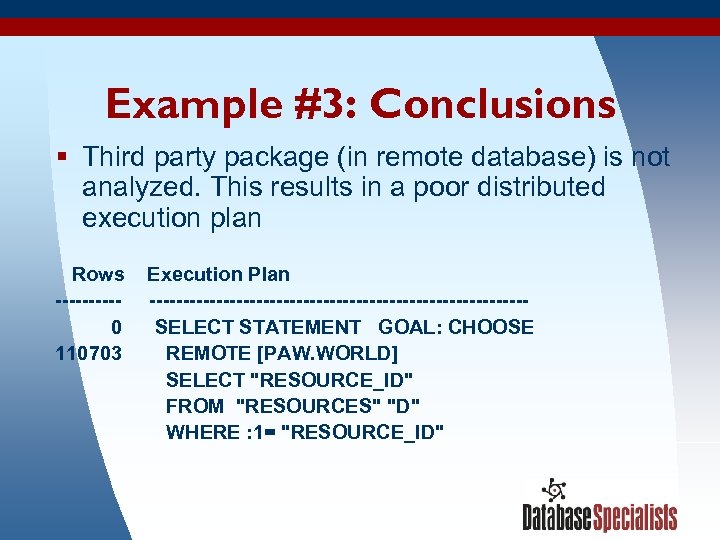 Example #3: Conclusions § Third party package (in remote database) is not analyzed. This results in a poor distributed execution plan Rows -----0 110703 3/19/2018 Execution Plan ----------------------------SELECT STATEMENT GOAL: CHOOSE REMOTE [PAW. WORLD] SELECT "RESOURCE_ID" FROM "RESOURCES" "D" WHERE : 1= "RESOURCE_ID" 49
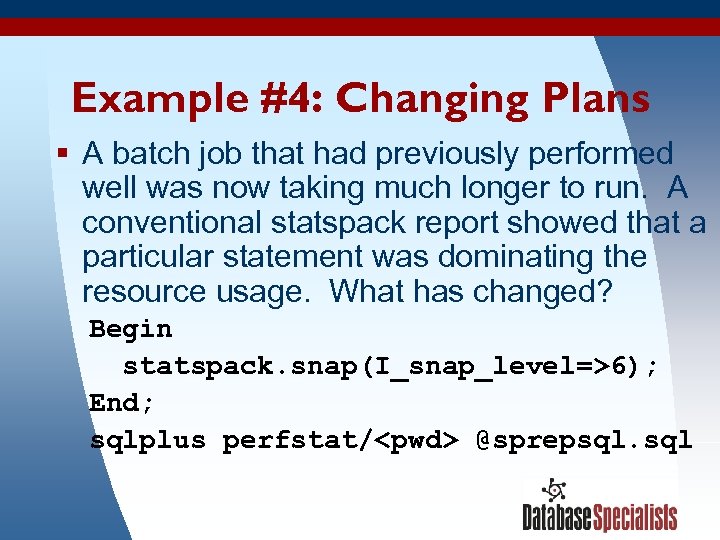 Example #4: Changing Plans § A batch job that had previously performed well was now taking much longer to run. A conventional statspack report showed that a particular statement was dominating the resource usage. What has changed? Begin statspack. snap(I_snap_level=>6); End; sqlplus perfstat/
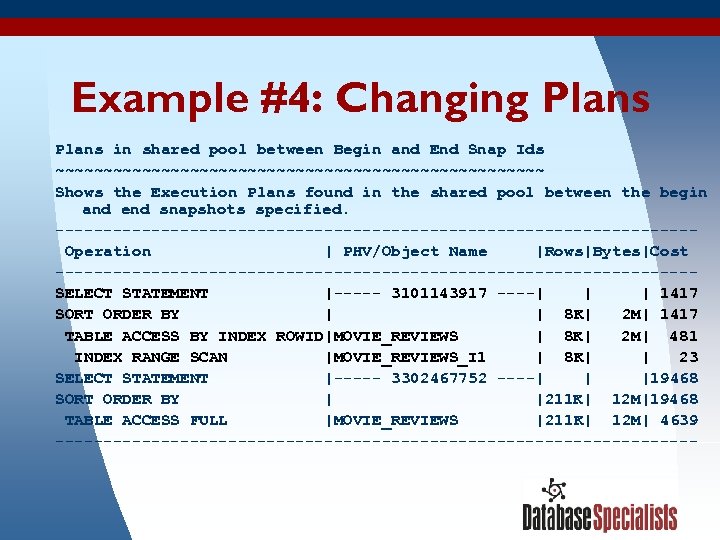 Example #4: Changing Plans in shared pool between Begin and End Snap Ids ~~~~~~~~~~~~~~~~~~~~~~~~~~ Shows the Execution Plans found in the shared pool between the begin and end snapshots specified. ---------------------------------Operation | PHV/Object Name |Rows|Bytes|Cost ---------------------------------SELECT STATEMENT |----- 3101143917 ----| | | 1417 SORT ORDER BY | | 8 K| 2 M| 1417 TABLE ACCESS BY INDEX ROWID|MOVIE_REVIEWS | 8 K| 2 M| 481 INDEX RANGE SCAN |MOVIE_REVIEWS_I 1 | 8 K| | 23 SELECT STATEMENT |----- 3302467752 ----| | |19468 SORT ORDER BY | |211 K| 12 M|19468 TABLE ACCESS FULL |MOVIE_REVIEWS |211 K| 12 M| 4639 ---------------------------------- 3/19/2018 51
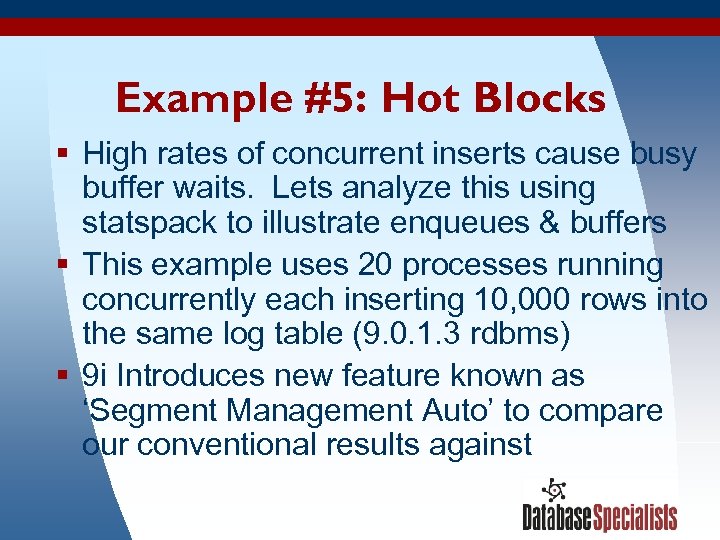 Example #5: Hot Blocks § High rates of concurrent inserts cause busy buffer waits. Lets analyze this using statspack to illustrate enqueues & buffers § This example uses 20 processes running concurrently each inserting 10, 000 rows into the same log table (9. 0. 1. 3 rdbms) § 9 i Introduces new feature known as ‘Segment Management Auto’ to compare our conventional results against 3/19/2018 52
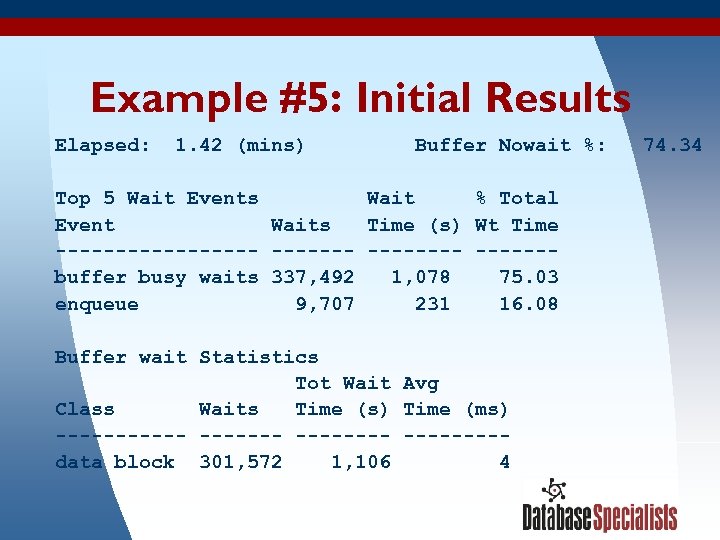 Example #5: Initial Results Elapsed: 1. 42 (mins) Buffer Nowait %: 74. 34 Top 5 Wait Events Wait % Total Event Waits Time (s) Wt Time --------- ------buffer busy waits 337, 492 1, 078 75. 03 enqueue 9, 707 231 16. 08 Buffer wait Statistics Tot Wait Avg Class Waits Time (s) Time (ms) -------- ----data block 301, 572 1, 106 4 3/19/2018 53
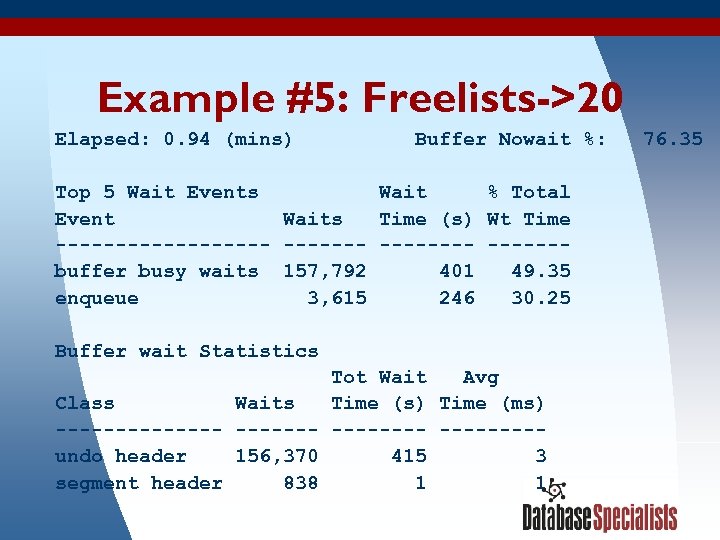 Example #5: Freelists->20 Elapsed: 0. 94 (mins) Buffer Nowait %: 76. 35 Top 5 Wait Events Wait % Total Event Waits Time (s) Wt Time --------- ------buffer busy waits 157, 792 401 49. 35 enqueue 3, 615 246 30. 25 Buffer wait Statistics Tot Wait Avg Class Waits Time (s) Time (ms) -------- ----undo header 156, 370 415 3 segment header 838 1 1 3/19/2018 54
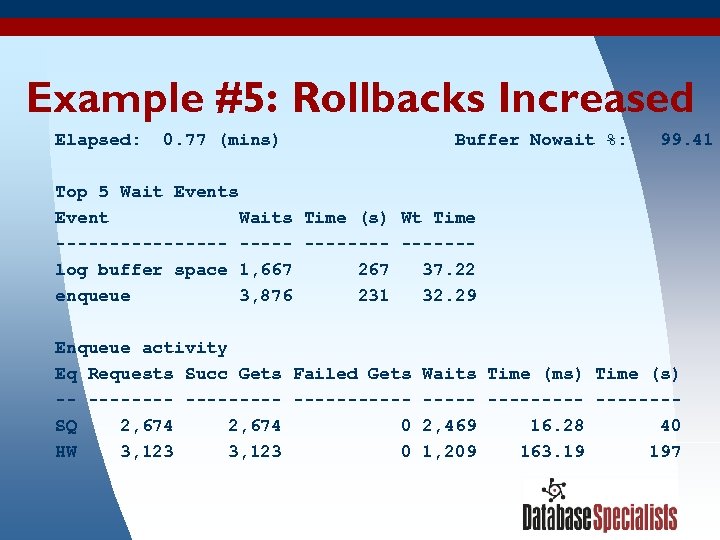 Example #5: Rollbacks Increased Elapsed: 0. 77 (mins) Buffer Nowait %: 99. 41 Top 5 Wait Events Event Waits Time (s) Wt Time -------- ------log buffer space 1, 667 267 37. 22 enqueue 3, 876 231 32. 29 Enqueue activity Eq Requests Succ Gets Failed Gets -- ---------SQ 2, 674 0 HW 3, 123 0 3/19/2018 Waits Time (ms) Time (s) ---------2, 469 16. 28 40 1, 209 163. 19 197 55
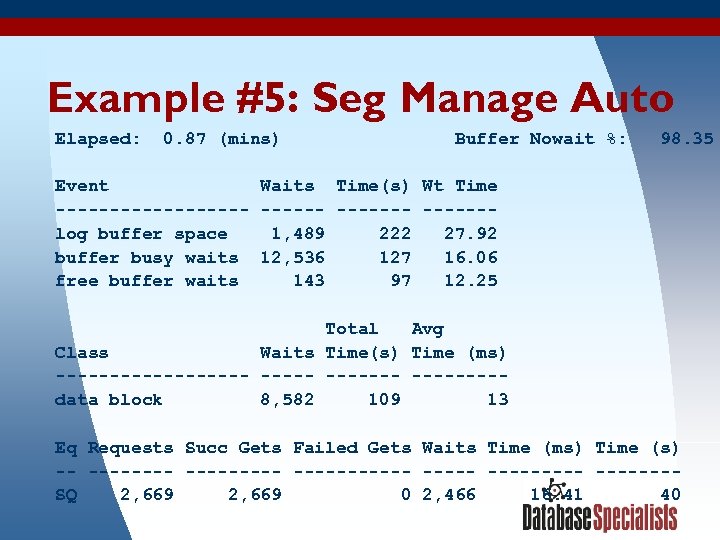 Example #5: Seg Manage Auto Elapsed: 0. 87 (mins) Buffer Nowait %: 98. 35 Event Waits Time(s) Wt Time --------- ------log buffer space 1, 489 222 27. 92 buffer busy waits 12, 536 127 16. 06 free buffer waits 143 97 12. 25 Total Avg Class Waits Time(s) Time (ms) --------- ----data block 8, 582 109 13 Eq Requests Succ Gets Failed Gets Waits Time (ms) Time (s) -- --------- -------SQ 2, 669 0 2, 466 16. 41 40 3/19/2018 56
 References § Two Oracle whitepapers ‘Performance Tuning With Statspack, Part I & II’ § Ch 10, ‘Expert one-on-one Oracle’ Tom Kyte § Statspack readme spdoc. txt § http: //www. oraperf. com provides free automated analysis of Statspack reports 3/19/2018 57
 Contact Information Ian Jones Database Specialists, Inc. 388 Market Street, Suite 400 San Francisco, CA 94111 Tel: 415/344 -0500 Email: ijones@dbspecialists. com Web: www. dbspecialists. com 3/19/2018 58


