

cf8a6b2227c79c16493973d5b1861bf6.ppt
- Количество слайдов: 11
 Using results from revisions analysis to improve compilation methods: a case study on revisions of Dutch estimates of GDP volume growth Contribution to the joint OECD/Eurostat Task Force on “Performing Revisions Analysis for Sub-Annual Economic Statistics” Leendert Hoven Statistics Netherlands
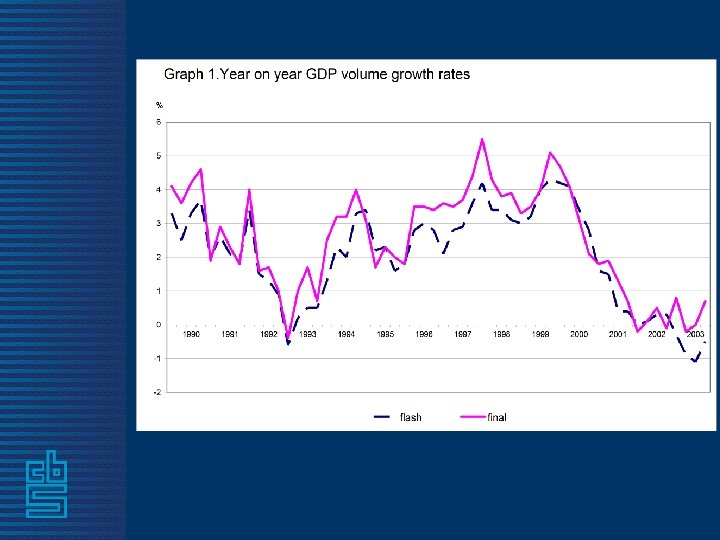
 Subsequent estimates of GDP growth Quarterly Accounts, flash after 45 days Quarterly Accounts, regular after 90 days Yearly estimate, based on QA April t+1 National Accounts, provisional July t+1 National Accounts, revised provisional July t+2 National Accounts, final July t+3
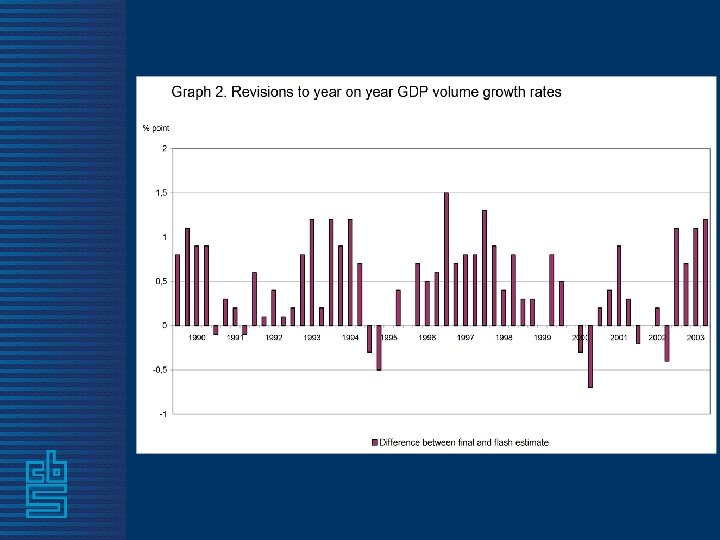
 Summary statistics mean revision mean absolute revision Flash – QA regular 0. 06 0. 23 QA regular – NA 1 st annual estimate 0. 07 0. 15 NA 1 st annual estimate – NA provisional 0, 10 0. 32 NA provisional – NA revised provisional 0. 04 0, 22 NA revised provisional – NA final 0. 20 0. 26 Flash – NA final 0. 47 0. 58
 Graph 3. Mean revision and mean absolute revision between consecutive estimates of GDP volume growth, 1990 – 2003
 Average contribution of components to revision of GDP growth between QA regular and NA final, 1990 -1998 production approach weight % contribution % agriculture, hunting, forestry, fishing 3 15 mining & quarrying 2 7 industry 15 -4 electricity, gas & water 2 -3 construction 5 -18 wholesale, retail trade, repair, hotels &restaurants 14 30 transport, storage, communications 7 20 financial intermediation & business services 24 35 government 11 10 banking services 10 12 health & social care, other services 10 1
 Average contribution of components to revision of GDP growth between QA regular and NA final, 19901998 expenditure approach weight contribution household final consumption expenditure 49 51 government consumption expenditure 24 24 gross fixed capital formation 23 -11 exports minus imports 4 15 changes in inventories 0 27
 Two important findings qbiggest mean revision between revised provisional estimate and final estimate. Quite large differences between short-term statistics and structural business statistics. Methodological shortcomings (matched pairs approach sts insufficiently allows for effects of population dynamics). q within production approach, commercial services and trade have contributed most to the revisions of GDP growth; short-term source situation particularly bad.
 How can we improve early estimates? qimprove methodology short-term statistics q improve short-term source situation for commercial services and trade q more research needed on: o validity different assumptions; o effects of balancing process; o ………………. . o. . .
 Bias correction at the aggregate level? q no guarantee that average bias of past period will also hold in the future q ignores the underlying data and subaggregates q impact of introduction mew methodologies, changes in data collection, sampling or data processing difficult to capture in the short term