6d5fdc149374e43975bc3117c25dae0b.ppt
- Количество слайдов: 87
 Using Performance Improvement to Improve Patient Outcomes Denise Murphy RN, MPH, CIC Vice President, Quality and Patient Safety, Main Line Health System September 2009
 Performance Improvement • Performance Improvement is the process of designing or selecting interventions which may include training directed toward a change in behavior, typically on the job. • PI is a systematic process of discovering and analyzing human performance gaps, planning for future improvements in human performance, designing and developing cost-effective and ethically -justifiable interventions to close performance gaps, implementing the interventions, and evaluating the financial and non-financial results.
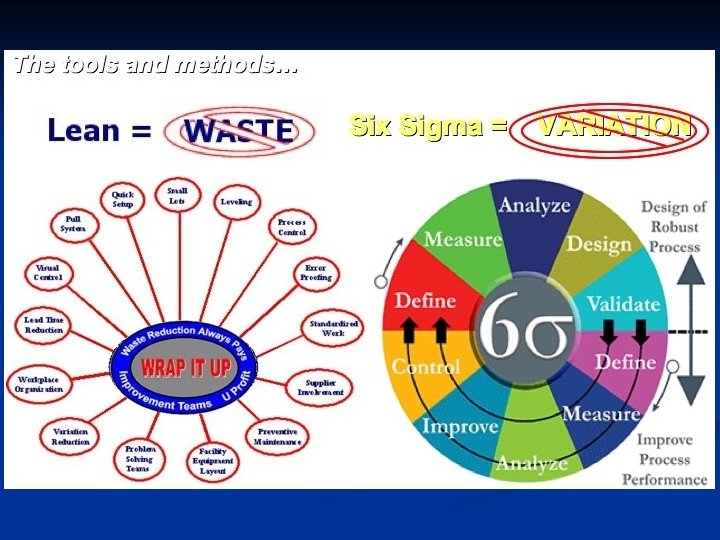
 Performance Improvement: Art or Science? • • • PDCA/PDSA Six Sigma: DMAIC Toyota Production System (TPS) “Lean” Engineering: Get the waste out! Lean Six Sigma – the hybrid (Lean on the DMAIC framework) General Electric’s Express Workout These approaches to PI are nothing without Change Mgt! Bottom line…Improvement work in health care is getting much more analytical and based on scientific and mathematical principles!
 Change Management • Change management is the practice of administering changes with the help of tested methods and techniques in order to avoid new errors and minimize the impact of changes on an organization and individuals. • Change management is a systematic approach to dealing with change, and has at least three distinct components: – adapting to change, – controlling change, and – effecting change. • A proactive approach to dealing with change is at the core of all three aspects.
 Change Management • Change Management is the process, tools and techniques needed to – – – manage the people side of change processes, to achieve expected outcomes and to realize the change effectively… WITHIN THE SELF WITHIN THE TEAM AROUND THE LARGER ORGANIZATION Source: The Change Management Toolbook: Introduction http: //www. change-management –toolbook. com
 Human Factors Engineering • Human Factors Engineering is based on sciences of physics • HFE is a multi-faceted discipline that generates information about human requirements and capabilities, and applies it to the design and acquisition of complex systems. • Human factors engineering provides the opportunity to: and ergonomics and is essentially the study of man with his/her tools in the system (environment) in which they live or work. (1) develop or improve all human interfaces with the system; (2) optimize human / product performance during system operation, maintenance, and support; (3) make economical decisions on personnel resources, skills, training, and costs.
 Human Factors Engineering GOOD OR POOR ENGINEERING DESIGN? Photo source: Barnes-Jewish Hospital, Laurie Wolf, Human Factors Engineer
 Implementation Science or the Art of Execution 1 - Maintain focus on the “vital few” goals ü ü Keep strategic plan simple, communicate goals often Employees must be clear about their roles in achieving the most critical 80% of the plan 2 - Develop tracking systems that facilitate problem solving ü ü Set metrics; use charts, graphics and other tracking tools for planning and execution The right measures make expectations clear Each key success factor must have only one owner Conduct RCA* to drill down and uncover barriers to success 3 - Set up formal reviews ü ü ü Conduct “toll gate” or milestone reviews Be specific about meeting structures, frequency, and agendas Personnel and resources needed should be at top of the agenda! Root Cause Analysis
 Implementation Science or the Art of Execution “If you’ve got the right people in the right roles and are still not executing, then look at your resources” Tim Stratman, CEO RRD Direct “The most creative, visionary strategic planning is useless if it isn’t translated into action. Think simplicity, clarity, focus… and review your progress relentlessly. ” Melissa Raffoni Source: Three Keys to Effective Execution, Melissa Raffoni Harvard Business School Publishing Corporation, 2003
 Key Messages for Infection Preventionists • • We are doing good things in infection prevention and control; need more consistency This is a time of transition for the profession Ø Consumer awareness and expectations Legislative, governmental mandates Ø MDROs, emerging diseases, global transmission Ø • Customers and payers demand proactive programs – must focus on PREVENTION Source: Denise Murphy and Ruth Carrico. Am J Infect Control 2008: 36: 232 -40
 Key messages continued • • • Many programs getting to zero and sustaining! Sustainment goes beyond education and training or other traditional interventions Need a systems model that can design or engineer prevention into patient care …an Infection Prevention System Source: Denise Murphy and Ruth Carrico. Am J Infect Control 2008: 36: 232 -40
 What is a SYSTEM? The basics. . . Integrated collection of facilities, parts, equipment, materials, technology, personnel and/or techniques which make an organized whole capable of supporting some purpose or function.
 Components of All Systems § § § § § Interaction of elements Conversion processes Structure Purpose and goals and function Inputs or resources Outputs Environment Attributes Management, agents, and decision makers Source: The practice of Ergonomics: Reflections on a Profession by David Meister
 Information (Input you) Sensing Info processed") Basic Functions of a System Information storage (EMR) Information (Input you) Sensing Info processed Rec’d info that pt. needs constant I&O monitoring Obtain MD order, decide to insert foley catheter now Output Action functions Insert foley; record I&O Throughput I&O monitored via foley; medication adjusted based on this info Output becomes feedback creating new Input Modified from: Mc Cormick, EJ and Sanders, MS. Human Factors in Engineering and Design. New York: Mc. Graw-Hill Book Company, 1982. Patient output info used for tx decisions
Basic Functions of a System Information storage (EMR) Information (Input you) Sensing Info processed Rec’d info that pt. needs constant I&O monitoring Obtain MD order, decide to insert foley catheter now Output Action functions Insert foley; record I&O Throughput I&O monitored via foley; medication adjusted based on this info Output becomes feedback creating new Input Modified from: Mc Cormick, EJ and Sanders, MS. Human Factors in Engineering and Design. New York: Mc. Graw-Hill Book Company, 1982. Patient output info used for tx decisions
 What does a COMPLEX ADAPTIVE SYSTEM look like? SOURCE: Carayon, P. , Hundt, A. , Alvarado, C. , et al. (2006) Work system design for patient safety: Carayon, SEIPS model. Qual and Safety in Health Care; 15(supp 1): 50 -58. (SEIPS = System Engineering Initiative for Patient Safety)
 If people are not totally predictable, what can we build in to make processes (therefore, outcomes…. . ) more reliable? ü ü ü ü ü Simplification Standardization Automation Redundancy Recovery methods/strategies Visual queues Right resources, roles, responsibilities Autonomy/empowerment Supportive culture
 Potential Model for Prevention of CLABSI Using a System Framework Barnes-Jewish Hospital’s Value Stream Analysis – using principles of LEAN engineering aligned with a Six Sigma DMAIC (define, measure, analyze, improve, control) framework to § § map out, analyze, redesign and sustain a more efficient, defect-free experience for the patient with a central line …and to eliminate CLABSI
 LEAN APPENDIX
 Principles of Lean Systems Engineering VALUE: Exactly what customers are willing to pay for VALUE STREAM: . . . is “everything that goes into” creating and delivering value to the customer. These are the steps/actions/processes that deliver value. FLOW: Flow challenges us to reorganize the Value Stream to be continuous… one by one, non-stop, minimal waste. PULL: Pull challenges us to only respond “on demand” to our downstream customers. PERFECTION: Perfection challenges us to also create compelling quality (“defect free”) while also reducing cost (“lowest cost”). Source: Adapted from Simpler Business Systems, Indiana, USA
 Basic Elements of Lean Flow: The continuous creation or delivery of value without interruption 5 S: A complete system for workplace organization, including the process for sustainment Visual Management: Using visual signals for more effective communication Pull: Working or producing to downstream demand only Standard Work: Identifying the “best practice” and standardizing to it, stabilizing the process (predictability) 1 by 1: Reducing batch size to one whenever possible to support flow Zero Defects: Not sending product or service to downstream customer (internal or external) without meeting all requirements
 What is the Value Stream Analysis Process? A combination of Lean tools and techniques to: – Analyze a process – Prescribe a plan, with timeline and assignments, for transforming the process – Achieve breakthrough results
 Three Value Stream Maps –") Deliverables of a Value Stream Analysis Event (4 days) Three Value Stream Maps – – – Current State: A clear picture of how it is today Ideal State: What we envision long range (perfect? ) Future State: What we will look like in 6 -12 months Key VS performance improvement indicators (metrics) Detailed action plan of Rapid Improvement Events (RIEs), PI projects, and Just-Do-Its (JDI)
Deliverables of a Value Stream Analysis Event (4 days) Three Value Stream Maps – – – Current State: A clear picture of how it is today Ideal State: What we envision long range (perfect? ) Future State: What we will look like in 6 -12 months Key VS performance improvement indicators (metrics) Detailed action plan of Rapid Improvement Events (RIEs), PI projects, and Just-Do-Its (JDI)
 Flow cell - “the fundamental building block of Lean” Lowest Cost: One by One: • Batch size of one • Most direct path • Each item “flows” through the cell without stopping Defect Free: • No asking, no searching, no clarifying • Can tell normal vs. abnormal at a glance • Abnormal conditions trigger immediate action 1 -piece Flow 5 S • Straighten • Sort • Shine • Standardize • Sustain Standard Work Pull Visual Management (a completely transparent process is what enables a flow cell to operate) Source: Simpler Business Systems • • Best way known today Pace to Takt Time Same way for all staff Everyone sees, knows and understands On Demand: • Produce to downstream request only • Work fluctuates w/demand • Perfect handoffs - one way to request - one way to receive
 What is Value What is Not Value-adding: – ANY ACTIVITY THAT PHYSICALLY CHANGES THE MATERIAL BEING WORK ON AND INCREASES IT’S VALUE Non-value adding: – ANY ACTIVITY THAT TAKES TIME, MATERIAL, OR SPACE BUT DOES NOT PHYSICALLY CHANGE THE MATERIAL OR INCREASE IT’S VALUE Every activity required to move an item through a value stream falls into one of these two categories Source: Simpler Business Systems
 Medication errors;") The 8 Operational Wastes DEFECTS: (Wrong info. / Rework / Inaccurate information) Medication errors; misdiagnosis; wrong patient or procedure OVERPRODUCTION: (Duplication / Extra information) admitting patients early for staff convenience; blood draws/tests/treatment done early, pre-op chart prep 90 days out WAITING/DELAYS: (Patients / Providers / Material) ER staff waiting for admission; MDs waiting for test results; staff waiting for prescriptions/orders/transport/cleaning NEGLECT OF HUMAN TALENT: (Unused Skills / Injuries / Unsafe Environment / Disrespect) Scrub Techs used as retractor holders; RNs kept from direct patient care
The 8 Operational Wastes DEFECTS: (Wrong info. / Rework / Inaccurate information) Medication errors; misdiagnosis; wrong patient or procedure OVERPRODUCTION: (Duplication / Extra information) admitting patients early for staff convenience; blood draws/tests/treatment done early, pre-op chart prep 90 days out WAITING/DELAYS: (Patients / Providers / Material) ER staff waiting for admission; MDs waiting for test results; staff waiting for prescriptions/orders/transport/cleaning NEGLECT OF HUMAN TALENT: (Unused Skills / Injuries / Unsafe Environment / Disrespect) Scrub Techs used as retractor holders; RNs kept from direct patient care
 TRANSPORTATION: (Transactions / Transfer Moving) patients, meds, specimens, lab") The 8 Operational Wastes (continued) TRANSPORTATION: (Transactions / Transfer Moving) patients, meds, specimens, lab work, equipment INVENTORY: (Incomplete / Piles) Dictation waiting for transcription; Medical supplies; Specimens awaiting analysis; Patients waiting for tests, treatment or discharge MOTION: (Finding Information / Double entry) Looking for missing supplies, forms, patients; equipment not within reach EXCESS PROCESSING: (Extra Steps / Quality Checks / Workarounds / Inspection / Oversight) Asking patients the same information multiple times; completing unnecessary forms/tests; Triage; verifying orders
The 8 Operational Wastes (continued) TRANSPORTATION: (Transactions / Transfer Moving) patients, meds, specimens, lab work, equipment INVENTORY: (Incomplete / Piles) Dictation waiting for transcription; Medical supplies; Specimens awaiting analysis; Patients waiting for tests, treatment or discharge MOTION: (Finding Information / Double entry) Looking for missing supplies, forms, patients; equipment not within reach EXCESS PROCESSING: (Extra Steps / Quality Checks / Workarounds / Inspection / Oversight) Asking patients the same information multiple times; completing unnecessary forms/tests; Triage; verifying orders
 Is the current state. . . VALUE STREAM MAPPING Valuable? – Is the output of the process what the customer wants and needs? – Are there items missing that can add value to the customer in the current process? – Are there items that are making the process more efficient but not creating value? Capable? – Can each step be performed the same way with the same result every time? – Is the result satisfactory from the standpoint of the customer? – Can the steps be executed in similar locations with the same output every time? Available? – Can each step be performed every time it needs to be performed? – Can each step be performed in the cycle time required?
 Is the current state… Adequate? Is there enough capacity to perform each step without waiting? Can the process accommodate changes to operating conditions and still meet customer requirements? Can the process produce similar quality outputs across a range of operating conditions? (Robust) Flow? Do all the steps in the process occur in tight sequence or with little waiting? Pull? Does the downstream step signal when a process should occur? Level? Is demand leveled so that unnecessary variation is removed from the flow?
 Ideal and Future State • Built knowing the current state and its weaknesses and with clarity around the end goal (outcomes) • Built as if there were no barriers – in time, human factors, organizational constraints, cultural issues, resources, competencies, equipment, technology…. • Ideal: a reliable, dependable and nearly-perfect system (maybe after years of work) Future State: what can be accomplished toward the ideal state in the next 12 months (& keep resetting) •
 Gap Analysis Current State GAP Future State
 Action Plans Brainstorm Solutions Sort the action items Brainstormed Ideas Events ACTION IDEA ACTION IDEA ACTION IDEA ACTION IDEA Projects Do-Its EVENT TOPIC PROJECT ACTION ITEM EVENT TOPIC PROJECT Develop an action plan May Jun Jul Aug Do-Its Projects Events EVENT TOPIC EVENT TOPIC Oct EVENT TOPIC Sep EVENT TOPIC PROJECT ACTION ITEM ACTION ITEM PROJECT ACTION ITEM
 Central Line Insertion & Care Value Stream Analysis February 25 -27, 2008 Executive Champion/Sponsor: Denise Murphy; Physician Champions: Richard Bach, MD (CCU) and David Warren, MD(HEIP); Process Owner/Team Leader: Amy Richmond, Manager, Infection Prevention
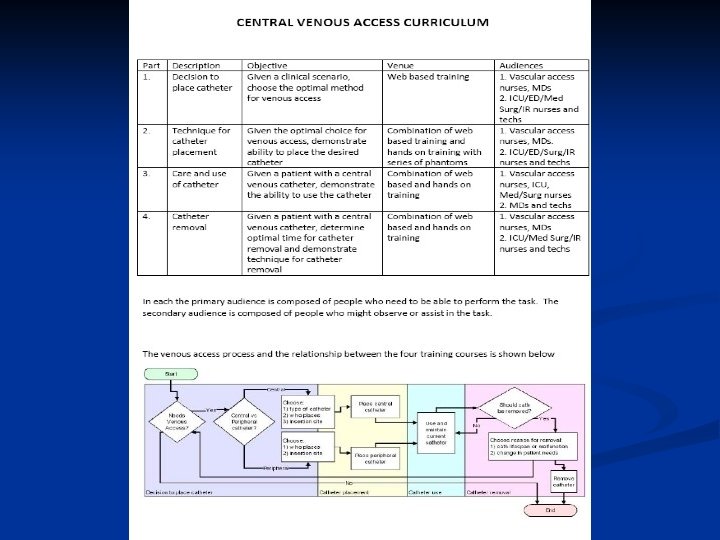
 Scope The scope of this Value Stream Analysis will include the central line insertion, access & care processes – From the decision to insert a central venous line to line removal Note: Process mapping for PICC lines and dialysis catheters was done prior to VSA and information incorporated into VSA
 identified –") Reasons for Action BJH ICUs – 2007 - 66 catheter-associated BSIs (CLABSI) identified – 2007 – 2. 2 CA-BSI/1000 catheter days (SIR 0. 53) BJH Non-ICU areas – CLABSI rates vary from 4 to 9 per 1000 catheter days – Compared to non-ICU rates of 1. 5 in med/surg and 2. 1 in general medicine published in the 2006 NHSN report CLABSI attributable mortality rate = 15% (#10 BJH pts in 2007) Bloodstream infections cost an excess of $36, 000 and excess LOS = 12 days CLABSI is publicly reported and CMS no longer pays excess costs RIGHT THING TO DO FOR PATIENT SAFETY!!
Reasons for Action BJH ICUs – 2007 - 66 catheter-associated BSIs (CLABSI) identified – 2007 – 2. 2 CA-BSI/1000 catheter days (SIR 0. 53) BJH Non-ICU areas – CLABSI rates vary from 4 to 9 per 1000 catheter days – Compared to non-ICU rates of 1. 5 in med/surg and 2. 1 in general medicine published in the 2006 NHSN report CLABSI attributable mortality rate = 15% (#10 BJH pts in 2007) Bloodstream infections cost an excess of $36, 000 and excess LOS = 12 days CLABSI is publicly reported and CMS no longer pays excess costs RIGHT THING TO DO FOR PATIENT SAFETY!!
 Identify the Opportunity Source: Barnes Jewish Hospital Epidemiology and Infection Prevention Department
 Identify Current Success to Build Upon Source: Barnes Jewish Hospital Epidemiology and Infection Prevention Department
 Initial State CLABSI Standardized Infection Ratios with LOWER TARGETS December 2006 - November 2007 1. 0 = NHSN POOLED MEAN FOR THAT TYPE OF ICU 0. 94 0. 9 0. 84 0. 8 0. 7 0. 65 0. 6 0. 53 0. 5 0. 4 0. 3 0. 24 0. 2 0. 1 0. 00 0. 0 104 ICU 56 ICU 82 CCU 83 ICU 84 ICU Source: Barnes Jewish Hospital Epidemiology and Infection Prevention Department 89 ICU Overall
 Initial State Barnes Jewish Hospital Epidemiology Infection Prevention Central Line Insertion and Dressing Scorecard Unit Inserter Sterile HH Mask Cap gown * CHG Site Drape Dressing Sterile field used air dried used Dated maintained Compliance w/all Recommendations 104 ICU 90% 90% 100% NC 90% 82 CCU 83 ICU 91% 84% 94% 100% 66% 98% 79% 98% 96% 98% 15% 48% 83% NC 83% 84% * Is not required to meet all recommendations, NC = Not Collected by the Unit > 90% 80 - 90% < 80% Criteria for meeting all recommendations; Site disinfected with CHG and air dried Full drape was used Inserter did the following: practiced HH, Proper PPE (Sterile gown, gloves mask and cap) Maintained a sterile field
 Solution Approach for this Event Process Mapping – – – Current: VA vs. Non-VA Future: VA vs Non-VA Ideal Gemba Walk
 Solution Approach for this Event Voice of the Customer Identified Wastes Affinity Diagram Impact Matrix Flow Cell
 Current State Process Map Decision to insert Preparation for insertion Insertion of CVC Maintenance of CVC Discontinuation of CVC
 CURRENT STATE Decision To Insert Start Order Prep for CL for Procedure Insertion of Central Line Care & Maint. Line Removal Wait: ultrasnd supplies Monitor patient and site Decision for line Removal ? IV No support/ line? Wait: process order MD prep RN to page MD Wait Patient LOC Education Patient Prep and Drape Initial Dressing Applied (RN) Transport to IVR Dry Time Documentation (RN) Wait MD to assess peripherals Patient signs paper consent Wait Local anesthesia onset Wait: Xray Communicate with person insert ing line Evaluate Wait: MD arrival MD prep: Chest X-Ray Choose MD condition Insertion “ TIME OUT” & local Wati: results Assemble New line equipment placement Wait: Labs Transport patient Secure dressing patient Chest XRay Use of Line Wait for (lab draw, Wait orders flush, med infusion) RN Discontinues Line Walk and Wait Search Wait: staff arrival Verification Gather supplies Chest XRay Read Daily Dressing observation changes (dressing, cath) Document, assess, placement, removal Find and communicate with staff Environmental Patient prep Use or Not Use? Document- Documentation Checklist MD/RN Infustion management
 Future State – Elimination of CLABSIs by 2010 – ICU CLABSI SIR of 0. 38 for 2008 (no more than #30 CLABSI; 13 in 2009) – >95% Compliance with CVC insertion and dressing change recommendations – Identify and evaluate complications related to CVC insertion (other than infection)
 Current State to Future State Current State Future State 6 fewer steps 11 fewer steps 7 fewer steps… 53 % fewer steps
 Gap Analysis • • Lack of RN competency with peripheral sticks Lack of dedicated vascular access experts Ø Lack of communication/command center Lack of standard algorithms: initial/daily screening, decision to insert, decision to remove Lack of staff to assist provider with insertion Ø Central line insertion requires an appropriately trained assistant • • Lack of standard work (SW) for line insertion/care Ø No SW for preparation/set up and break down Ø No procedure checklist for line insertion Ø No SW for documentation of line insertion, care and maintenance Supplies/Equipment not available as needed Ø Kits not standardized to contain what is needed Ø Supplies not available at point of care Ø Equipment (e. g. ultrasound) not readily available
 Gap Analysis • • • Lack of transparency regarding competency of provider to insert central lines Lack of core central line competencies for floor staff Lack of standardized central line education Ø Patients – only given post procedure Ø Staff • • Lack of standard environment for line placement (e. g. procedure room vs. pt room) Lack of technology to support the central line process Ø Transparency re insertion, maintenance & care (e. g. auto-population of task lists) Ø Lack of ability for rapid read of verification x-ray
 Solution Approach Events Projects Do-Its EVENT TOPIC PROJECT ACTION ITEM EVENT TOPIC • EVENT TOPIC PROJECT ACTION ITEM Just Do Its – Problem/Gap: Standard full barrier drape not available in all patient care areas for CVC insertion § Full drapes available at point of care
 Performance Improvement Project #1 – Problem/Gap: Varying staff skill levels placing peripheral IVs – Initial State: § Multiple attempts – patient discomfort/dissatisfaction § Excessive utilization of central lines § Medication delays – Future State: Increased staff skill levels in placing peripheral IVs; Develop and implement plan for multidisciplinary training to include “simulation” training – Metric: Decreased CVC utilization rates
 Central Line Utilization Ratio Medicine Wards January 2007 - Present 0. 38 0. 36 0. 34 0. 32 0. 30 0. 28 0. 26 0. 24 0. 22 0. 20 Jan Feb Mar Apr May Jun Jul Aug Sep Oct Nov Dec Jan Feb Mar Apr May Jun 2007 Source: Barnes Jewish Hospital Epidemiology and Infection Prevention Department 2008 Central Line Utilization Ratio NHSN
 Central Line Utilization Ratio Surgical Wards Jan 2007 - Present 0. 40 0. 38 0. 36 0. 34 0. 32 0. 30 0. 28 0. 26 0. 24 0. 22 0. 20 Jan Feb Mar Apr May Jun Jul Aug Sep Oct Nov Dec Jan Feb Mar Apr May Jun 2007 2008 Central Line Utilization Ratio Source: Barnes Jewish Hospital Epidemiology and Infection Prevention Department *Benchmark not available
 Performance Improvement Project #2 – Problem/Gap: Lack of standardized educational material for patients requiring central lines – Initial State: § There is no standardized patient educational material -procedure § Although post-procedure material exists, there is no standardization for disseminating to patients – pre Future State: § Create roles for patient and families relative to insertion and care of central lines § Create standardized educational materials and standardized process for dissemination to patient
 Rapid Improvement Event #1 – – Problem/Gap: No standardized process for determining when to insert or remove a central line § Over utilization of central lines § Increased risk for complications including BSIs Initial State: Fragmented process throughout the hospital, causing inconsistency and variation in the evaluation process Future State: § Standardized tool (e. g. algorithm) to predict the optimal vascular access mode for a patient § Consistent, reliable process that will provide appropriate vascular access utilization and monitoring Metric: 90% utilization of standardized tool to predict optimal vascular access mode for patients throughout hospitalization; decrease femoral line utilization
 § Preparation,") Rapid Improvement Event #2 – – Problem: Lack of standard work (SW) § Preparation, Insertion (Provider & Assistant), Care, Removal, Documentation Initial State: Poor compliance with current policies, lack of CVC training for non. ICU staff Future State: § Insertion checklist § Standardized documentation § Std. work for prep, insertion, care, removal, documentation § Visual queues to alert staff about line maintenance process steps § A model that empowers staff (in all roles) to STOP THE LINE when they see non-compliance with infection prevention measures § Engineering/administrative controls that will eliminate steps, build in “mistake-proofing” at each critical step in line insertion process Metric: 95% compliance with insertion checklist
Rapid Improvement Event #2 – – Problem: Lack of standard work (SW) § Preparation, Insertion (Provider & Assistant), Care, Removal, Documentation Initial State: Poor compliance with current policies, lack of CVC training for non. ICU staff Future State: § Insertion checklist § Standardized documentation § Std. work for prep, insertion, care, removal, documentation § Visual queues to alert staff about line maintenance process steps § A model that empowers staff (in all roles) to STOP THE LINE when they see non-compliance with infection prevention measures § Engineering/administrative controls that will eliminate steps, build in “mistake-proofing” at each critical step in line insertion process Metric: 95% compliance with insertion checklist
 § Supplies/Equipment •") Rapid Improvement Events 3, 4 Problem: Lack of standard work (SW) § Supplies/Equipment • CVC Kits • Carts – Initial State: § Disorganization of supplies § Supplies not available at point of care § An abundance of wasted motion & time looking for equipment and supplies – Future State: Standard CVC supply kits and procedure carts available at point of care – Metric: 100% standardized CVC supplies and equipment in all areas where CVC insertion is performed (cart)
Rapid Improvement Events 3, 4 Problem: Lack of standard work (SW) § Supplies/Equipment • CVC Kits • Carts – Initial State: § Disorganization of supplies § Supplies not available at point of care § An abundance of wasted motion & time looking for equipment and supplies – Future State: Standard CVC supply kits and procedure carts available at point of care – Metric: 100% standardized CVC supplies and equipment in all areas where CVC insertion is performed (cart)
 Rapid Improvement Event # 5 – – Problem/Gap: Lack of coordinated approach to entire spectrum of vascular access (peripheral and central line) Initial State: No standardized approach; everyone works in silos, doing their own thing Future State: Vascular Access Coordinating Center with identified experts/best practice/standard work algorithms Metric: Decreased CVC Utilization
 Decision Process for Vascular Access Rapid Improvement Event #1 April 14 -17, 2008
 Scope • • Initial assessment for necessity of a central line Daily assessment for line necessity Ø Ø Reasons why line is needed When should a line be continued and/or discontinued
 Reasons for Action • • • No standardized process to decide whether to insert a central line or not The lack of standardization produces unnecessary procedures and increases risk for complications, including BSI Patient dissatisfaction
 Initial State • Throughout the hospital the decision to insert an IV access varies • Initial assessment of line necessity or line type does not always meet the patient’s need Red dot = waste/non-value added step Green dot = value added step
 Initial State Metric Peripheral IV Attempts % of Staff Able to Verbalize Knowledge of Procedure Team and (PICC) Vasc Access Team # Central Line/PICC Lines: Removed Wait time to remove PICC lines placed urgently@ DC # of Communication Steps – Decision to Insert Baseline 33% (> 3 attempts) n = 21 Proc 33% PICC 87% 3 -5 per wk/unit ½ hr – 3 hrs 13% 3 - 22
 Future State • To develop a tool that will predict the optimal vascular access device for each patient Ø Ø • Standardized methodology will be utilized for line placement decisions Urgent requests at discharge for PICC lines and Hohns will be decreased To have a consistent and reliable process throughout the hospital that will provide appropriate vascular access utilization and monitoring
 Gap Analysis • Vascular Access Competency – – – • Lack of standard work-variation floor - floor – – – • Determining appropriate vascular access Daily assessment of access status Line Removal Lack of transparency – – • Multiple “sticks” Lack of trust in skill level No reliable back up available No cues that patient has PICC or central line for discharge planning No cues for line maintenance Lack of knowledge – – – Procedure team Method of ordering a PICC/contacting Vascular Access Services Line Care and Line Removal
 • Standard Work – – – • Transparency & Visual Cues – – • Algorithm and Daily Assessment Tool Line Removal Line Maintenance Compass – electronic documentation/task lists EMTEK – IV flush Communication Plan – – Vascular Access & Procedure Teams Rollout
 Rapid Experiments • Problem: – • Experiment: – – – • Developed a tool to assist in determining appropriate access, type, and ongoing necessity of line Tool will be integrated into Eclipsys/Compass (CPOE) Incorporated a daily assessment tool for line type and necessity Expected Impact: – – • Variation in process for determining appropriate IV access Decrease BSI Decrease LOS Increase in patient and staff satisfaction Standardized decision process for line placement Metric: – – Decrease the % of PIV with attempts >2 RN/Resident comfort level w/determining appropriate access
 Intravenous Access Determination Patient Name: DOB: Room # Circle all scores that apply to this patient Absolute Indications for Central Venous Access (Central Line) Necessity for CVC – Scoring Tool Score Trauma / Code 15 TPN 15 Home IV access needed 15 Hemodynamic monitoring 15 Vasoactive drugs (i. e. flolan, norepinepherine, epi, Thymocyte) 15 Preferred central line medications (immuneglobulin, dopamine, dobutamine) 15 Chemotherapy requiring central line (i. e. , ARA-C, Vincristine, Adriamycin) 15 Acute hemodialysis needed 15 Chronic hemodialysiss access needed 15 Pheresis 15 If any of the above criteria apply, STOP: Refer to LIP* for central line none Assessment Poor vasculature (0 -1 vessel remaining) 2 Current peripheral IV access failed OR Outside hospital access needs to be removed 1 1 -2 attempts at peripheral access failed 1 Expert attempt / assessment failed 2 Current Central Line failed 5 Unable to use upper extremities (i. e. AV fistula/graft, mastectomy, amputee, thrombosis) 8 Obesity (BSA >) 4 Suboptimal current access (i. e. femoral, drainage, EJ catheter, placed emergently). STOP: Reassess need for line none Total Score for Assessment section Anticipated Duration 3 -7 days 2 8 -14 days 4 2 -3 weeks 6 3 -4 weeks 8 Greater than 4 weeks OR discharged with IV 10 Total Score for duration section Infusions Chemotherapy (not requiring central line) 2 Blood products 4 Vancomycin, Cipro, Oxacillin, Zosyn for >72 hours 8 Total Score for infusion section Misc. needs End stage renal disease, considering hemodialysis. STOP: Refer to LIP possible Renal consult none Multiple IV medications or incompatibility 6 Frequent routine blood draws (q 6 hours or more frequently for >24 hours) 2 Combined score for all sections: Comments: Score of 6 or less = Does not meet criteria for central line or continuation of existing central line Score of 7 = Discuss need for central line with primary LIP Score of 8 -15 = Central line necessary, collaborate with LIP to obtain order or assess future needs
 DECISION TO PLACE CENTRAL ACCESS Urgency URGENCY CRITICAL : LESS THAN 30 MINUTES URGENT : 30 MINUTES TO 4 HOURS Team To Place Line Code Team Primary Team Code Team TODAY / ELECTIVE : 4 HOURS + Team To Place Line Primary Team Procedure Team CALL COMMAND CENTER : 2 -1112 CHOOSE LINE TLC SHEATH CORDIS
 Decision to place & type of line CENTRAL LINE HIGH FLOW or LOW FLOW HIGH FLOW LONG TERM Duraflow vs Trifusion DURAFLOW SHORT TERM Quinton vs Hemocath TRIFUSION QUINTON LOW FLOW LONG TERM PORT VS HICKMAN HEMOCATH PORT SHORT TERM PICC vs TLC vs HOHN HICKMAN PICC Contraindications Renal: Limits dialysis access. Poor Vascular Access : Limited access related to clots Limited Upper , extremity Availability. New Pacer Pace : maker less than three months old. Indications Access needed for 5 days to 1 year. Multiple IV drips / Antibiotics greater than 5 days. Home IV medications. TPN (IN HOUSE ONLY) TLC HOHN
 Rapid Experiments • Problem: – – • Rapid Experiment: – – • Screen Saver – Vascular Access and Procedure Teams Dissemination of informational flyers Placement of flyer on CCTV Article in Physician News Impact: – – • Varying knowledge of resources available for central line placement Underutilization of experts for line placement Increase efficiency of determining appropriate access More time for staff to focus on patient care Line placed in timely manner Increased patient satisfaction Metric: – – Increased (95%) staff/resident awareness of resources – Vascular Access Team and Procedure Team Monitor # of requests for PICC placement and Procedure Team
 Having trouble with venous access…need advice? Need a PICC line? Contact Vascular Access Service through ADGO (vascular access referral) or x 2 -1112: Everyday 7: 30 AM – 8 PM Need a central line? Contact the Procedure Team Mon - Fri 8 AM – 5 PM at 294 -4853 (also performs paracentesis, thoracentesis, and lumbar puncture)
 Rapid Experiments • Problem: – – • Rapid Experiment: – – • Created standard work for line removal Created reference pictorial Identification of available professionals in each department to remove lines Created an education module for the standard process for line removal Expected Impact: – – • Variation in the line removal process Delays in patient discharge Increase patient satisfaction Decrease infection Decrease delays in discharge Improve understanding of proper technique for line removal Metric: – # Central lines/PICC removed by nursing staff
 Barnes-Jewish Hospital Central Line Grid Name Picture Who places Who removes Flush Hickman catheter VIR Heparin Groshong Tunneled Catheter VIR Saline only Power Hohn VIR VIR Heparin Neostar VIR Heparin Arrow Triple Lumen Catheter MD MD, ICU RN, PACU RN, ED RN, 7200 RN, NP, PA, LCN Heparin
 Confirmed State Metric Peripheral IV Attempts % of Staff Able to Verbalize Knowledge of Procedure Team and (PICC) Vascular Access Service # Central Line/PICC Lines: Removed Wait time to remove PICC lines placed urgently@ DC # of Communication Steps – Decision to Insert Baseline Post Experiment Target 33% (> 3 attempts) n = 21 0% PICC 87% 95% Proc 33% 3 -5 per wk/unit ½ hr – 3 hrs ½ hr 13% 0% 3 - 22 4 -5 3 when command center implemented
 PICC LINE REMOVAL EDUCATION FOR STAFF Equipment needed Wash hands Remove dressing Clean insertion area with alcohol sticks and Chloraprep ETC.
 Completion Plan Action Item Who is Responsible By When Post screen saver Chad Hampton Communication plan (Publications, Meetings) Jamie Gagliarducci Place line removal training module on Pathlore (intranet) Vicky Ferris, RN Angie Dixon 05/16/08 Central line removal pictures Melissa Schultz, RN Vicky Ferris, RN 4/24/08 Upon completion of final RIE
 Rapid Improvement Events #3 & 4 – – – Problem: Lack of standard work (SW) § Supplies/Equipment § Preparation, Insertion (Provider & Assistant), Care, Removal, Documentation Initial State: Poor compliance with current policies, disorganization of supplies, lack of CL training for non-ICU staff Target State: Standard CL supply kits; standardized procedure carts on all floors; insertion checklist; standardized documentation; SW for prep, insertion, care, removal, documentation
 Confirmed State Metric Baseline Post Experiment Target Standardized CL Kits ICU 0% Nursing Division 0% 100% POC CL Supplies ICU = 100% – Procedure Cart Nursing Division = 4. 5% 100% # Types of CL kits >3 1 1 Motion (ft) to Gather Supplies Nursing Division = 3810 ft (. 72 mi) 283 Ft Decrease by 25% Time to Gather Supplies Nursing Division = 30 -45 min (~. 5 FTE/year) 2. 2 min (8 min to restock cart) 5 min # Items to Gather 17 2 Decrease by 50%
 Standardized Central Line Kit
 ORANGE = CVC Supplies/Equip in all store rooms, carts and bins!
 Supply Transport Options
 STOP INTERRUPTIONS DURING CVC INSERTION! Cart RE-STOCKING procedure. Part of standard work!
 Item Current annual cost CL") RIE: Standardized Kits and CVC Carts (Source: Amy Richmond) Item Current annual cost CL catheter $14, 938 CL Kit $15, 732. 64 + (single supplies $25. 54 ea) N/A $2, 088, 000 (58 BSIs in 4 PCA over 12 mos) CL Carts Ultrasound Cost of CLABSI - TOTAL $2, 118, 670 Estimated annual future cost $14, 938* $21, 560 $39, 521. 88 $92, 000 $1, 368, 000 (38 CLABSIs, 1/3 reduction) $1, 536, 019 Savings of $582, 651 * Current cost for catheter tray. Cost for catheter minus items placed in new kit to be determined. Cost will also decrease due to elimination of catheter trays being opened to remove a single item.
RIE: Standardized Kits and CVC Carts (Source: Amy Richmond) Item Current annual cost CL catheter $14, 938 CL Kit $15, 732. 64 + (single supplies $25. 54 ea) N/A $2, 088, 000 (58 BSIs in 4 PCA over 12 mos) CL Carts Ultrasound Cost of CLABSI - TOTAL $2, 118, 670 Estimated annual future cost $14, 938* $21, 560 $39, 521. 88 $92, 000 $1, 368, 000 (38 CLABSIs, 1/3 reduction) $1, 536, 019 Savings of $582, 651 * Current cost for catheter tray. Cost for catheter minus items placed in new kit to be determined. Cost will also decrease due to elimination of catheter trays being opened to remove a single item.
 IP system? Complex Adaptive System information, directives organization, culture ORDERS environment CPOE + + supplies, “tools” + + + HC Team alerted + + + Need for CVC training + tasks data, information human factors Steve Cochran, M. D. UBMC +
 Who will lead this future IP System? Infection Preventionists with. . . ü Advanced skills in facilitation and group process, ü building and leading teams ü performance improvement tools and methods ü change management ü Analytic skills, such as those required to do real-time point-of-care root cause analysis ü Refined understanding of systems thinking, complex adaptive systems/systems approach to problem solving ü Advanced leadership skills: e. g. , negotiation, persuasion ü
 and the Teams") Thanks to Amy Richmond, Team Leader; Pat Matt, PI Engineer (Facilitator) and the Teams at Barnes-Jewish Hospital who are committed to eliminating HAI. murphyd@mlhs. org
Thanks to Amy Richmond, Team Leader; Pat Matt, PI Engineer (Facilitator) and the Teams at Barnes-Jewish Hospital who are committed to eliminating HAI. murphyd@mlhs. org