

dce3ad9c150e6dce55f3e0fd19c6a6fb.ppt
- Количество слайдов: 50
") Using past visit information to enhance analysis of National Ambulatory Medical Care Survey (NAMCS) data Session 25 July 13, 2004 10: 30 -noon
Using past visit information to enhance analysis of National Ambulatory Medical Care Survey (NAMCS) data Session 25 July 13, 2004 10: 30 -noon
 Session overview Ø Introduction and methodology for using past visit information – Catharine Burt Ø Example of analysis of quality of care for hypertension – Esther Hing
 Using past visit information to enhance analysis of ambulatory care from encounter data Catharine W. Burt , Ed. D. Chief, Ambulatory Care Statistics Branch July 13, 2004 Data Users Conference U. S. DEPARTMENT OF HEALTH AND HUMAN SERVICES Centers for Disease Control and Prevention National Center for Health Statistics
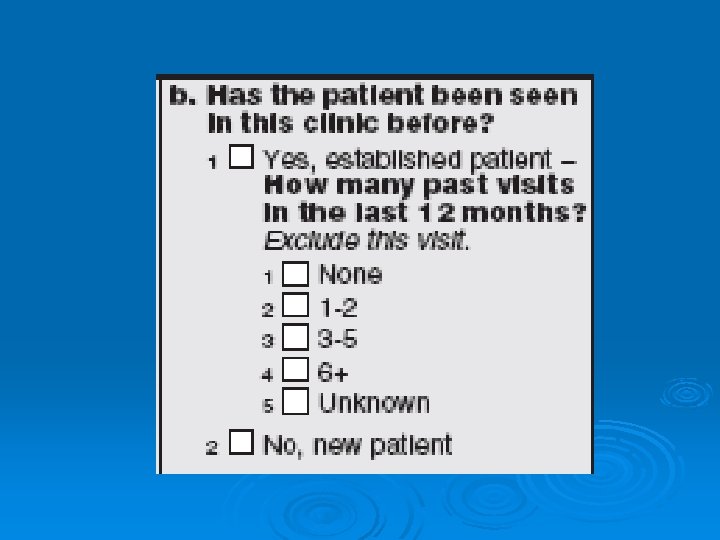
 Topics Introduction Ø Brief survey background Ø Past visit item Ø Re-weighting methodology Ø Analysis using re-weighting Ø Summary Ø
 Encounter vs. population-based surveys that measure ambulatory care utilization Ø Population-based l l l Ø National Health Interview Survey (NHIS) National Health and Nutrition Examination Survey (NHANES) Medical Expenditure Panel Survey (MEPS) Encounter-based l l National Ambulatory Medical Care Survey (NAMCS) National Hospital Ambulatory Medical Care Survey (NHAMCS)
 Pattern of ambulatory care visits according to patient age: NHIS, 2001 None 1 -3 visits 4 -9 visits 10 or more visits <06 6 -17 18 -24 25 -44 45 -64 65 -74 75+ 0% 20% 40% 60% 80% 100%
 Rate of visits per population by patient age: NAMCS, NHAMCS-OPD, 2001 Patient age in years All ages 3. 4 <06 4. 2 6 -17 1. 9 18 -24 1. 9 25 -44 2. 7 45 -64 4. 1 65 -74 6. 7 75+ 7. 8 0 2 4 6 Rate 8 10
 Desired goals from adding number of past visits to encounter data ü Describe patterns of care by frequency of visiting the doctor ü Provide more information about patients from encounter-level data ü Better describe quality of care to patients vs. describing content of encounter
 Ø NAMCS and NHAMCS background NAMCS l l Fielded 1973 -1981, 1985, 1989 -present 3 -stage sample • PSUs – physicians – visits during 1 week Ø NHAMCS l l Fielded annually since 1992 4 -stage sample • PSUs – hospitals – ED/OPD clinics – visits during 4 weeks
 Scope of the NAMCS Ø Physicians must be: l l l Primarily engaged in office-based, patient care Non-federally employed Not in anesthesiology, radiology, or pathology
 In-Scope Visits for NAMCS Basic unit of sampling is the physicianpatient visit Ø Visit must occur in a physician’s office Ø Visits must be for medical purposes Ø Out-of-scope contacts include: Ø l l Visits for administrative purposes House calls, phone calls, emails, visits in hospital setting unless physician has private office there
 In-Scope NAMCS Locations Freestanding private solo or group practice Ø Freestanding clinic/urgicenter Ø Neighborhood medical and mental health centers Ø Privately operated clinics Ø Non-Federal government clinic Ø Health maintenance organization Ø Federally qualified health center Ø Faculty practice plan Ø
 Out-of-Scope NAMCS Locations Ø Hospital ED’s and OPD’s Ø Ambulatory surgicenter Ø Institutional setting (schools, prisons) Ø Industrial outpatient facility Ø Federally operated clinic Ø Laser vision surgery
 Scope of the NHAMCS Ø Basic unit of sampling is patient visit Ø Emergency and outpatient departments of non-federal, general and short-stay hospitals Ø Not Federal, military, or Veterans Administration facilities Ø Located in 50 states and D. C.
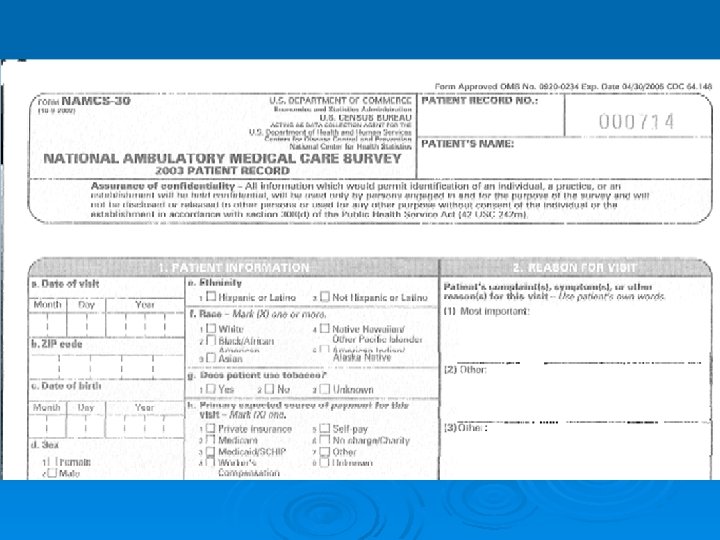
 Items Collected Ø Patient characteristics l Ø Visit characteristics l Ø Source of payment, continuity of care, reason for visit, diagnosis, treatment, medications ordered or provided Provider characteristics l Ø Age, sex, race, ethnicity Physician specialty, hospital ownership Drug characteristics l Therapeutic class, composition, control status, ingredients, Rx or OTC
 Percent distribution for number of past visits within l 2 months: NAMCS, 2001 30 Percent of visits 25 20 15 10 5 0 New patient 0 1 -2 3 -5 6+ Number of past visits Unknown
 Percent distribution of past visit item by PCP status: NAMCS 2001 35 Percent of visits PCP Other 30 25 20 15 10 5 0 New patient 0 1 -2 3 -5 6+ Number of past visits Unknown
 Percent of visits where the patient made 6 or more visits in past year by patient age: NAMCS 2001
 by number of past visits") Percent of visits to patient's primary care provider (PCP) by number of past visits within last l 2 months: NAMCS, 2001 100 Percent of visits 80 60 40 20 0 New patients 0 1 -2 3 -5 Number of past visits 6+
Percent of visits to patient's primary care provider (PCP) by number of past visits within last l 2 months: NAMCS, 2001 100 Percent of visits 80 60 40 20 0 New patients 0 1 -2 3 -5 Number of past visits 6+
 Drug mention rate by past visits: NAMCS, 2001 200 Number of drugs per 100 visits 150 100 50 0 New patient 0 1 -2 3 -5 Number of past visits 6+
 Drug mention rates by number of past visits for selected therapeutic classes: NAMCS, 2001 35 30 Number of drugs per 100 visits Cardiovascular CNS 25 20 15 10 5 0 New Patient 0 1 -2 3 -5 Number of past visits 6+
 Drug mention rates by number of past visits for selected therapeutic classes: NAMCS, 2001 35 30 25 Number of drugs per 100 visits Antimicrobials Cardiovascular CNS Pain relief 20 15 10 5 0 New Patient 0 1 -2 3 -5 Number of past visits 6+
 Re-weighting methodology Ø Assumptions and definitions l l Dividing the visit weight by number of visits within year provides a measure of patients Patient is relation between person and sampled doctor One person can be different patients to different doctors Assumes previous visits by same patient have similar visit characteristics
 3 patients making a total of 7 visits
 Probability of selecting a visit 1/7 2/7 4/7
 Multiplicity factor 1/7 2/7 4/7 1 . 5 . 25
 Creation of a re-weighting factor Item categories New Past visits 0 Annual visits 1 Interval Viz ratio midpoint 1 1 0 0 1 1 -2 1 -2 2 -3 2. 5 . 4 3 -5 4 -6 5 . 2 6+ 6+ 7+ 8 . 125
 Ø Patient weight = Visit weight * Ø Visit weight Viz ratio → 880, 487, 000 visits ± 33, 373, 000 Ø Patient weight → 322, 739, 000 patients ± 13, 073, 000
 Re-weighting example Annual visits 1 Interval midpoint 1 Visit weight 10 Viz ratio Patient weight 1 10 2 -3 2. 5 20 . 4 8 4 -6 5 40 . 2 8 7+ 8 40 . 125 5 Sum = 110 visits 31 patients
 Analysis using re-weighting Ø Comparison of visits and patients Ø Analysis of patients
 Comparison of distributions for visits and patients: NAMCS 2001 60 Percent 50 40 30 20 10 0 1 2 -3 4 -6 Visits 7+ 1 2 -3 4 -6 Patients 7+
 Percent distribution for people making any health care visits by number of visits made in one year: NHIS, 1999 -2000 60 Percent of persons 50 40 30 20 10 0 1 -3 4 -9 Number of visits Rate of persons making no health care visit was 17. 5. 10+
 Rate of visits per population by patient age: NAMCS, NHAMCS-OPD, 2001 Patient age in years All ages 3. 4 <06 4. 2 6 -17 1. 9 18 -24 1. 9 25 -44 2. 7 45 -64 4. 1 65 -74 6. 7 75+ 7. 8 0 2 4 6 Rate 8 10
 Components of utilization rates Rate of visits per population = Rate of visits per patient multiplied by Rate of patients per population
 Rate of visits per patient and patients per population by patient age: NAMCS, NHAMCS-OPD, 2001 Patient age in years All ages <06 6 -17 Visits per patient Patients per pop 18 -24 25 -44 45 -64 65 -74 75+ 0 0. 5 1 1. 5 Rate 2 2. 5 3 3. 5
 Comparison of population-based and encounter-based estimates of ambulatory care utilization by patient age: NAMCS, NHAMCS-OPD, NHIS 2001 1 Probability Rate per pop 10 Any visits 0. 8 8 Visits 0. 6 6 4+ visits 0. 4 4 0. 2 0 2 Patients <06 6 -17 18 -24 25 -44 Patient age Source: NHIS, NAMCS & NHAMCS-OPD 45 -64 65 -74 75+ 0
 Percent of visits and patients where the patient made 7 or more visits in the year by patient age: NAMCS 2001 Visits Patients
 Percent of visits and patients where the patient made only 1 visit in the year by patient age: NAMCS 2001 Visits Patients
 Rate per 100 pop of patients to same provider by type of setting and patient age: NAMCS, NHAMCS-OPD, 2001 Primary care Surgical spec Medical spec OPD Patient age in years <15 15 -24 25 -44 45 -64 65 -74 75+ 0 50 100 150 Number of patients per 100 pop 200 250
 Rate per 100 pop of patients by number of visits within a year to same provider and PCP status: NAMCS, 2001 Number of visits 1 2 -3 4 -6 7+ PCP 0 10 20 30 40 Number of patients per 100 pop 50 Non-PCP 60
 Rate per 100 pop of patients by number of visits within a year to PCP: NAMCS and NHAMCS-OPD, 2001 Private ins 1 Medicaid 2 -3 4 -6 7+ Uninsured 0 10 20 30 40 Number of patients per 100 pop 50
 Incidence of tobacco use cessation counseling at PCP visits: NAMCS & NHAMCS-OPD, 2001 30 25 Percent 27. 3 23. 7 20 15 10 5 0 Visits Patients
 Percent of visits by tobacco users to their PCP with tobacco cessation counseling by number of past visits within l 2 months: NAMCS & NHAMCS-OPD, 2001 40 Percent of visits 30 20 10 0 New patient 0 1 -2 Number of past visits 3 -5 6+
 Public health example Ø Women at risk for bearing children with birth defects l l Levothyroxine (evidence of hypothyroid) • 2. 6 million visits • 2. 3 million patients Accutane • 397 thousand visits • 272 thousand patients
 Comparison of drug mention rates for visits and patients Drug class Patient DMR 10 Ratio CNS Visit DMR 13 Cardio 22 17 1. 29 Pain relief 18 17 1. 10 Antimicrobial 13 12 1. 08 DMR is number of drugs per 100 visits/patients. 1. 35
 Ratio of drug mention rates based on visits and patients: NAMCS, 2001 1. 8 1. 6 1. 4 , , 1. 2 , , 1 0. 8 0. 6 CNS Cardio Pain relief Antimicrobial.
 Summary Past visits items provides depth to analysis of ambulatory care utilization Ø Visit records may be re-weighted to provide patient-level estimates Ø Re-weighted distribution more closely resembles population-based estimates Ø No change in sampling variance estimation procedure other than using the new weight Ø Caveats Ø l l Assumption of similar characteristics is not applicable to all analytical variables Still is not equivalent to person-level estimates
 Information available on the Internet Ø NCHS website is www. cdc. gov/nchs Ø National Health Care Survey website l Ambulatory Health Care Data (AHCD) Ø Join our LISTSERV