

0ee84faad115d751f16fd0426279a46f.ppt
- Количество слайдов: 18
 USGS/EROS Accomplishments and Year 3 Plans Enhancement of the U. S. Drought Monit Through the Integration of NASA Vegetation Index Imagery Jesslyn Brown Team Meeting, Austin, TX, 10/6/09 U. S. Department of the Interior U. S. Geological Survey
 Objective Integration of MODIS VI and derivative products into the U. S. Drought Monitor Decision Support System, and the emerging National Integrated Drought Information System (NIDIS) EROS Staff Jesslyn Brown, Yingxin Gu, Brian Davis, Danny Howard
 Topics FY 2009 Progress § § Drought Data Production System Data Continuity (AVHRR to MODIS) Product Validation Presentations/Publications FY 2010 Plans § § § Data Continuity (AVHRR to MODIS) Validation Transition to Operational Status Product Delivery Presentations/Publications
 FY 2009 Progress e. MODIS System/Drought System Development § § § 2009 e. MODIS expedited data stream, latency Historical data for data translation (Terra and Aqua NDVI time series processed for CONUS) System integration for seamless drought data production (from satellite to decision-maker) Integration into Vegetation Drought Response Index models System testing
 e. MODIS") Comparison of alternate satellite data sources for drought products AVHRR (CONUS composite) e. MODIS (CONUS composite) 1. NDVI composite produced weekly (set interval: Tues – Mon) 1. NDVI composite produced daily (rolling interval) 2. AVHRR delivery ~10: 00 am (T+24 h after NOAA-17 overpass) 2. e. MODIS delivery ~11: 30 pm (T+13 h after Terra overpass) 3. Manual process (requires personnel) 3. Automated system 4. Average Veg. DRI processing time: 5 h 55 m 4. Average Veg. DRI processing time: 7 h 16 m 5. Average delivery time (Aug/Sep): 3: 30 p. m. Tue (T+29 h after NOAA 17 overpass) 5. Average delivery time (Aug/Sep): 7: 45 a. m. Mon (T+21 h after Terra overpass) 6. Data redundancy: NOAA-19 AVHRR 6. Data redundancy: Aqua MODIS
Comparison of alternate satellite data sources for drought products AVHRR (CONUS composite) e. MODIS (CONUS composite) 1. NDVI composite produced weekly (set interval: Tues – Mon) 1. NDVI composite produced daily (rolling interval) 2. AVHRR delivery ~10: 00 am (T+24 h after NOAA-17 overpass) 2. e. MODIS delivery ~11: 30 pm (T+13 h after Terra overpass) 3. Manual process (requires personnel) 3. Automated system 4. Average Veg. DRI processing time: 5 h 55 m 4. Average Veg. DRI processing time: 7 h 16 m 5. Average delivery time (Aug/Sep): 3: 30 p. m. Tue (T+29 h after NOAA 17 overpass) 5. Average delivery time (Aug/Sep): 7: 45 a. m. Mon (T+21 h after Terra overpass) 6. Data redundancy: NOAA-19 AVHRR 6. Data redundancy: Aqua MODIS
 can be gained") Water Management: National Drought Monitoring System More efficiencies (2 -3 x) can be gained using server with faster CPU speeds. Terra & Aqua T+10 hrs EDOS MODIS L 0 Data e. MODIS System USGS/EROS USGS Drought Monitoring http: //gisdata. usgs. gov/website/ Drought_Monitoring/viewer. php T+11 hrs USGS/EROS Vegetation Dynamics and Veg. DRI System NIDIS Drought Portal http: //www. drought. gov Drought DSS T+2 -5 hrs NOAA NDMC Vegetation Drought Response Index http: //www. drought. unl. edu/ vegdri/Veg. DRI_Main. htm Data Deadline: Monday 12: 00 p. m. U. S. Department of the Interior U. S. Geological Survey Drought DSS: Desired/required 24 hour or less data delivery schedule March 2005
Water Management: National Drought Monitoring System More efficiencies (2 -3 x) can be gained using server with faster CPU speeds. Terra & Aqua T+10 hrs EDOS MODIS L 0 Data e. MODIS System USGS/EROS USGS Drought Monitoring http: //gisdata. usgs. gov/website/ Drought_Monitoring/viewer. php T+11 hrs USGS/EROS Vegetation Dynamics and Veg. DRI System NIDIS Drought Portal http: //www. drought. gov Drought DSS T+2 -5 hrs NOAA NDMC Vegetation Drought Response Index http: //www. drought. unl. edu/ vegdri/Veg. DRI_Main. htm Data Deadline: Monday 12: 00 p. m. U. S. Department of the Interior U. S. Geological Survey Drought DSS: Desired/required 24 hour or less data delivery schedule March 2005
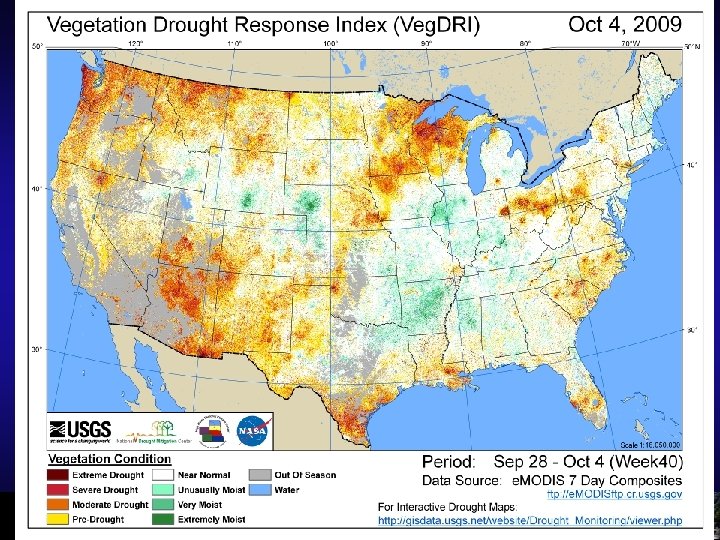
 FY 2009 Progress § § Tif and image output Achieved automated ingest into interactive web map viewer, only available internally to date [http: //gisdata. usgs. gov/website/Drought_Monito ring/viewer. php] § Web site release to public planned for October, 2009 § Graphical maps staged to FTP
 FY 2009 Progress: Drought System Production Delivery Monday Date week Delivery TOD Notes 6/1/2009 22 21: 26: 19 Test mode 6/8/2009 23 0: 22: 23 6/15/2009 24 15: 27: 36 6/22/2009 25 5: 56: 48 6/29/2009 26 16: 18: 22 7/6/2009 27 8: 06: 46 7/13/2009 28 8: 08: 12 7/20/2009 29 1: 31: 59 Next day 7/27/2009 30 6: 01: 09 M. Svoboda used in USDM DSS 8/3/2009 31 7: 46: 02 M. Svoboda used in USDM DSS 8/10/2009 32 7: 46: 00 8/17/2009 33 5: 07: 16 Graphic products delivered to ftp 8/24/2009 34 5: 10: 22 Graphic products delivered to ftp 8/31/2009 35 16: 45: 42 Graphic products delivered to ftp Next day, test mode Test mode
 FY 2009 Progress: Drought System Production Delivery Monday Date week Delivery TOD Notes 9/7/2009 36 7: 56: 22 Graphic products delivered to ftp 9/14/2009 37 7: 16: 04 Graphic products delivered to ftp 9/21/2009 38 8: 48: 03 Graphic products delivered to ftp, Sat data input 9/28/2009 39 7: 59 Graphic products delivered to ftp 10/5/2009 40 8: 16: 22 Graphic products delivered to ftp 10/12/2009 41
 § Performed historical comparisons between e.") FY 2009 Progress Data validation—evaluation (EROS and NDMC) § Performed historical comparisons between e. MODIS and AVHRR-based drought products (apparent differences because of historical coverage, further evaluation and report in FY 2010)
FY 2009 Progress Data validation—evaluation (EROS and NDMC) § Performed historical comparisons between e. MODIS and AVHRR-based drought products (apparent differences because of historical coverage, further evaluation and report in FY 2010)
 Based on") FY 2009 Accomplishments – Data Continuity Methodology* Translation Equation B (delivered 9/1/09) Based on cloud-screened NOAA-17 AVHRR/3 and e. MODIS Terra NDVI, 2005 – 2007. Two regression methods Conventional maximum likelihood regression Geometric mean regression *Collaboration with T. Miura, Univ. of Hawaii
FY 2009 Accomplishments – Data Continuity Methodology* Translation Equation B (delivered 9/1/09) Based on cloud-screened NOAA-17 AVHRR/3 and e. MODIS Terra NDVI, 2005 – 2007. Two regression methods Conventional maximum likelihood regression Geometric mean regression *Collaboration with T. Miura, Univ. of Hawaii
 FY 2009 Accomplishments: Presentations § § Gu, Y. , Brown, J. F. , van Leewen, W. , Reed, B. C. , and Miura, T. , “Phenologic classification of the United States: a framework for extending a multi-sensor time series for vegetation drought monitoring, ” In Proceedings of the Annual Meeting of the Association of American Geographers, March, 2009, Las Vegas, Nevada. [Presentation]. Brown, J. F. , Miura, T. , Gu, Y. , Jenkerson, C. , and Wardlow, B. , ”Utilizing a multi-sensor satellite time series in real-time drought monitoring across the United States”, In Proceedings of the 2009 Joint Assembly of the American Geophysical Union, May, 2009, Toronto, Canada. [Presentation].
 FY 2010 Work Plan § § Complete and integrate code for greenness ranking products Test greenness ranking product in USDM DSS Continue regular weekly production (Veg. DRI, BPASG, NDVIrank) Assure accurate ingest of weekly products into USGS and NIDIS viewers
 FY 2010 Work Plan § § Complete plan for operational under USGS/EROS Full evaluation of data translation (Eq. B) and products
 FY 2010 Work Plans: Publications and Presentations § § Gu, Y. , Brown, J. F. , Miura, T. , van Leewen, W. , and Reed, B. C. , “Phenological classification of the United States: a geographic framework for extending multisensor time series data, ” manuscript in preparation. 2009 AGU presentations § § Remote sensing techniques for monitoring drought hazards: an intercomparison Cross-calibration of AVHRR and MODIS NDVI conterminous United States datasets
 Drought product intercomparison USDM A M J J A USDM Anomalies ESI Anomalies e. MODIS Veg. DRI AVHRR VHI Palmer Z Anomalies
 Water Management: National Drought Monitoring System Earth System Models Land Surface Models: Vegetation Drought Response Index Predictions/Forecasts Information products Decision Support Systems, Assessments, Management Actions Vegetation Indices • MODIS NDVI • MODIS NDWI • AVHRR NDVI Phenological Metrics • Start of Season National Integrated Drought Information System US Drought Monitor Weekly map and narrative NIDIS web portal • Start of Season Anomaly Land Surface Vegetation: MODIS and AVHRR Precipitation: Weather Station networks, RADAR observations • Percent of Average SG Gridded Rainfall Products • Calibrated RADAR • Standardized Precipitation Index Analyses Early Drought Detection Drought Spatial Extent Drought State/Drought Severity Decisions / Actions Drought Plans Activated Land Use/Land Cover: Landsat, MODIS Urban Water Restrictions Drought Assistance Programs Observations, Parameters & Products Quantitative and qualitative benefits from improved decisions Wider dissemination of drought information Improved understanding of drought effects at sub-county scale • Seasonal Greenness Earth Observations Value & Benefits to Society Agricultural Choices for Water Conservation Quicker response for State Drought Task Forces and State Governors Increased spatial precision in drought emergency designations Better informed state and local decision making leading to more effective use of available water and drought relief program resources