a62a630803e8e4027749bedf2bee84c1.ppt
- Количество слайдов: 56
 User Fees and FDA New Drug Review: Analysis and Policy Options Daniel Carpenter Professor of Government, and Director, Center for American Political Studies (CAPS) Department of Government Faculty of Arts and Sciences Harvard University FDA Symposium August 24, 2006
 Per-application tax on sponsors, most proceeds to") PDUFA Assume all here know, but… (1) Per-application tax on sponsors, most proceeds to “buy” NDA reviewers (2) Lots of other things in the legislation (FDAMA – “micromanagement, ” conferences) (3) Crucial mechanism: review time goals, or deadlines, a. k. a. “PDUFA clocks. ”
PDUFA Assume all here know, but… (1) Per-application tax on sponsors, most proceeds to “buy” NDA reviewers (2) Lots of other things in the legislation (FDAMA – “micromanagement, ” conferences) (3) Crucial mechanism: review time goals, or deadlines, a. k. a. “PDUFA clocks. ”
 Faster government (part management, part") Why Acceleration? Lots of things have been happening (1) Faster government (part management, part politics) (2) More people (3) Pressure for disease advocacy groups (4) Changing culture at FDA? [Possibly; many here would know better than I would]
Why Acceleration? Lots of things have been happening (1) Faster government (part management, part politics) (2) More people (3) Pressure for disease advocacy groups (4) Changing culture at FDA? [Possibly; many here would know better than I would]
 Empirical Study Focus on review-specific deadlines. Use flexible and general statistical approach to address two questions: Q 1: Have PDUFA clocks changed FDA review behavior? Assess changes in behavioral review cycle before versus after deadline; Q 2: Have PDUFA clocks changed outcomes of FDA decision making? Assess whether changes in decision patterns have been associated with different policy outcomes. KEY: need flexible deadline, so can observe post-deadline choices
: by 1997, review and act upon 90%") Clocks by Statute PDUFA, 1992 (began 9/1992): by 1997, review and act upon 90% of standard drugs in 12 months, 90% of priority drugs in 6 months. FDAMA, 1997 (began 10/1997): by FY 1999, 30% of standard drugs in 10 months, by FY 2002 90% of standard drugs in 10 months; same as PDUFA for priority drugs. “PDUFA III, ” 2002 (began 10/2002): For standard and priority drugs, same deadline months as in FDAMA.
Clocks by Statute PDUFA, 1992 (began 9/1992): by 1997, review and act upon 90% of standard drugs in 12 months, 90% of priority drugs in 6 months. FDAMA, 1997 (began 10/1997): by FY 1999, 30% of standard drugs in 10 months, by FY 2002 90% of standard drugs in 10 months; same as PDUFA for priority drugs. “PDUFA III, ” 2002 (began 10/2002): For standard and priority drugs, same deadline months as in FDAMA.
 Method for Q 1: Partition Review Time by Relevant Intervals m=1 m=2 m=3 m=… m=t-1 m=… m=ti 0 ti tm 1 tm 2 tm 3 tm. Modification of Cox proportional hazards model; can estimate several review cycles at once. tmt-1
 Empirical Question 2: Compare “Outcome” Measures for Approvals before and after Deadline Gather data on post-marketing regulatory events (PMREs) (withdrawals, black-box warnings, etc. ) Compare PMRE rates for drugs approved before versus after deadline. Use nearest-neighbor matching techniques to balance samples.
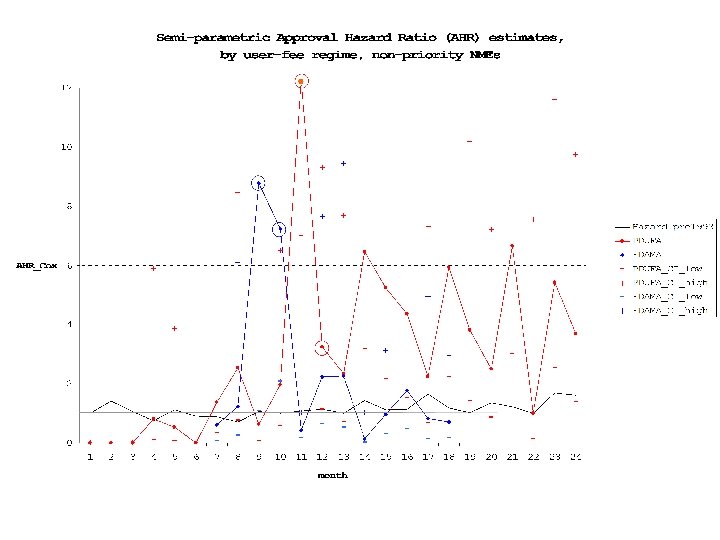
 Rate, before versus after") Figure 3: Ratio of Increase in Post-Marketing Regulatory Event (PMRE) Rate, before versus after statutory deadline, Non-Priority NMEs [bars are multipliers with 95% upper confidence interval shown] PDUFA FDAMA PDUFA FDAMA
Figure 3: Ratio of Increase in Post-Marketing Regulatory Event (PMRE) Rate, before versus after statutory deadline, Non-Priority NMEs [bars are multipliers with 95% upper confidence interval shown] PDUFA FDAMA PDUFA FDAMA
 Table Z 5: Results from Nearest-Neighbor Matching Analyses Withdrawal Lasser KUMC Discont ATE – pdufa 1112 [N = 481] 0. 4462 (0. 1003) 0. 6677 (0. 2089) 3. 5973 (0. 5791) 0. 9076 (0. 1570) ATEfdama 0910 [N = 481] -0. 0311 (0. 0489) -0. 0599 (0. 0671) 0. 3470 (0. 3954) -0. 9556 (0. 3105) ATEpdufa 0506 priority [N = 85] -0. 0458 (0. 0570) -0. 0353 (0. 0527) 0. 1306 (0. 3285) 0. 0583 (0. 0245)
 Conclusions 1. Still under revision; tentative. 2. Policy implications: Deadlines for regulatory decision need further scrutiny [FDA user-fee act up for reform in 2007]. 3. Are there other ways of accelerating regulators? 4. Theoretically, need model of dynamic optimization in organizational or network context (might explain piling in penultimate period).
 Increase per-application fees") Modest Proposal Why Not Harness User Fees for Drug Safety? (1) Increase per-application fees by a tax, spend $ on RCTs and epidemiological data, plus FDA K investments for safety (2) Would prob help FDA reputationally. (3) Would help Ph. RMA, industry politically. (4) If FDA/NIH conducts studies, less legal liability for firms (who can’t have “known ahead of time” about postmarket risks) (5) Would increase funding for ‘post-market’ safety research, currently quite low.
Modest Proposal Why Not Harness User Fees for Drug Safety? (1) Increase per-application fees by a tax, spend $ on RCTs and epidemiological data, plus FDA K investments for safety (2) Would prob help FDA reputationally. (3) Would help Ph. RMA, industry politically. (4) If FDA/NIH conducts studies, less legal liability for firms (who can’t have “known ahead of time” about postmarket risks) (5) Would increase funding for ‘post-market’ safety research, currently quite low.
 Additional Slides
 Questions How to get at the effects of deadlines for regulatory review processes? What is the impact of user-fee laws (micro: clocks) on FDA behavior? What is the impact of clocks on postmarketing experience and safety of drugs?
, renewed 1997, renewed 2002. (1) Per-application tax on sponsors,") PDUFA Passed 1992 (Hatch-Kennedy co-sponsor), renewed 1997, renewed 2002. (1) Per-application tax on sponsors, most proceeds to “buy” NDA reviewers (2) Lots of other things in the legislation (FDAMA – “micromanagement, ” conferences) (3) CLOCKS – review time goals
PDUFA Passed 1992 (Hatch-Kennedy co-sponsor), renewed 1997, renewed 2002. (1) Per-application tax on sponsors, most proceeds to “buy” NDA reviewers (2) Lots of other things in the legislation (FDAMA – “micromanagement, ” conferences) (3) CLOCKS – review time goals
 More Information “FDA Project” at http: //people. hmdc. harvard. edu/~dcarpent/fdaproject. html Professor Carpenter neither seeks nor accepts research funding or any other form of compensation from the FDA or from companies that sponsor product applications to the FDA. (Nor from patient advocacy groups, nor from Public Citizen. ) This research supported by National Science Foundation (SES 0076452, SES-0351048), the Investigator Awards in Health Policy Program of the Robert Wood Johnson Foundation, and the RWJ Scholars in Health Policy postdoctoral program.
 Roadmap 1. Discuss recent debates over drug approval and user fees 2. Discuss findings of statistical research re PDUFA 3. Discuss potential problems 4. Shamelessly sell my idea to fund postmarketing efficacy/safety studies through PDUFA augment.
 Myth #1: Quicker Approval Necessarily Related to Safety Problems De. Angelis, Rennie (JAMA Dec 2004): safety problems “unavoidable consequence” of acceleration of review. There may indeed be a probabilistic relationship, but (1) that’s different from an “unavoidable consequence, ” and (2) this requires investigation and is something we ought to know about. Larger question: what determines speed of review, speed of development? Complicated problem.
 Myth #2: Yesterday’s Approval is Necessarily Better than Today’s Sam Kazman, others: If FDA announces approval of life-saving drug today, we should ask why it couldn’t have reached the market two years ago. [Paraphrase. ] Bad argument: (1) Part of development and review process is learning about optimal dosage, administration, utilization, prescription. The benefits as well as the risks are learned. (2) Cannot separate “benefits of a drug” from the value of learning through the development and regulatory process. (3) Statistical counterfactuals that backdate possible gains from drug (e. g. , Wardell, Lasagna, others) are deeply flawed for this reason. Cannot validly use postapproval information to estimate what earlier-approval benefits would have looked like.
![Focus on Analytic Question [We Report, You Decide!] How to best analyze variations in](https://present5.com/presentation/a62a630803e8e4027749bedf2bee84c1/image-21.jpg "Focus on Analytic Question [We Report, You Decide!] How to best analyze variations in") Focus on Analytic Question [We Report, You Decide!] How to best analyze variations in approval and development times? What accounts for acceleration of FDA review of NMEs?
Focus on Analytic Question [We Report, You Decide!] How to best analyze variations in approval and development times? What accounts for acceleration of FDA review of NMEs?
 Problems in Previous Research Reliance on linear statistical models – Mary Olson – Ernie Berndt/ Thomas Philipson et al Linear regressions are bad: (1) atheoretical and ignore structure of data, (2) can’t retrieve parameters of interest, (3) miss important mean-variance dependencies No clearly preferable “best” estimator for working on the problem; Carpenter and Ting (2005) working on this. Simultaneous equations with neuro-dynamic programming (aka “neural network” models).
 Approach here Focus on one specific mechanism of user-fee program, namely review-specific deadlines. Use flexible and general statistical approach to (1) see whether it has changed FDA decision making and (2) assess whether changes in decision patterns have been associated with different postmarketing outcomes.
") Theory: Bureaucratic Learning and Regulatory Choice Regulatory approval (e. g. , FDA drug review) is a stopping problem 1. FDA guards reputation for protecting safety, sees approvals as irreversible 2. FDA has uncertainty over drug. Must decide, in real time, if and when apparent benefits outweigh apparent costs.
Theory: Bureaucratic Learning and Regulatory Choice Regulatory approval (e. g. , FDA drug review) is a stopping problem 1. FDA guards reputation for protecting safety, sees approvals as irreversible 2. FDA has uncertainty over drug. Must decide, in real time, if and when apparent benefits outweigh apparent costs.
 THE VALUE OF WAITING TO APPROVE Delay is a way of getting more information about a risky (irreversible) decision. FDA can recall a dangerous drug, but recall can’t undo the reputational damage from its mistake. Best Rule: Approve drug when estimated danger is less than approval payoff AND value of waiting. BUT: Value of delay not constant; it depends upon worth of information to be learned by waiting.
 learns about stochastic process that is both discrete (Poisson process)") Basic Model Regulator (R) learns about stochastic process that is both discrete (Poisson process) and continuous (Brownian motion). R observes both processes, wishes to learn their underlying parameters: μ (efficacy) and λ (danger) Deadline is non-absolute: If R stops by deadline, “bonus” attached to terminal payoff. If R keeps going, loses bonus.
Basic Model Regulator (R) learns about stochastic process that is both discrete (Poisson process) and continuous (Brownian motion). R observes both processes, wishes to learn their underlying parameters: μ (efficacy) and λ (danger) Deadline is non-absolute: If R stops by deadline, “bonus” attached to terminal payoff. If R keeps going, loses bonus.
 observed.") Regulator’s Observable and Problem Objects of inference. But only X(t) observed.
Regulator’s Observable and Problem Objects of inference. But only X(t) observed.
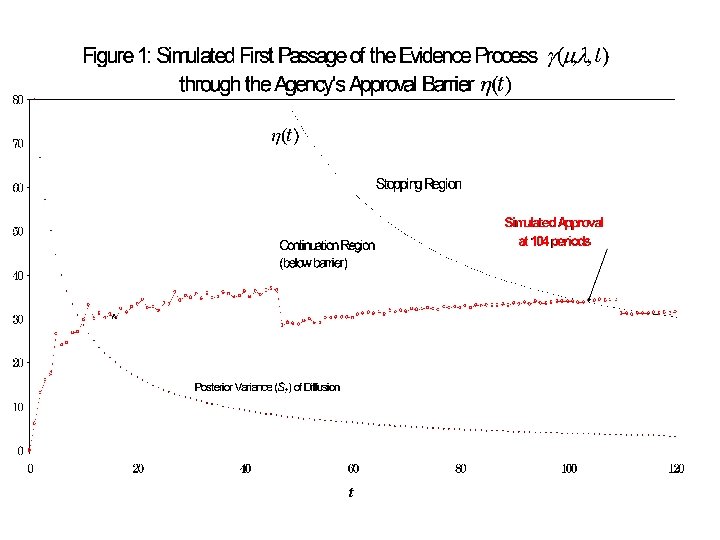
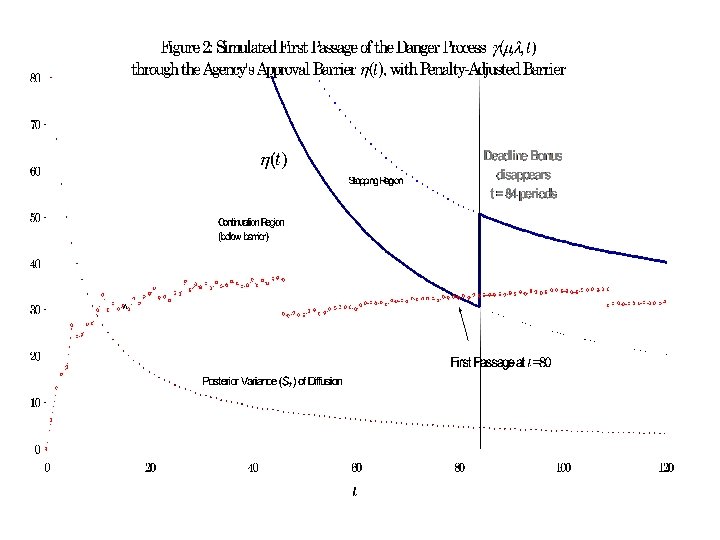
 Want to model a situation where the incentives for approving in") Add Deadline (non-Absolute) Want to model a situation where the incentives for approving in the next time interval change discontinuously according to the passing of a deadline. Idea here: adopt deadline bonus, which disappears (= penalty) after deadline elapses.
Add Deadline (non-Absolute) Want to model a situation where the incentives for approving in the next time interval change discontinuously according to the passing of a deadline. Idea here: adopt deadline bonus, which disappears (= penalty) after deadline elapses.
 No") Deadlines Bayesian optimal stopping intensively studied, but almost always in context-free models: (1) No deadlines (2) No queues or networks of problem flow Address (1): what happens to dynamic choice when a deadline is imposed?
Deadlines Bayesian optimal stopping intensively studied, but almost always in context-free models: (1) No deadlines (2) No queues or networks of problem flow Address (1): what happens to dynamic choice when a deadline is imposed?
 Main Results 1. R’s behavior is highly non-continuous around the deadline. 2. R more prone to Type I error (stopping when shouldn’t have) when the stochastic process has a “jump” component. • • 1 st event may not have materialized Underestimate in priors for rare events is nonlinear (near-exponential)
 Method for Q 1: Implement “augmented” Cox model that integrates density/hazard over months, within reviews N is counting process (locally Poisson) R is 1 if drug i is under review at time s, 0 else
 Method for Q 1: Log-partial-likelihood is then With score vector Add G-distributed frailty (unit mean, enters multiplicatively), shared by primary indication of NME
 ~ stafcder +") > coxclock 3 <- coxph(Surv(. t 0, . t, . d) ~ stafcder + subyear + month 1 pdufa + month 2 pdufa + month 3 pdufa + month 4 pdufa + month 5 pdufa + month 6 pdufa + month 7 pdufa + month 8 pdufa + month 9 pdufa + month 10 pdufa + month 11 pdufa + month 12 pdufa + month 13 pdufa + month 14 pdufa + month 15 pdufa + month 16 pdufa + month 17 pdufa + month 18 pdufa + month 19 pdufa + month 20 pdufa + month 21 pdufa + month 22 pdufa + month 23 pdufa + month 24 pdufa + month 7 fdama + month 8 fdama + month 9 fdama + month 10 fdama + month 11 fdama + month 12 fdama + month 13 fdama + month 14 fdama + month 15 fdama + month 16 fdama + month 17 fdama + month 18 fdama + frailty(discode), data = approved. drugdata. st. 20051108. subset. TVC, subset = priority == 0, na. action = na. exclude, eps = 0. 0001, iter. max = 10, method = "efron") > summary(coxclock 3) n=34536 (935 observations deleted due to missing values) coef se(coef) se 2 Chisq DF p stafcder -0. 00108 0. 00024 0. 000235 20. 22 1. 0 6. 9 e-006 subyear -0. 00573 0. 00787 0. 007710 0. 53 1. 0 4. 7 e-001 month 1 pdufa -1. 02380 0. 72041 0. 719984 2. 02 1. 0 1. 6 e-001 month 2 pdufa -1. 55817 1. 01074 1. 010447 2. 38 1. 0 1. 2 e-001 month 3 pdufa -0. 20724 0. 59993 0. 599459 0. 12 1. 0 7. 3 e-001 month 4 pdufa 0. 69101 0. 48651 0. 485945 2. 02 1. 0 1. 6 e-001 month 5 pdufa 0. 62091 0. 41303 0. 412373 2. 26 1. 0 1. 3 e-001 month 6 pdufa 1. 70436 0. 31887 0. 318054 28. 57 1. 0 9. 0 e-008 month 7 pdufa 0. 31006 0. 73189 0. 731496 0. 18 1. 0 6. 7 e-001 month 8 pdufa 0. 92331 0. 61396 0. 613506 2. 26 1. 0 1. 3 e-001 month 9 pdufa -0. 48555 1. 01701 1. 016734 0. 23 1. 0 6. 3 e-001 month 10 pdufa 0. 67020 0. 60857 0. 608100 1. 21 1. 0 2. 7 e-001 month 11 pdufa 2. 50317 0. 28998 0. 289013 74. 52 1. 0 0. 0 e+000 month 12 pdufa 1. 17080 0. 53658 0. 535998 4. 76 1. 0 2. 9 e-002 month 13 pdufa 0. 83626 0. 60842 0. 607893 1. 89 1. 0 1. 7 e-001 month 14 pdufa 1. 85710 0. 36168 0. 360723 26. 36 1. 0 2. 8 e-007 month 15 pdufa 1. 64749 0. 45109 0. 450239 13. 34 1. 0 2. 6 e-004 month 16 pdufa 1. 46416 0. 54276 0. 542001 7. 28 1. 0 7. 0 e-003 month 17 pdufa 0. 79674 0. 60418 0. 603447 1. 74 1. 0 1. 9 e-001 month 18 pdufa 1. 77107 0. 49637 0. 495440 12. 73 1. 0 3. 6 e-004 month 19 pdufa 1. 32192 0. 50264 0. 501990 6. 92 1. 0 8. 5 e-003 month 20 pdufa 0. 89923 0. 54175 0. 541128 2. 76 1. 0 9. 7 e-002 month 21 pdufa 1. 87828 0. 39961 0. 398721 22. 09 1. 0 2. 6 e-006 month 22 pdufa -0. 01345 1. 03147 1. 031109 0. 00 1. 0 9. 9 e-001 month 23 pdufa 1. 67523 0. 38815 0. 387197 18. 63 1. 0 1. 6 e-005 month 24 pdufa 1. 29086 0. 49516 0. 494341 6. 80 1. 0 9. 1 e-003 month 7 fdama -0. 50379 1. 22514 1. 224939 0. 17 1. 0 6. 8 e-001 month 8 fdama 0. 19153 0. 81710 0. 816793 0. 05 1. 0 8. 1 e-001 month 9 fdama 2. 15835 1. 06951 1. 069274 4. 07 1. 0 4. 4 e-002 month 10 fdama 1. 96435 0. 63331 0. 632863 9. 62 1. 0 1. 9 e-003 month 11 fdama -0. 87136 0. 46675 0. 466074 3. 49 1. 0 6. 2 e-002 month 12 fdama 0. 78953 0. 62791 0. 627265 1. 58 1. 0 2. 1 e-001 month 13 fdama 0. 79765 0. 73126 0. 730675 1. 19 1. 0 2. 8 e-001 month 14 fdama -2. 05782 1. 04953 1. 049091 3. 84 1. 0 5. 0 e-002 month 15 fdama -0. 06193 0. 60692 0. 606058 0. 01 1. 0 9. 2 e-001 month 16 fdama 0. 55665 0. 64701 0. 646049 0. 74 1. 0 3. 9 e-001 month 17 fdama -0. 20794 0. 91401 0. 913264 0. 05 1. 0 8. 2 e-001 month 18 fdama -0. 36465 0. 73182 0. 730816 0. 25 1. 0 6. 2 e-001 frailty(discode) 93. 85 45. 9 3. 8 e-005 Iterations: 8 outer, 18 Newton- Raphson Variance of random effect= 0. 0676 I-likelihood = -9696. 3 Degrees of freedom for terms= … Rsquare= 0. 015 (max possible= 0. 436 ) Likelihood ratio test= 518 on 83. 7 df, p=0 Wald test = 354 on 83. 7 df, p=0
> coxclock 3 <- coxph(Surv(. t 0, . t, . d) ~ stafcder + subyear + month 1 pdufa + month 2 pdufa + month 3 pdufa + month 4 pdufa + month 5 pdufa + month 6 pdufa + month 7 pdufa + month 8 pdufa + month 9 pdufa + month 10 pdufa + month 11 pdufa + month 12 pdufa + month 13 pdufa + month 14 pdufa + month 15 pdufa + month 16 pdufa + month 17 pdufa + month 18 pdufa + month 19 pdufa + month 20 pdufa + month 21 pdufa + month 22 pdufa + month 23 pdufa + month 24 pdufa + month 7 fdama + month 8 fdama + month 9 fdama + month 10 fdama + month 11 fdama + month 12 fdama + month 13 fdama + month 14 fdama + month 15 fdama + month 16 fdama + month 17 fdama + month 18 fdama + frailty(discode), data = approved. drugdata. st. 20051108. subset. TVC, subset = priority == 0, na. action = na. exclude, eps = 0. 0001, iter. max = 10, method = "efron") > summary(coxclock 3) n=34536 (935 observations deleted due to missing values) coef se(coef) se 2 Chisq DF p stafcder -0. 00108 0. 00024 0. 000235 20. 22 1. 0 6. 9 e-006 subyear -0. 00573 0. 00787 0. 007710 0. 53 1. 0 4. 7 e-001 month 1 pdufa -1. 02380 0. 72041 0. 719984 2. 02 1. 0 1. 6 e-001 month 2 pdufa -1. 55817 1. 01074 1. 010447 2. 38 1. 0 1. 2 e-001 month 3 pdufa -0. 20724 0. 59993 0. 599459 0. 12 1. 0 7. 3 e-001 month 4 pdufa 0. 69101 0. 48651 0. 485945 2. 02 1. 0 1. 6 e-001 month 5 pdufa 0. 62091 0. 41303 0. 412373 2. 26 1. 0 1. 3 e-001 month 6 pdufa 1. 70436 0. 31887 0. 318054 28. 57 1. 0 9. 0 e-008 month 7 pdufa 0. 31006 0. 73189 0. 731496 0. 18 1. 0 6. 7 e-001 month 8 pdufa 0. 92331 0. 61396 0. 613506 2. 26 1. 0 1. 3 e-001 month 9 pdufa -0. 48555 1. 01701 1. 016734 0. 23 1. 0 6. 3 e-001 month 10 pdufa 0. 67020 0. 60857 0. 608100 1. 21 1. 0 2. 7 e-001 month 11 pdufa 2. 50317 0. 28998 0. 289013 74. 52 1. 0 0. 0 e+000 month 12 pdufa 1. 17080 0. 53658 0. 535998 4. 76 1. 0 2. 9 e-002 month 13 pdufa 0. 83626 0. 60842 0. 607893 1. 89 1. 0 1. 7 e-001 month 14 pdufa 1. 85710 0. 36168 0. 360723 26. 36 1. 0 2. 8 e-007 month 15 pdufa 1. 64749 0. 45109 0. 450239 13. 34 1. 0 2. 6 e-004 month 16 pdufa 1. 46416 0. 54276 0. 542001 7. 28 1. 0 7. 0 e-003 month 17 pdufa 0. 79674 0. 60418 0. 603447 1. 74 1. 0 1. 9 e-001 month 18 pdufa 1. 77107 0. 49637 0. 495440 12. 73 1. 0 3. 6 e-004 month 19 pdufa 1. 32192 0. 50264 0. 501990 6. 92 1. 0 8. 5 e-003 month 20 pdufa 0. 89923 0. 54175 0. 541128 2. 76 1. 0 9. 7 e-002 month 21 pdufa 1. 87828 0. 39961 0. 398721 22. 09 1. 0 2. 6 e-006 month 22 pdufa -0. 01345 1. 03147 1. 031109 0. 00 1. 0 9. 9 e-001 month 23 pdufa 1. 67523 0. 38815 0. 387197 18. 63 1. 0 1. 6 e-005 month 24 pdufa 1. 29086 0. 49516 0. 494341 6. 80 1. 0 9. 1 e-003 month 7 fdama -0. 50379 1. 22514 1. 224939 0. 17 1. 0 6. 8 e-001 month 8 fdama 0. 19153 0. 81710 0. 816793 0. 05 1. 0 8. 1 e-001 month 9 fdama 2. 15835 1. 06951 1. 069274 4. 07 1. 0 4. 4 e-002 month 10 fdama 1. 96435 0. 63331 0. 632863 9. 62 1. 0 1. 9 e-003 month 11 fdama -0. 87136 0. 46675 0. 466074 3. 49 1. 0 6. 2 e-002 month 12 fdama 0. 78953 0. 62791 0. 627265 1. 58 1. 0 2. 1 e-001 month 13 fdama 0. 79765 0. 73126 0. 730675 1. 19 1. 0 2. 8 e-001 month 14 fdama -2. 05782 1. 04953 1. 049091 3. 84 1. 0 5. 0 e-002 month 15 fdama -0. 06193 0. 60692 0. 606058 0. 01 1. 0 9. 2 e-001 month 16 fdama 0. 55665 0. 64701 0. 646049 0. 74 1. 0 3. 9 e-001 month 17 fdama -0. 20794 0. 91401 0. 913264 0. 05 1. 0 8. 2 e-001 month 18 fdama -0. 36465 0. 73182 0. 730816 0. 25 1. 0 6. 2 e-001 frailty(discode) 93. 85 45. 9 3. 8 e-005 Iterations: 8 outer, 18 Newton- Raphson Variance of random effect= 0. 0676 I-likelihood = -9696. 3 Degrees of freedom for terms= … Rsquare= 0. 015 (max possible= 0. 436 ) Likelihood ratio test= 518 on 83. 7 df, p=0 Wald test = 354 on 83. 7 df, p=0
 Q 1: Then use score or “Wald”-like tests to compare monthly rates month 11 pdufa month 12 pdufa month 13 pdufa month 14 pdufa 2. 50317 1. 17080 0. 83626 1. 85710 0. 28998 0. 53658 0. 60842 0. 36168 0. 289013 74. 52 0. 535998 4. 76 0. 607893 1. 89 0. 360723 26. 36 1. 0 0. 0 e+000 2. 9 e-002 1. 7 e-001 2. 8 e-007 month 9 fdama 2. 15835 1. 06951 1. 069274 4. 07 1. 0 4. 4 e-002 month 10 fdama 1. 96435 0. 63331 0. 632863 9. 62 1. 0 1. 9 e-003 month 11 fdama -0. 87136 0. 46675 0. 466074 3. 49 1. 0 6. 2 e-002 month 12 fdama 0. 78953 0. 62791 0. 627265 1. 58 1. 0 2. 1 e-001
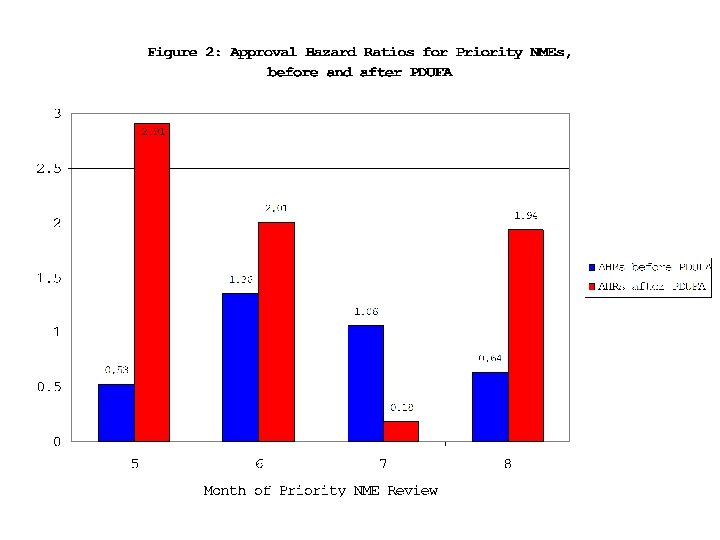
 Table 1: Rates of Post-market Regulatory Events, before and after PDUFA deadline, for Priority Drugs After 1992 Tests for Difference Statistical Black-box warning (KUMC) Tests for Difference Safety-based withdrawal, Canada Tests for Difference Patient population changes per year Tests for Difference Discontinuations/year Tests for Difference Before 1992 Approval in 5 th or 6 th month, priority drug [pre-deadline] Black-box listing (Lasser et al) After 1992 Approval in 7 th or 8 th month, priority drug Approval in 5 th or 6 th month, priority drug Approval in 7 th or 8 th month, priority drug [post-deadline] [pre-deadline] [post-deadline] 3. 8% 0. 0% Pearson χ2 = 6. 61 [Pr = 0. 010] 31. 5% 16. 3% Pearson χ2 = 5. 91 [Pr = 0. 015] 3. 7% 1. 1% Pearson χ2 = 1. 61 [Pr = 0. 204] 0. 027 0. 000 Regression F = 1. 16 [Pr = 0. 283] 0. 041 0. 000 Regression F = 1. 53 [Pr = 0. 219] 0. 0% 10. 3% Pearson χ2 = 0. 3424 [Pr = 0. 558] 33. 3% 37. 9% Pearson χ2 = 0. 0245 [Pr = 0. 876] 0. 0% 6. 8% Pearson χ2 = 0. 2207 [Pr = 0. 639] 0. 001 Regression F = 0. 00 [Pr = 0. 994] 0. 013 0. 026 Regression F = 0. 12 [Pr = 0. 725]
 Table 2: Rates of Post-market Regulatory Events, before and after PDUFA deadline, for Non-Priority Drugs 1997 -2004 [FDAMA] 1993 -1997 [PDUFA I] Before 1993 Approval in 9 th or 10 th month Approval in th 11 or 12 th month [post-deadline] Approval in 11 th or 12 th month [pre-deadline] Approval in 13 th or 14 th month [post-deadline] Approval in th 11 or 12 th month [pre-deadline] Approval in 13 th or 14 th month [post-deadline] 0. 0% 4. 2% 0. 0% 1. 5% 3. 1% [pre-deadline] Black-box listing (Lasser et al) 0. 0% Black-box warning (KUMC) 17. 4% Safety-based withdrawal, Canadian market Patient population changes per year Product discontinuations per year Pearson χ2 = 0. 5567 [Pr = 0. 456] F-test in regression: 1. 24 [Pr < 0. 247] 10. 0% F-test in regression: 1. 89 [Pr < 0. 170]* 8. 6% 1. 4% F-test in regression: 0. 73 [Pr < 0. 392]* 0. 011 0. 000 F-test in regression: 1. 26 [Pr < 0. 2615] 0. 095 0. 000 F-test in regression: 41. 84 [Pr < 0. 0001] 16. 7% 46. 2% Pearson χ2 = 3. 7176 [Pr = 0. 051] 11. 5% 0. 9% Pearson χ2 = 8. 5834 [Pr = 0. 003] F-test in regression: 7. 40 [Pr < 0. 007] 0. 016 0. 000 F-test in regression: 3. 84 [Pr < 0. 0503] 0. 080 0. 041 F-test in regression: 2. 89 [Pr < 0. 091] * Pearson chi-squared statistic not calculable; too few data points in relevant categories; # Because so few drugs were approved in 13 -14 month interval before 1993, we extend the after deadline period to 18 months. Pearson χ2 = 1. 1759 [Pr = 0. 278] F-test in regression: 0. 46 [Pr < 0. 497] 18. 2% 15. 0% Pearson χ2 = 0. 51771 [Pr = 0. 472] F-test in regression: 0. 13 [Pr < 0. 722] 0. 0% 2. 1%# Pearson χ2 = 1. 2981 [Pr = 0. 231] F-test in regression: 0. 00 [Pr > 0. 999] 0. 005 0. 006 F-test in regression: 0. 00 [Pr < 0. 9489] 0. 030 0. 024 F-test in regression: 0. 33 [Pr < 0. 565]
 + g(FIRMi) + d 1 Approval") Linear FE Regressions EVENTRATEi = a + b(DIZi) + g(FIRMi) + d 1 Approval 0910 + d 2 Approval 1112 + d 3 Approval 1314 + d 4 Approval 1112 -PDUFA + d 5 Approval 1314 -PDUFA + d 6 Approval 0910 -FDAMA + d 7 Approval 1112 -FDAMA + othervars + error
Linear FE Regressions EVENTRATEi = a + b(DIZi) + g(FIRMi) + d 1 Approval 0910 + d 2 Approval 1112 + d 3 Approval 1314 + d 4 Approval 1112 -PDUFA + d 5 Approval 1314 -PDUFA + d 6 Approval 0910 -FDAMA + d 7 Approval 1112 -FDAMA + othervars + error
 Global Withdrawals Score “ 1” if withdrawn for safety reasons in at least one country (mean = 0. 013). Shift is rate for two months after deadline to rate for two months before. PDUFA shift/mean = 2. 85; F = 0. 58 (0. 44) [FE] 3. 17 [RE]; F = 0. 95 (0. 33) FDAMA shift/mean = 8. 06; F = 2. 78 (0. 09) [FE] 8. 80 [RE]; F = 4. 58 (0. 03)
 Possible Policy Concerns 1. Do artificial deadlines induce suboptimal decisions? (Probably inconsistent with optimal stopping behavior, but this needs to be tested. ) 2. Are there ways other than deadlines to accelerate expected review times? 3. What about drugs “orphaned” by the passage of deadline?
 Extra Slides, just in case you asked
![Necessary Extensions 1. No control for quality/safety [working on this] 2. Crucial covariates missing:](https://present5.com/presentation/a62a630803e8e4027749bedf2bee84c1/image-48.jpg "Necessary Extensions 1. No control for quality/safety [working on this] 2. Crucial covariates missing:") Necessary Extensions 1. No control for quality/safety [working on this] 2. Crucial covariates missing: order of entry 3. Would like more general model, then maybe structural estimation 4. All observational No attempt at instrumental variables here
Necessary Extensions 1. No control for quality/safety [working on this] 2. Crucial covariates missing: order of entry 3. Would like more general model, then maybe structural estimation 4. All observational No attempt at instrumental variables here
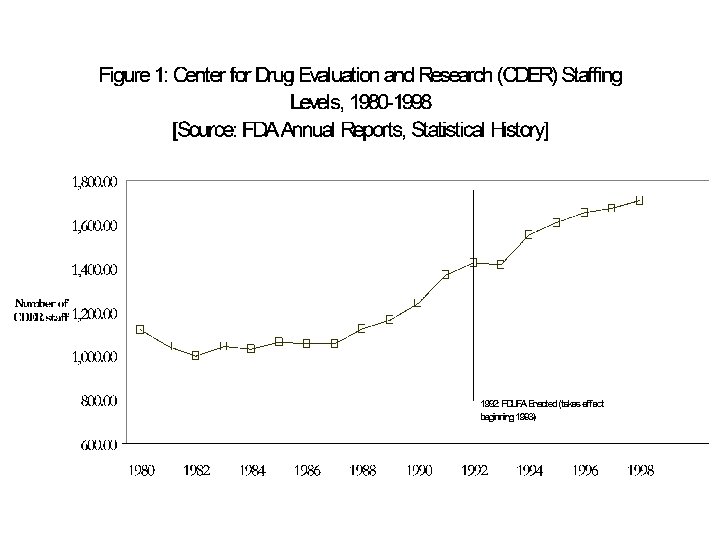
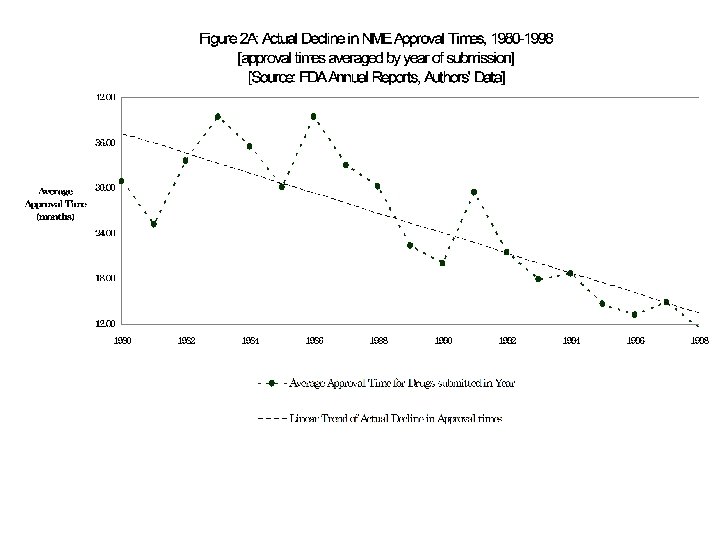
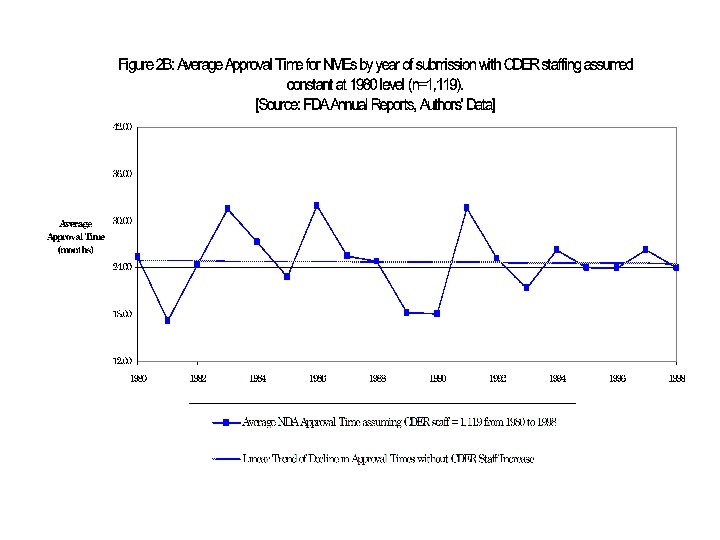
, Carpenter and Fendrick (RAJ 2004), Carpenter et") My Previous Research Carpenter (Health Affairs 2004), Carpenter and Fendrick (RAJ 2004), Carpenter et al (Health Affairs 2003) 1. Resources, before and after PDUFA a. Resources rise, and apptimes decline, in mid- to late-1980 s b. Acceleration among drugs that were not targeted with clocks (generics), but still reviewed by CDER. 2. Patient advocacy and news coverage 3. Acceleration not concentrated among politically powerful, larger firms
My Previous Research Carpenter (Health Affairs 2004), Carpenter and Fendrick (RAJ 2004), Carpenter et al (Health Affairs 2003) 1. Resources, before and after PDUFA a. Resources rise, and apptimes decline, in mid- to late-1980 s b. Acceleration among drugs that were not targeted with clocks (generics), but still reviewed by CDER. 2. Patient advocacy and news coverage 3. Acceleration not concentrated among politically powerful, larger firms
: Buys everything else, but points to PDUFA incentives.") Not Everyone Agrees Mary Olson (Yale): Buys everything else, but points to PDUFA incentives. My latest estimates: Acceleration is mix of resources and incentives (“clock”) My Q: Why would incentives matter if resources didn’t?
Not Everyone Agrees Mary Olson (Yale): Buys everything else, but points to PDUFA incentives. My latest estimates: Acceleration is mix of resources and incentives (“clock”) My Q: Why would incentives matter if resources didn’t?
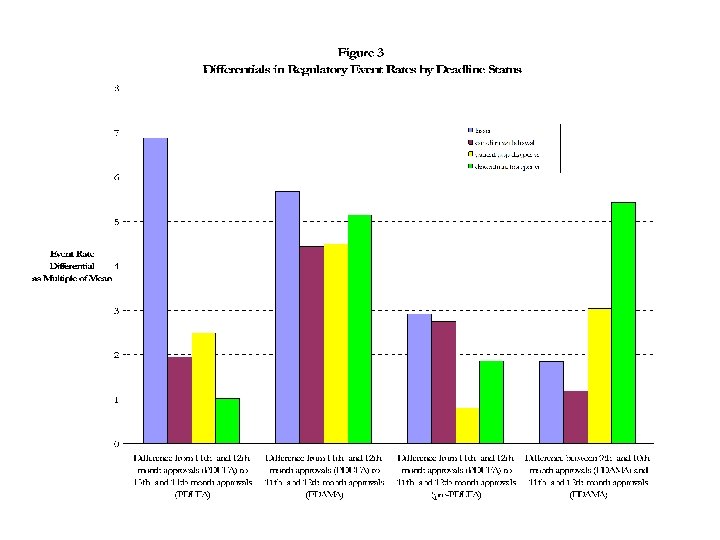
 0. 0197 0. 0526") Canadian withdrawal Mean of Regulatory Event Variable Black-box warning (Lasser) 0. 0197 0. 0526 11 th and 12 th month, PDUFA versus 13 th and 14 th month, PDUFA Diff = 0. 135 As multiple of mean: 6. 87 F: 3. 72 Pr > F: 0. 0540 Diff = 0. 102 As multiple of mean: 1. 95 F: 6. 77 Pr > F: 0. 0094 11 th and 12 th month, PDUFA versus 11 th and 12 th month, FDAMA Diff = 0. 112 As multiple of mean: 5. 67 F: 8. 80 Pr > F: 0. 0031 Diff = 0. 233 As multiple of mean: 4. 43 F: 2. 12 Pr > F: 0. 1492 11 th and 12 th month, PDUFA versus 11 th and 12 th month, pre-1993 Diff = 0. 058 As multiple of mean: 2. 92 F: 9. 55 Pr > F: 0. 0020 Diff = 0. 144 As multiple of mean: 2. 75 F: 1. 58 Pr > F: 0. 2086 9 th and 10 th month, FDAMA versus 11 th and 12 th month, FDAMA Diff = 0. 036 As multiple of mean: 1. 85 F: 0. 81 Pr > F: 0. 3686 Diff = 0. 062 As multiple of mean: 1. 18 F: 0. 29 Pr > F: 0. 5898 NMEs 1, 712 Indicator variables for primary indication 201 Fixed effects for firms Yes
Canadian withdrawal Mean of Regulatory Event Variable Black-box warning (Lasser) 0. 0197 0. 0526 11 th and 12 th month, PDUFA versus 13 th and 14 th month, PDUFA Diff = 0. 135 As multiple of mean: 6. 87 F: 3. 72 Pr > F: 0. 0540 Diff = 0. 102 As multiple of mean: 1. 95 F: 6. 77 Pr > F: 0. 0094 11 th and 12 th month, PDUFA versus 11 th and 12 th month, FDAMA Diff = 0. 112 As multiple of mean: 5. 67 F: 8. 80 Pr > F: 0. 0031 Diff = 0. 233 As multiple of mean: 4. 43 F: 2. 12 Pr > F: 0. 1492 11 th and 12 th month, PDUFA versus 11 th and 12 th month, pre-1993 Diff = 0. 058 As multiple of mean: 2. 92 F: 9. 55 Pr > F: 0. 0020 Diff = 0. 144 As multiple of mean: 2. 75 F: 1. 58 Pr > F: 0. 2086 9 th and 10 th month, FDAMA versus 11 th and 12 th month, FDAMA Diff = 0. 036 As multiple of mean: 1. 85 F: 0. 81 Pr > F: 0. 3686 Diff = 0. 062 As multiple of mean: 1. 18 F: 0. 29 Pr > F: 0. 5898 NMEs 1, 712 Indicator variables for primary indication 201 Fixed effects for firms Yes
 Mfg revisions per market year Mean Label revisions per market year 0. 1330 0. 2251 11 th and 12 th month, PDUFA versus 13 th and 14 th month, PDUFA Diff = 0. 018 As multiple of mean: 1. 39 F: 8. 13 Pr > F: 0. 0044 Diff = 0. 206 As multiple of mean: 0. 92 F: 4. 36 Pr > F: 0. 0371 11 th and 12 th month, PDUFA versus 11 th and 12 th month, FDAMA Diff = 0. 363 As multiple of mean: 2. 72 F: 15. 54 Pr > F: 0. 0001 Diff = -0. 152 As multiple of mean: -0. 68 F: 1. 18 Pr > F: 0. 2783 11 th and 12 th month, PDUFA versus 11 th and 12 th month, pre-1993 Diff = 0. 266 As multiple of mean: 2. 00 F: 19. 67 Pr > F: 0. 0000 Diff = 0. 030 As multiple of mean: 0. 13 F: 0. 08 Pr > F: 0. 7733 9 th and 10 th month, FDAMA versus 11 th and 12 th month, FDAMA Diff = 0. 003 As multiple of mean: 0. 02 F: 0. 00 Pr > F: 0. 9712 Diff = -0. 198 As multiple of mean: -0. 88 F: 2. 52 Pr > F: 0. 1129 NMEs 1, 244 Indicator variables for primary indication 185
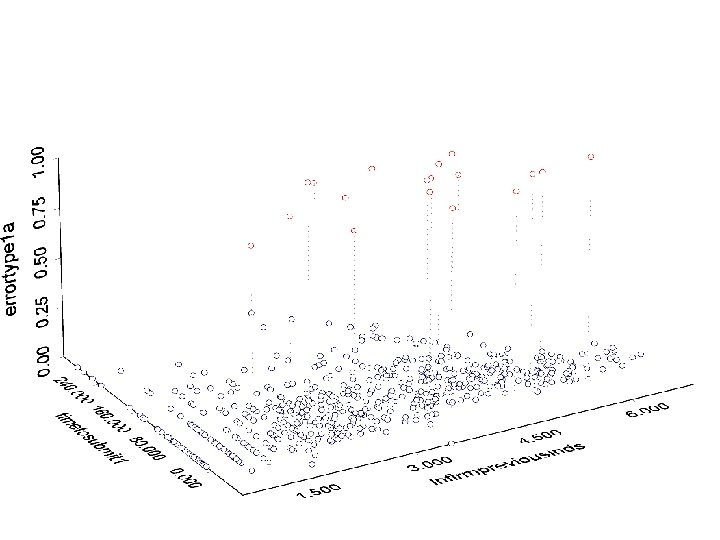
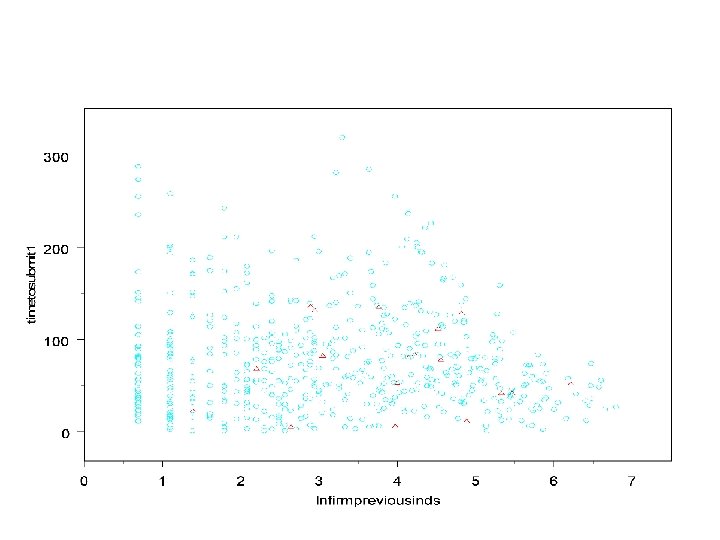
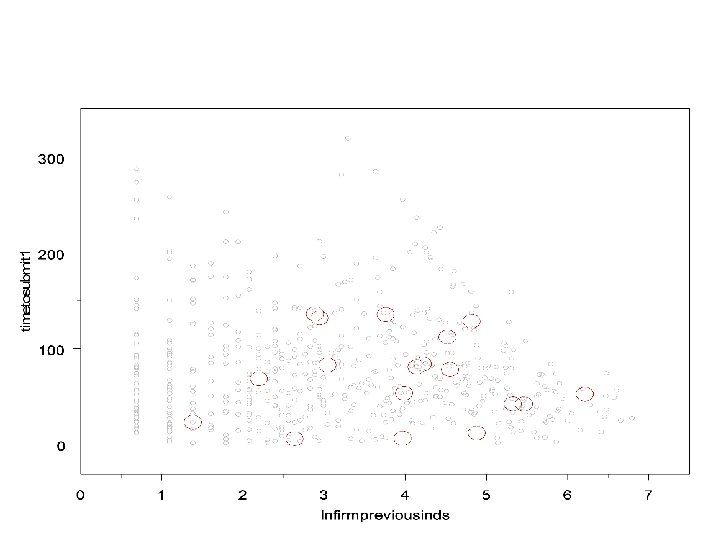
 Error by Firm Experience