

3fe228e781195e53f772b846a00f25fd.ppt
- Количество слайдов: 60
 Use of Workstations at Met Éireann: Current Status and Plans for the Future (James Hamilton / Kieran Commins – Met Éireann) EGOWS – 2007 – Dublin
 GRAPHICS AT MET ÉIREANN: CURRENT STATUS • Graphics system has developed over many years • Began with Calcomp 960 pen-plotters [1978] • Specialised programs for producing a single type of chart • Interactive [command line] NWP display system since 1982 • NWP display system upgraded to X-windows [xcharts] • Various third party graphics systems [TV weather / GIS / Radar] • Increased use of web graphics – local (intranet) & external (internet) • Multiple display systems [some on different displays and/or paper] • Very little interactive product generation
 GRAPHICS AT MET ÉIREANN: PRODUCTION • Graphics system primarily forecaster display system • Multiple display systems [some on different displays and/or paper] • Specialised third party systems for TV and GIS production • Multiple production systems with little integration • Little or no integration of displays • Generating a new type of product often requires writing a program • Some graphical editing but cumbersome • Forecaster work is labour intensive – hand analysis on paper • High cost / need to change
 NEED FOR AN INTEGRATED DISPLAY SYSTEM Many Sources of Data Available to Forecaster • NWP Products : Hirlam, ECMWF, UKMO, DWD • Raw NWP data and derived products • [Ocean] Wave Models : Met-Éireann, ECMWF, UKMO • Satellite Data [polar-orbiter and geostationary] • Weather Radar [Dublin and Shannon, UK Network] • Observations • Internet sites • Plotted charts on paper
 CURRENT DISPLAY SYSTEMS • XCharts – NWP visualising • Intranet – Visualising Imagery – Satellite/Radar – Loops – additional NWP products – Nested Hirlam – Observations • Telnet – Display observations via command line interface • Internet – many sources [including products via email] • Dedicated Satellite and Radar displays • Other graphical tools – trajectory model, plot viewer • BUT. . Not integrated
 CURRENT PRODUCTION SYSTEMS • MS Word – Extensive range of Word macros • MS Access – Some text forecasts • Auto faxing/SMS/e-mailing system using Word/Access for scheduling and editing – introduced in 2005 • TV Graphics (Metacast Borealis) for TV and Web • Road Ice Prediction System [with on-screen graphics editor] • Various graphical tools • Special graphics programs for individual newspapers
 NEED FOR INTEGRATED PRODUCTION SYSTEM Problem – use once, edit many times – example – fronts • Fronts are edited for Web site • Fronts are edited again for TV, perhaps several times • Fronts are edited again for fax products [different program] No integration – need integrated system
 CURRENT NWP DISPLAY SYSTEM: XCHARTS Xcharts is … An X-Application for the display of NWP products developed at Met Éireann It can display NWP data from Hirlam, ECMWF, UKMO and DWD. Also ocean wave models. It can also display satellite data, observations, ascents and cross-sections. It supports animation. It can be used via a command interface, a GUI or a scripting language.
 OVERVIEW OF XCHARTS Hardware and Software Systems • Runs on SGI Workstation or Linux PC [Red. Hat] • Can display on X-terminal [e. g. PC] • Written in C / Fortran-77 / X / Motif Evolved from earlier system called CHARTS [1982] • Display of NWP Products • Command Driven Interface • Charts generated as needed • All possible charts allowed
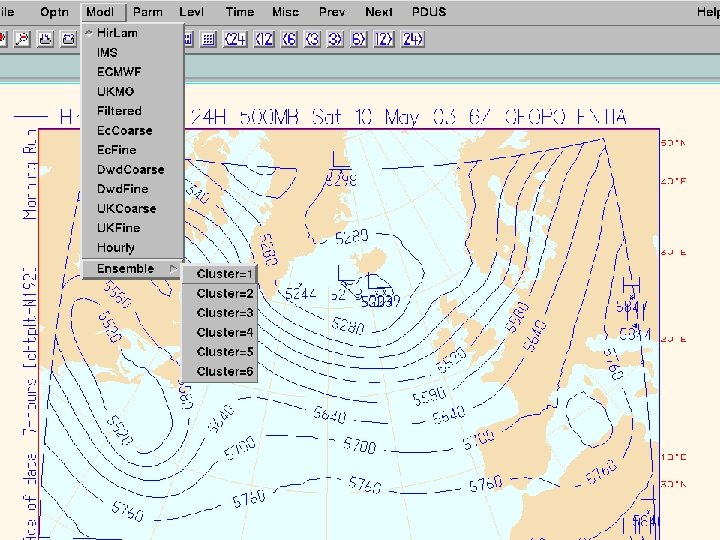
 Design of USER INTERFACE for XCHARTS Workstation for Forecasters • Display : NWP Output / Observations / Satellites • Command line and menu buttons • Compatible with CHARTS [command-driven system, 1982] • Use of script files [macros] Design of user Interface • Multiple Mouse Clicks for selection … … e. g. Parm=geo, Level=500 mb, Model=Hirlam, PLOT • Button clicks generate CHARTS commands • Uses defaults for all parameters / remembers previous selections
 Other Features of the USER INTERFACE Short-Cut Buttons • Reduce number of Button clicks • Just two clicks to change : Model / Forecast / Level Specifying a Chart for Plotting • System remembers previous settings • Only need to specify parameters which have changed • User can request illegal / non-existent charts [e. g. 5 -day Hirlam] • Command line option: e. g. Plot 3 day ecmwf surface pressure
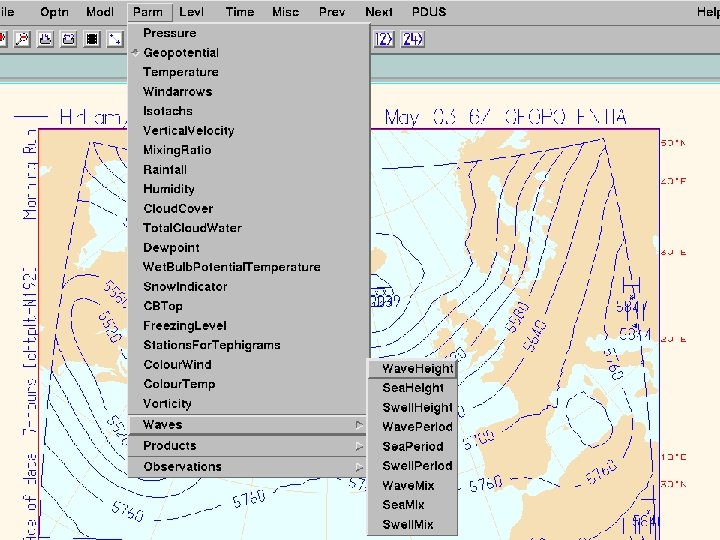
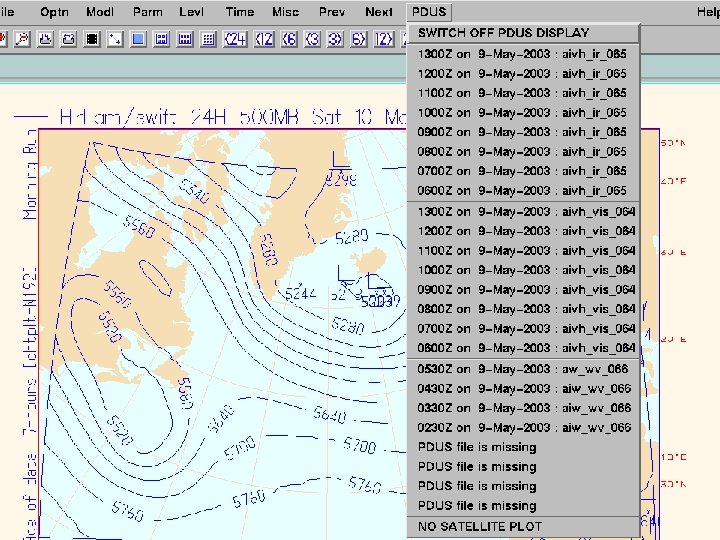
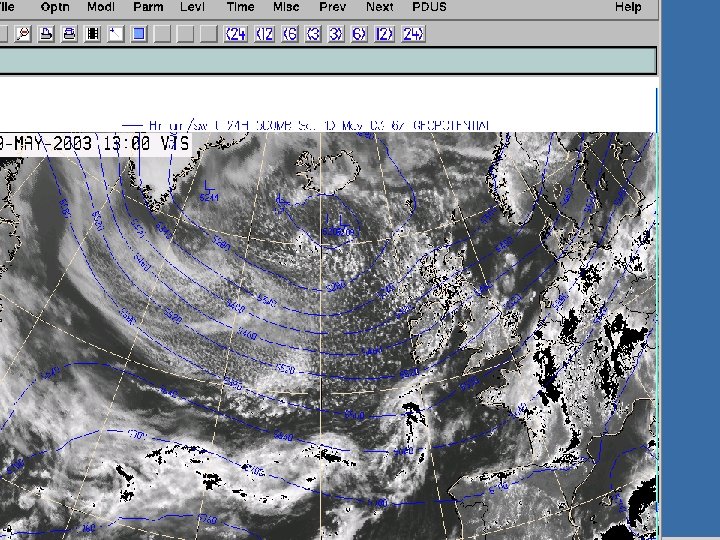
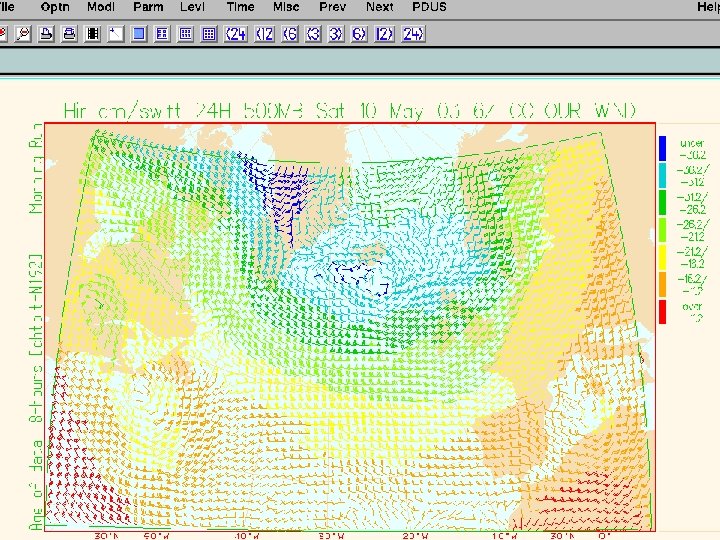
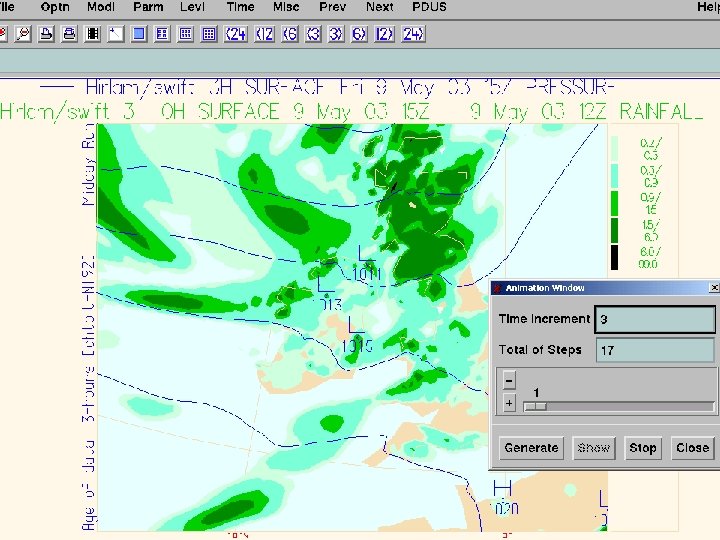
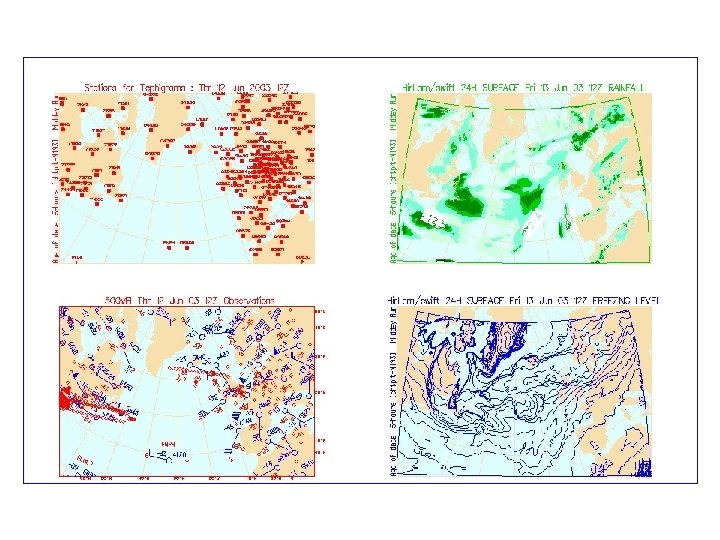
 MAIN FEATURES of XCHARTS Types of Data • NWP Output from Hirlam, ECMWF, UKMO, DWD • Observations [Surface / Upper-Air] : de-cluttering • PDUS Satellite data from METEOSAT [Polar. Stereographic Plot] Basic design Features • All possible charts allows : generated as needed • Derived products [e. g. Vorticity, Stability indices] • Latitude/longitude zoom ; Solid shading ; Animation • Vertical cross sections [generated as needed] • Overlay of satellite data [including ZAMG SATREP options]
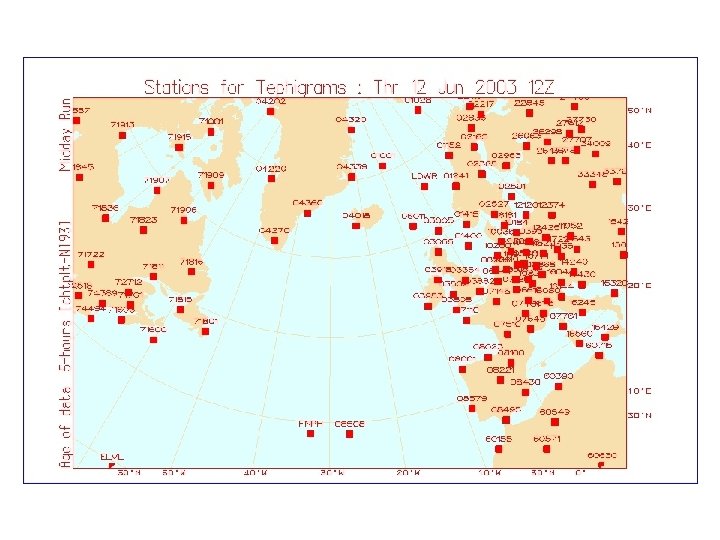
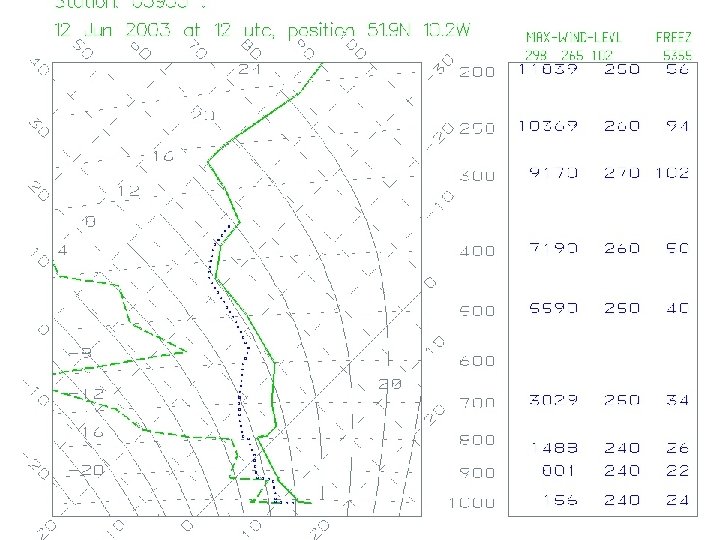
 OTHER FEATURES OF XCHARTS - I Difference Charts / Thickness Charts • All possible difference / thickness charts supported • Charts are generated as needed [via subtraction] Tephigram Plot • User can select station via WMO-number or from map SATREP products • Vorticity, Divergence, Advection, Frontal parameters etc. • SATREP report from ZAMG
 OTHER FEATURES OF XCHARTS - II Thresholding of Data • Allows user to set upper / lower thresholds • e. g. Plot of NWP output when temperatures are Negative • e. g. Plot of NWP output when winds are above 100 kts Hardcopy Option • Hardcopy is done by generating Post. Script files • Post. Script format can be vector or bitmap • Files can be saved as Post. Script or as EPS
![OVERVIEW of XCHARTS • Based on earlier command driven system [CHARTS] • GUI Interface](https://present5.com/presentation/3fe228e781195e53f772b846a00f25fd/image-15.jpg "OVERVIEW of XCHARTS • Based on earlier command driven system [CHARTS] • GUI Interface") OVERVIEW of XCHARTS • Based on earlier command driven system [CHARTS] • GUI Interface generates commands • Command-language used for ‘scripts’ • Display NWP / Observations / METEOSAT • Fields contoured ‘on-the-fly’ • Derived fields calculated ‘on-the-fly’ • Cross-sections • Animation • etc. .
OVERVIEW of XCHARTS • Based on earlier command driven system [CHARTS] • GUI Interface generates commands • Command-language used for ‘scripts’ • Display NWP / Observations / METEOSAT • Fields contoured ‘on-the-fly’ • Derived fields calculated ‘on-the-fly’ • Cross-sections • Animation • etc. .
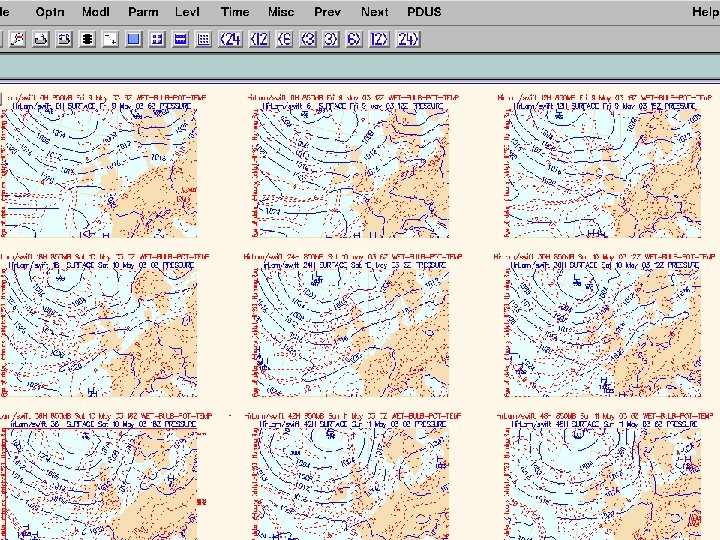
 Met Éireann XCHARTS Display System -- Summary STRENGTHS • User Friendly • Very fast • Access to many models • Large amount of information on single display [up to 9 charts possible] LIMITATIONS • Multiple overlays can be confusing • Unable to toggle on/off overlays • No on-screen analysis • No production capability • Does not support satellite animation
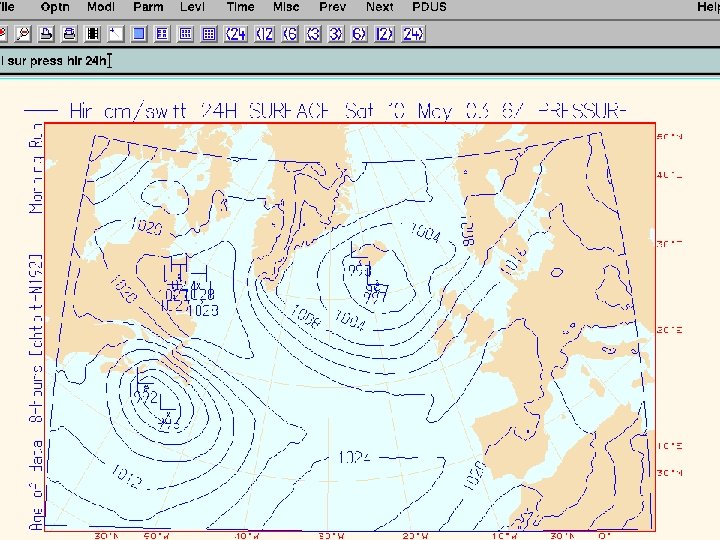
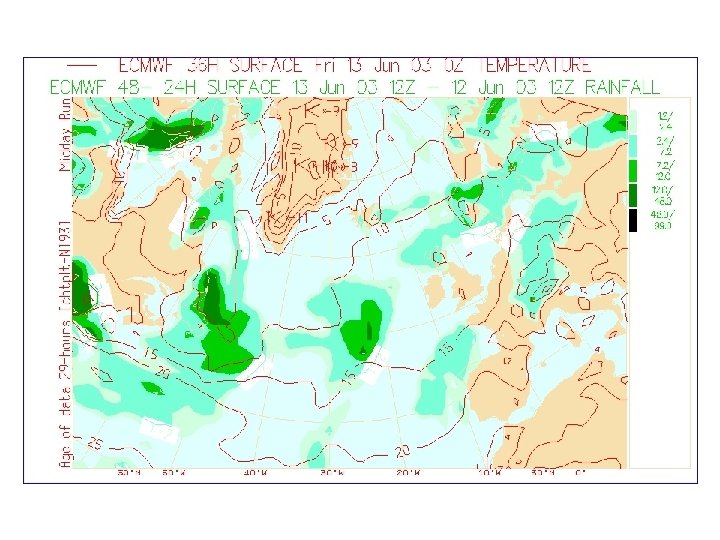
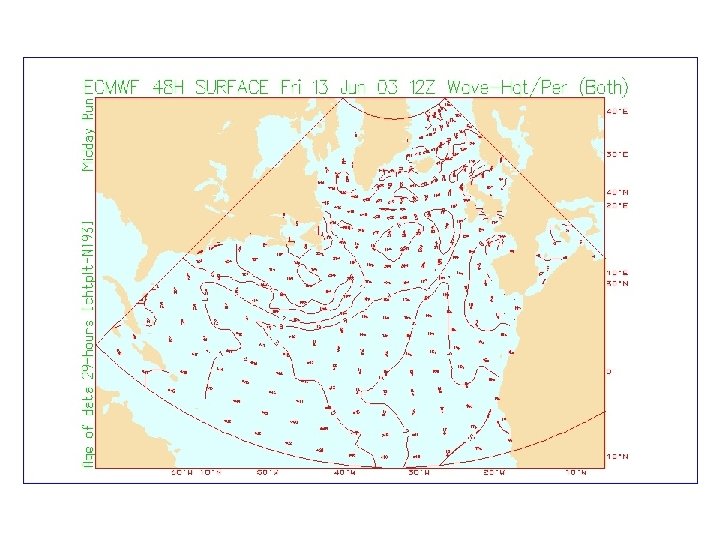
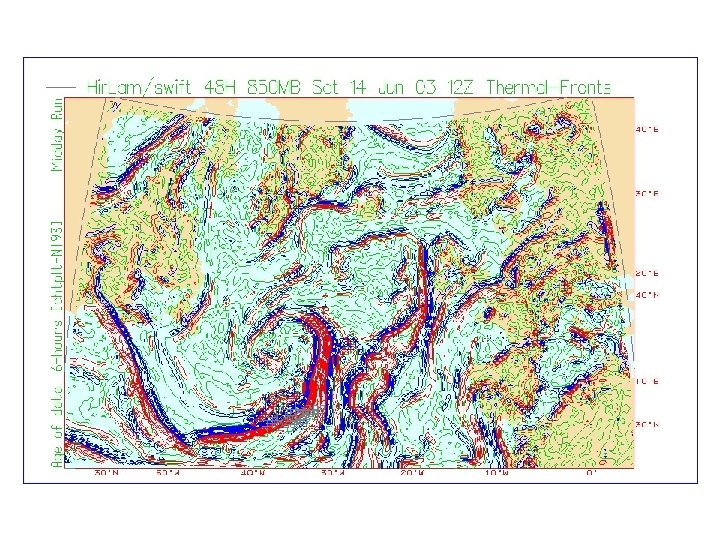
 SAMPLE PLOTS PRODUCED via XCHARTS The following slides show some examples of the type of chart which can be produced via XCHARTS. . .
 OTHER GRAPHICS SYSTEMS at MET-ÉIREANN GIS System used by Climatology • Arc. View vs 3. 2 on Windows NT-2000 TV-graphics system • Weather-ONE Metacast Borealis System on Linux External Website • External Website [www. met. ie] contains selection of charts Internal Website [Intranet] • Internal Website has many pre-calculated NWP products • Satellite and Radar animations ; Observation plots etc.
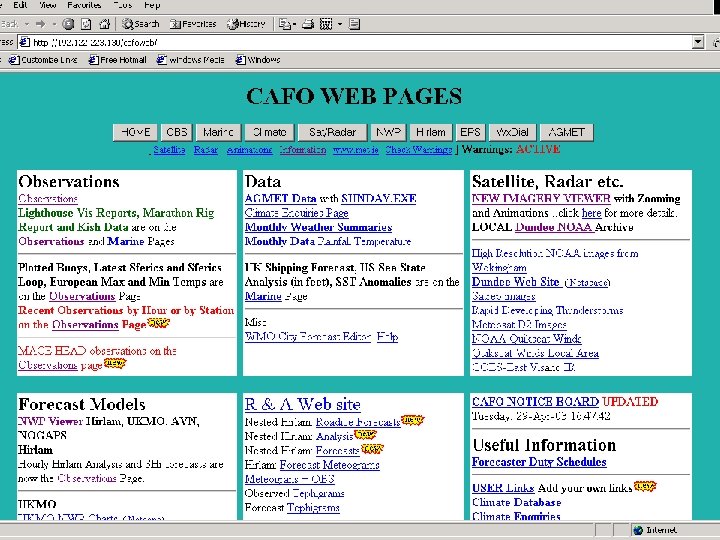
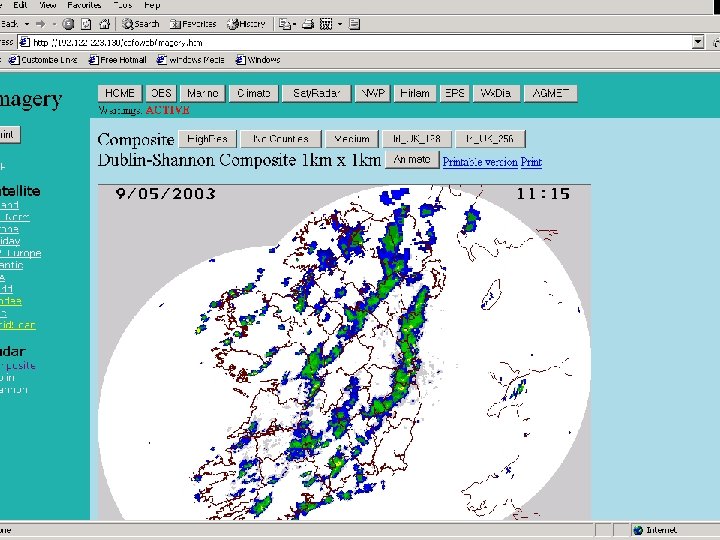
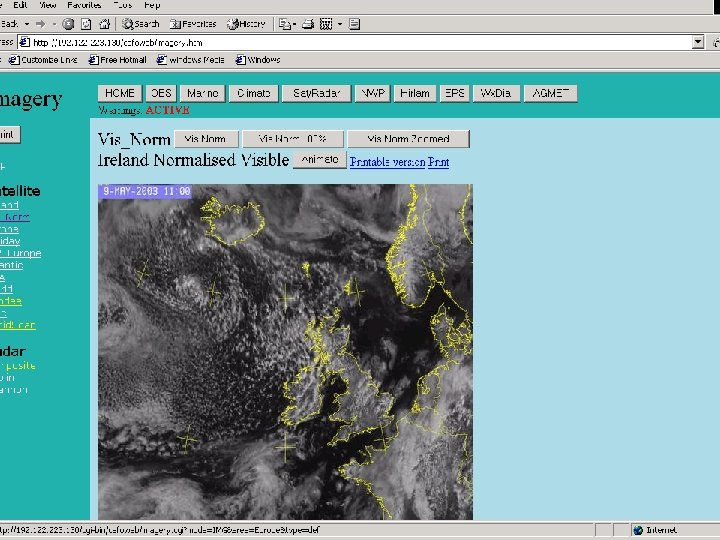
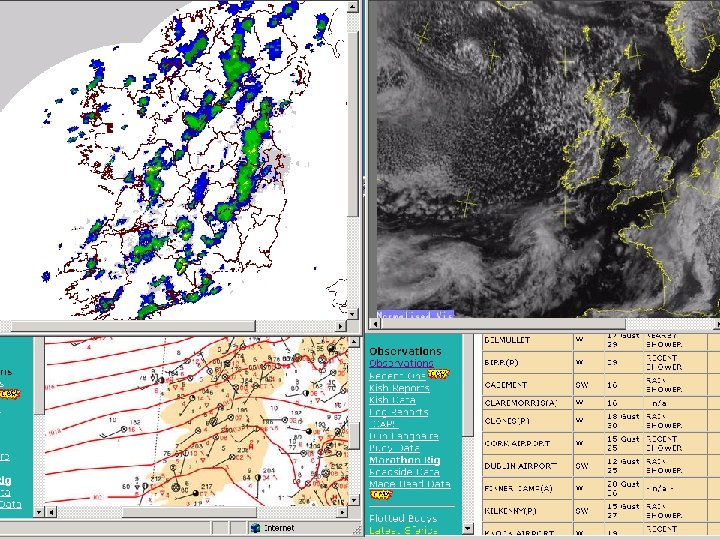
 Sample Met Éireann INTERNAL Web Pages The following slides show some examples of the type of web pages available internally at Met Éireann. . .
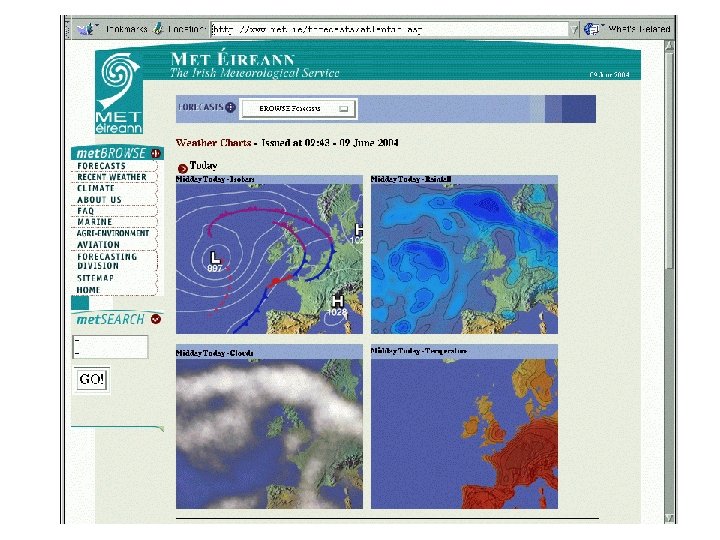
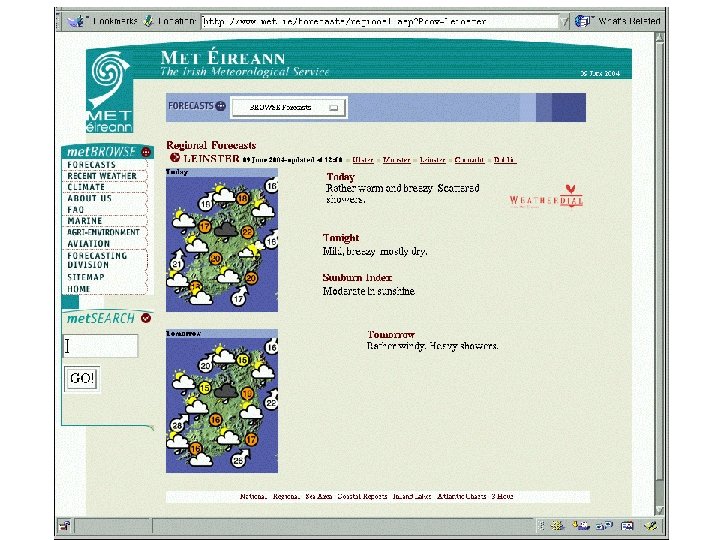
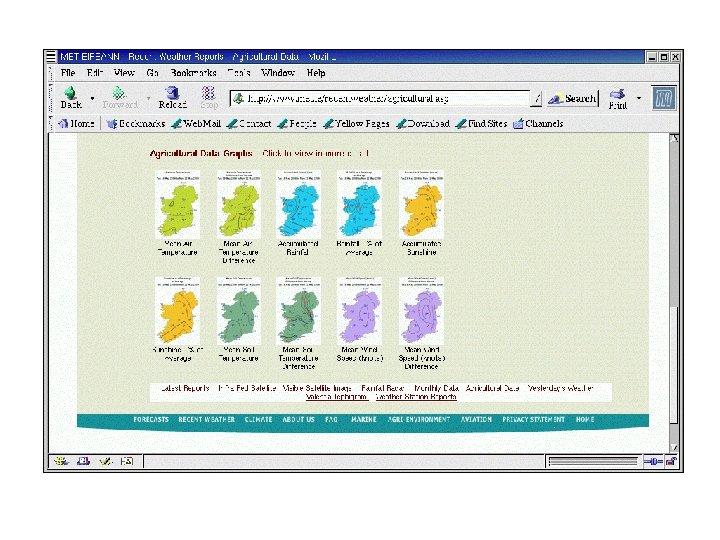
 Sample Met Éireann EXTERNAL Web Pages The following slides show some examples of the type of web pages available on the Met Éireann web site … www. met. ie
 Production of High-Quality Output for Newspapers … Program runs automatically Scattered data is interpolated to a regular grid Data on regular grid is contoured Contour lines stored as list of (x, y) coordinates Labels stored as (x, y) coordinates and text string Java program converts the coordinates to eps or png
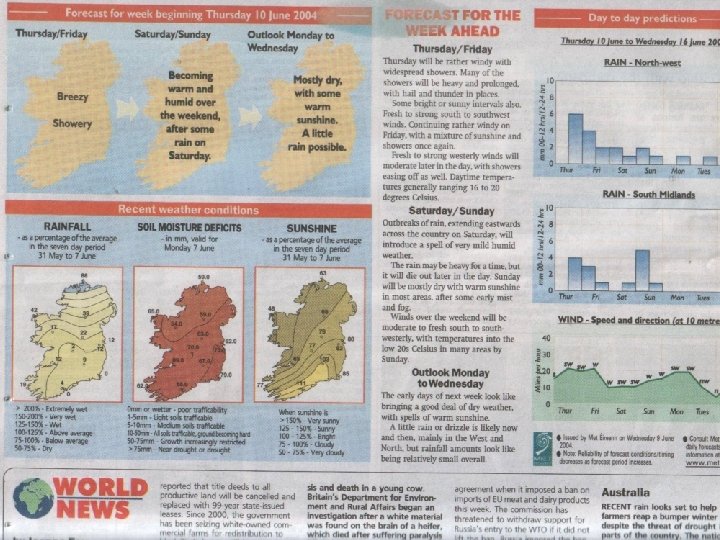
 Proposal for Newspaper Graphics Include Graphical Information to complement text Meteograms Temperature Rainfall Temperature and Rainfall two of the most important weather elements for agricultural activities
 From this To this
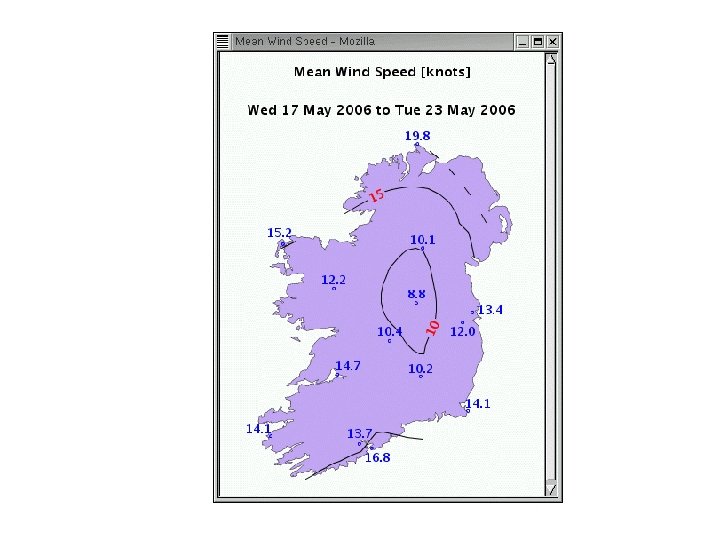
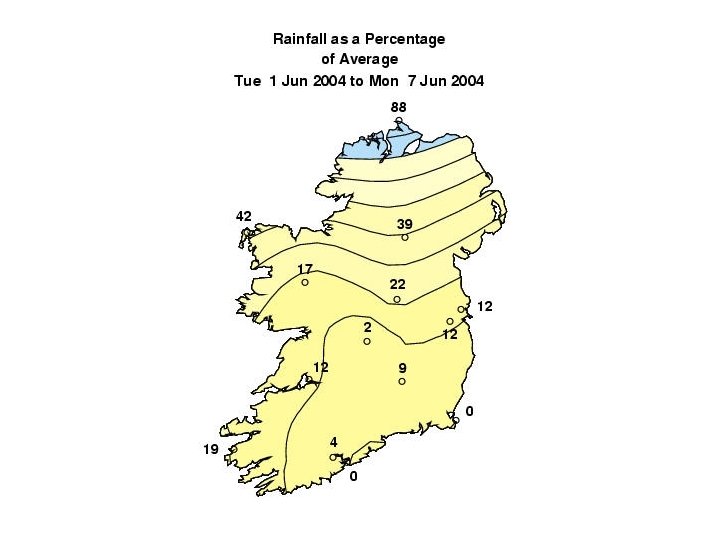
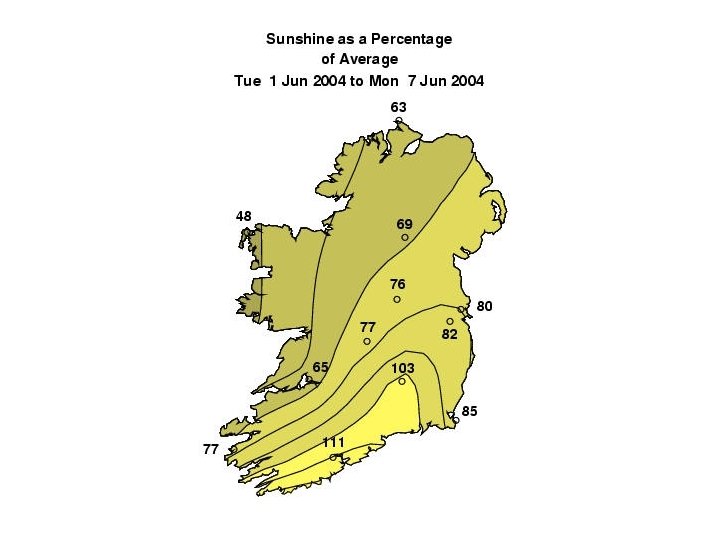
 Maps Show Forecast Conditions of Rainfall for next week as a percentage of normal….
 Meteograms show temperatures and rainfall in 6 and 12 hourly intervals for next seven days …. We propose one meteogram for a central location in each Province
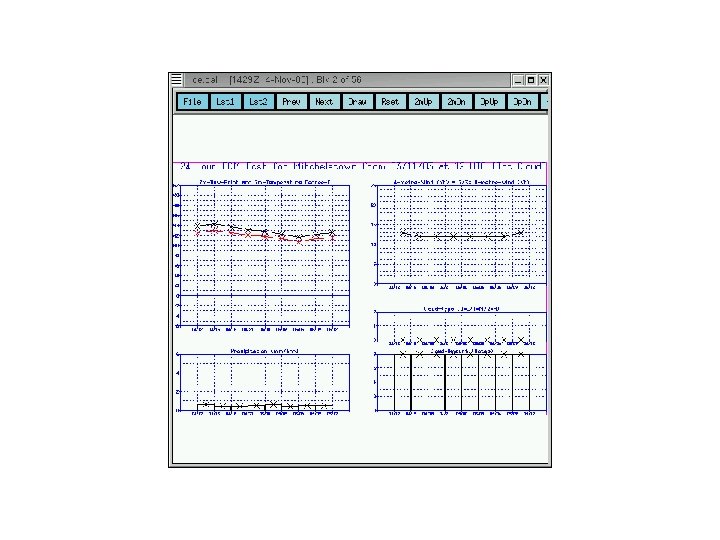
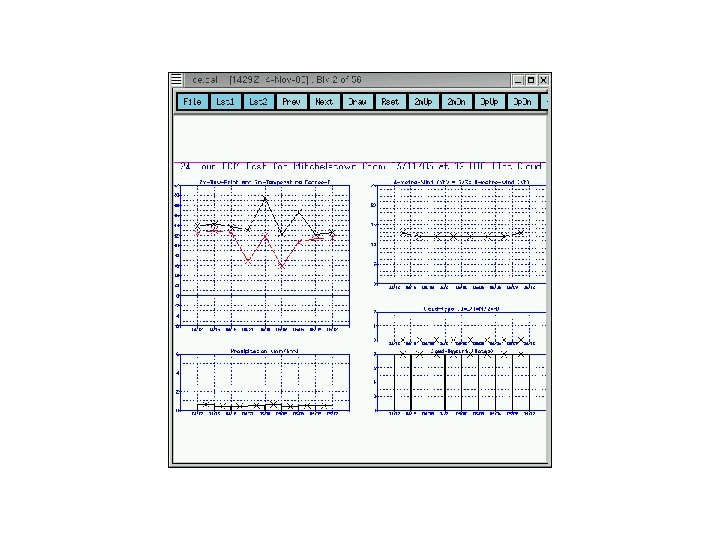
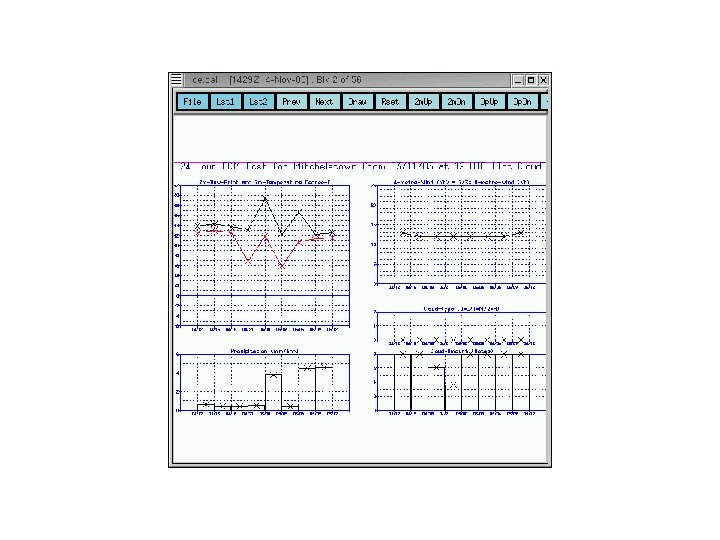
![Graphics Editor for Input to Road-Ice Model … Road-ice model predicts road conditions [Vaisala]](https://present5.com/presentation/3fe228e781195e53f772b846a00f25fd/image-51.jpg "Graphics Editor for Input to Road-Ice Model … Road-ice model predicts road conditions [Vaisala]") Graphics Editor for Input to Road-Ice Model … Road-ice model predicts road conditions [Vaisala] Input is time-series forecast for each station Temperature, dew-point, wind-speed, cloud, rainfall Input data based on Hirlam or ECMWF model run Forecaster edits input for each station [as required]
Graphics Editor for Input to Road-Ice Model … Road-ice model predicts road conditions [Vaisala] Input is time-series forecast for each station Temperature, dew-point, wind-speed, cloud, rainfall Input data based on Hirlam or ECMWF model run Forecaster edits input for each station [as required]
 PLANS for the FUTURE : Current Status CHALLENGES • Display • Modification YES [but needs much more integration] NO [Roadice program is a start] • Automatic Production NO [Some, but not integrated] NEED • Time-Series Point Database … being developed [Hirlam/MOS] • Time-Series Editor … planned [will be based on road-ice editor] • Improved Automatic Production facilities [e. g. for newspapers] TWO SEPARATE COMPONENTS • Editing of Data / Automatic production of products
 PLANS for the FUTURE : Requirements • Integrated Display System combining ALL data including NWP, Satellite, Radar, SAFs, observations • On Screen Analysis • Field Modification, both at synoptic and local scales as a precursor to automated production • Automatic productions systems • Need greater integration between systems – sharing of data and objects • Move away from a largely text based production to table/symbol based.
 POSSIBILITIES DEVELOP SYSTEM • Needs lots of resources • Further develop newspaper system [in Java] • Further develop ‘Road-ice editor’ as ‘Time-series editor’ PURCHASE SYSTEM • Cost considerations i. e. expensive • May not have full flexibility needed for our applications CO-OPERATION • Co-operate with another Met service to develop / extend system • Lack of human resources makes this difficult
 FINAL DECISION Intend to issue tender for supply of graphics system within the next few weeks In longer term will look at purchasing a production system [Preliminary announcement of tender process already in the European Journal].
 Thank You james. hamilton@met. ie kieran. commins@met. ie www. met. ie