f7fa2571c5489678395b01babe192547.ppt
- Количество слайдов: 32


Use of Integrated Virtual-Bronchoscopic Analysis During Live Bronchoscopy William E. Higgins, 1, 2 Atilla P. Kiraly, 1 Anthony J. Sherbondy, 1 Janice Z Turlington, 1 Eric A. Hoffman, 2 Geoffrey Mc. Lennan, 2 and James P. Helferty 1 1 Penn State University, Dept. of Electrical Engineering, University Park, PA 16802, USA 2 University of Iowa, College of Medicine, Iowa City, IA 52242, USA RSNA 2001, Chicago, IL, 24 -30 November 2001.

William E. Higgins, 1, 2 Atilla P. Kiraly, 1 Anthony J. Sherbondy, 1 Janice Z Turlington, 1 Eric A. Hoffman, 2 Geoffrey Mc. Lennan, 2 and James P. Helferty 1 1 Penn State University, Dept. of Electrical Engineering, University Park, PA 16802, USA 2 University of Iowa, College of Medicine, Iowa City, IA 52242, USA RSNA 2001, Chicago, IL, 24 -30 November 2001. 1. Introduction Trans-Bronchial Needle Aspiration (TBNA) is often used for assessing and staging lung cancer. To perform TBNA, the physician first visually examines a film of a patient’s 3 D CT chest scan for identifying suspect lymph node sites. Since the film only provides thick transverse-plane slices of the chest anatomy, biopsy path planning is imprecise. Later, during subsequent live bronchoscopy, the physician guides the bronchoscope to each desired lymph node site. The physician must use prior experience and the available 3 D CT chest film to do this guidance; this requires the physician to do 3 D mental reconstruction of the anatomy to ascertain each biopsy site. Further, the target lymph nodes are behind airway walls and hidden from the bronchoscope’s field of view. Overall, this results in low biopsy yields. We applied integrated virtual-bronchoscopic (VB) analysis to plan and assist live bronchoscopy. Before the procedure, a 3 D spiral-CT chest scan is analyzed with our custom computer-based VB system. The physician constructs a multimedia case study that can include MPR slice views, airway tree renderings, projection views, endoluminal views, thin-slab views, and airway quantitative information. These views can either be static shots or cine movie sequences. A

case study is saved as an interactive HTML report. The report can then be brought into the bronchoscopy suite on a standard laptop. Also, the VB system can be interfaced directly to the bronchoscope to provide live interactive virtual guidance. We demonstrate the system for phantom, animal, and human examples. The development of Virtual Bronchoscopy has led to proposals where computer-based image guidance assists the physician in performing TBNA. These proposals, summarized below, show promise, but can be improved upon: • Mc. Adams et al. (AJR 1998) -- Applied virtual bronchoscopy to lymph-node biopsy, but the system involved no live guidance. • Bricault et al. (IEEE-TMI 1998) – Did rudimentary registration of 3 D CT chest data to videobronchoscopy, but their results were limited. • Mori et al. (SPIE Medical Imaging 2000, 2001) -- registered videobronchoscopy images directly to rendered 3 D CT images with application to tracking, but their efforts do not work interactively.
 initial 3 D CT assessment and (b) direct")
2. Methods Our system provides: (a) initial 3 D CT assessment and (b) direct virtual guidance of live bronchoscopy. Below we outline our system’s: (A) hardware (B) software (C) clinical operation
, a physician uses a film of a")
Abstract To perform transbronchial needle aspiration (TBNA), a physician uses a film of a patient's CT scan for biopsy planning. Since the film only provides thick transverse-plane slices of the chest anatomy, biopsy planning tends to be difficult, resulting in low success rates. We applied integrated virtual-bronchoscopic (VB) analysis to plan and assist live bronchoscopy. Before the procedure, a 3 D spiral-CT chest scan is analyzed with our custom computer-based VB system. The physician constructs a multimedia case study that can include MPR slice views, airway tree renderings, projection views, endoluminal views, thin-slab views, and airway quantitative information. These views can either be static shots or cine movie sequences. A case study is saved as an interactive HTML report. The report can then be brought into the bronchoscopy suite on a standard laptop. Also, the computer-based VB system can be interfaced directly to the bronchoscope to provide live interactive virtual guidance. We demonstrate the system for phantom, animal, and human examples. learning objectives: 1. Show the feasibility of using virtual bronchoscopy during live bronchoscopy. 2. Demonstrate the concept of a web-based multimedia case study for 3 D CT assessment of the chest. 3. Describe a procedure for using virtual-bronchoscopic analysis for planning and live guidance of bronchoscopy.
 is often used for assessing and staging lung cancer.")
Introduction Trans-Bronchial Needle Aspiration (TBNA) is often used for assessing and staging lung cancer. To perform TBNA, the physician first visually examines a film of a patient’s 3 D CT chest scan for identifying suspect lymph node sites. Then, during subsequent live bronchoscopy, the physician guides the bronchoscope to each desired lymph node site. The physician must use prior experience and the available 3 D CT chest film to do this guidance – this requires the physician to do 3 D mental reconstruction of the anatomy to ascertain each biopsy site. Further, the target lymph nodes are behind airway walls and hidden from the bronchoscope’s field of view. Overall, this results in low biopsy yields. The development of Virtual Bronchoscopy has led to proposals where computer-based image guidance assists the physician in performing TBNA. These proposals, summarized below, show promise, but can be improved upon as our work demonstrates.

Image-Guided Bronchoscopy Systems Show potential, but recently proposed systems have limitations: • Mc. Adams et al. (AJR 1998) -- Applied virtual bronchoscopy to lymph-node biopsy, but the system involved no live guidance. • Bricault et al. (IEEE-TMI 1998) – Did rudimentary registration of 3 D CT chest image data to videobronchoscopy, but their results were limited. • Mori et al. (SPIE Medical Imaging 2001) -- registered videobronchoscopy images directly to rendered 3 D CT images with application to tracking, but their efforts do not work interactively. Our system, described below, provides: (1) initial 3 D CT assessment and (2) direct virtual guidance of live bronchoscopy

A. Image-Guided Bronchoscopy System - Hardware The figure below gives a hardware lay-out of our system. It is based on standard Windows-based PC technology and Matrox video hardware. The system is used for both 3 D CT Analysis and Live CT-Guided Bronchoscopy. Custom computer software, described below, provides all visual and quantitative interactions. 3 D CT Scan RGB, Sync, Video PC Enclosure Matrox Cable AVI File Video Capture Scope Monitor Matrox PCI card Scope Processor Endoscope Video Stream Main Thread Visualization, Open. GL Rendering Worker Thread endoluminal renderings Mutual Information CT-Video Matching Light Source Video AGP card Visual Data Dual CPU System

MDCT Scan RGB, Sync, Video PC Enclosure Matrox Cable AVI File Video Capture Scope Monitor Matrox PCI card Scope Processor bronchoscope Video Stream Main Thread Visualization, Open. GL Rendering Worker Thread endoluminal renderings Mutual Information CT-Video Matching Light Source Video AGP card Visual Data Dual CPU System

B. Image-Guided Bronchoscopy System - Software The system’s computer software consists of the following modules: a. Interactive graphical system for viewing the data, doing bronchoscopy planning, and performing live guided bronchoscopy -- many viewing tools: MPR slices, 3 D surface rendering, thin-slab viewing, endoluminal viewing, quantitative data plotting, and others -- all tools run simultaneously to provide a dynamic 3 D “augmented reality” for report building and bronchoscopic guidance b. Automated airway segmentation, employing a combination of 3 D region growing and morphological image processing c. Automated centerline definition, employing 3 D skeletonization, axial refinement, and B-spline analysis All software is written using Visual C++ 6. 0, Open. GL, and vtk.

C. System Operation The system is used in two separate stages: Stage-1: 3 D CT Assessment – Given the patient’s 3 D CT scan data, the following steps are taken: a. Extract the 3 D airway tree. b. Calculate centerlines through the major airways. c. Identify suspect lymph node sites. d. Build an HTML-based Case Report. Stage-2: Live CT-Guided Bronchoscopy – After the case report is built, the computer system is linked to the bronchoscope. The bronchoscopic video undergoes real-time distortion correction so that it matches the “virtual” 3 D CT world’s field of view. For each biopsy site: a. “Virtual” 3 D CT World (endoluminal renderings) is dynamically registered to the “Real” Bronchoscopic Video World. b. “Virtual” rendered lymph node sites are superimposed onto the bronchoscopic video. Distance from needle to lymph node also given. We give an example of using the system below:

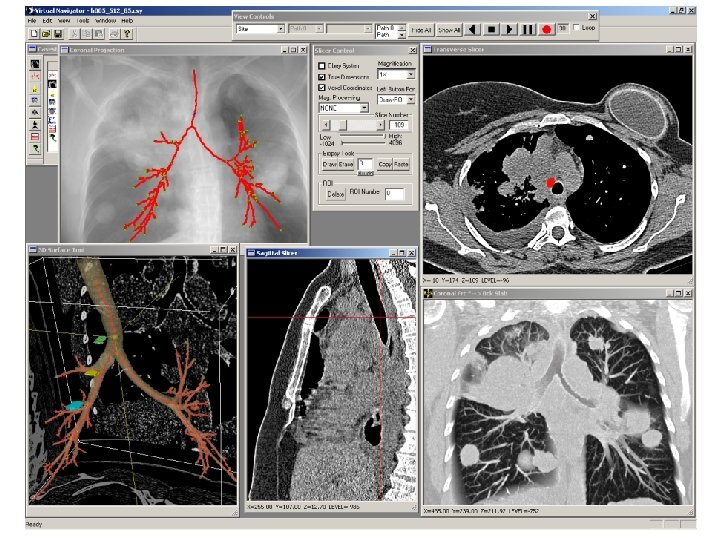
Stage 1: 3 D CT Assessment A scan was done for a lung-cancer patient on a Marconi Mx 8000 multidetector helical CT scanner. The scan consists of 479 slices (in-plane resolution = 0. 59 mm; slice thickness = 0. 60 mm). A view of the software system during suspect lymph-node site definition is shown on the next slide. The Coronal Projection tool shows a weighted-sum coronal projection of the 3 D CT image. The computed centerlines are depicted in red, branch points are in green, and a selected site of interest is in blue. The 3 D Surface Tool depicts a rendering of the automatically extracted airway tree, centerlines, and defined lymph-node regions. The ball is the selected site, and three defined target lymph nodes are colored green, yellow, and blue. The Tranverse Slicer uses a mediastinal window (WL = 40; WW=400) to depict a slice for defining the green lymph-node region. The Slicer Control indicates that the user is drawing this region, colored on the view. The Sagittal Slicer shows a sagittal MPR view at the selected site. The Coronal Slab tool depicts a coronal depth-weighted maximum slab view at the site of interest (focus =30; vision =40). Red dot indicates the site.

After the suspect lymph-node sites are defined, the Case Study is saved an HTML Case Report is generated:

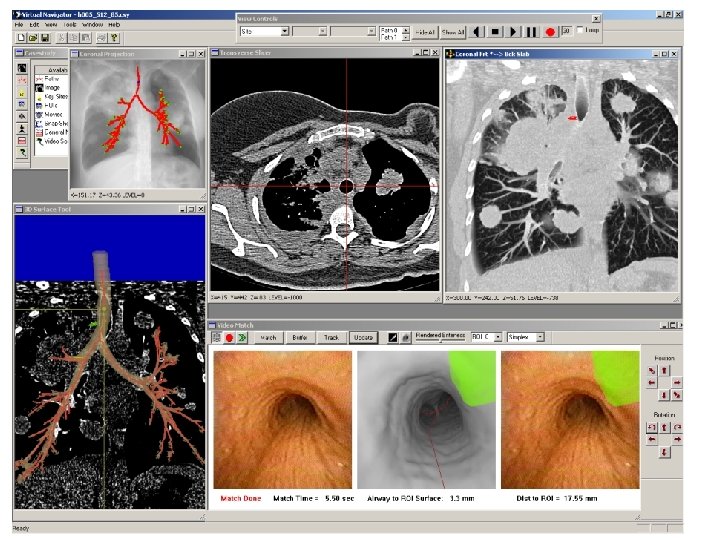
Stage 2: Live CT-Guided Bronchoscopy The computer is interfaced to the bronchoscope for live bronchoscopy. The previously defined case report is loaded. A view of the software system during bronchoscopy is shown on the next slide. Coronal Projection tool depicts the current site of the bronchoscope as a blue dot. (Centerline paths are in red, branch points in green. ) 3 D Surface Tool depicts the current site and direction as a ball and needle. current target lymph node is green. The Tranverse Slicer’s cross-hairs indicate the current site. Coronal Slab tool shows part of the previously defined target lymph node in red. The Video Match tool shows the following: LEFT: free-running live bronchoscopic video (distortion corrected) CENTER: virtual endoluminal rendered view MATCHED in 3 D to the current site of the bronchoscope. The green region is the target lymph node. Red line is the automatically computed centerline leading to site. RIGHT: virtual lymph node superimposed on real video “Dist to ROI” indicates distance of current site to target lymph node center. “Airway to ROI Surface” gives distance from airway wall to lymph node surface. ** These measures help determine where to make the actual biopsy.

3. Results We present three sets of validation results: A. Phantom Test controlled test free of subject motion B. Animal Studies controlled tests performed during in vivo circumstances C. Lung-Cancer Patients real biopsy situations

A. Phantom Test ** 6 physicians with a wide range of bronchoscopy experience tested 1. Glue 5 platinum beads to rubber phantom device. 2. Make a high-resolution 3 D Marconi CT scan. 3. Print 5 mm Transverse slices from CT image. 12 views per film. Include 3 Coronal summary views. 4. Set up phantom on bed, so that physician can only see the opening. The rest of the phantom model is hidden with a sheet. 5. Test biopsy accuracy with FILM ONLY and with VIRTUAL GUIDANCE.

Test 1: Biopsy using only Film film 1. Physician reviews CT film and coronal projection printout depicting biopsy-site numbers (metal beads). 2. Physician “biopsies” each site by sticking a needle into the phantom’s rubber wall as the best biopsy point and calls for a measurement. 3. A measurement is taken with a caliper as the distance between the metal bead and the line perpendicular to the needle direction. 4. Steps 2 and 3 are repeated for each site. Coronal projection

Test 2: Use of Virtual Guidance 1. The computer operator sets up computer display for guidance. This includes: Surface tool, Coronal projection, Transverse Slicer, Coronal Slab, and Video Match Tool. Also, the endoscope video with distortion correction is turned on. Next slide shows computer screen lay-out. Colored regions in 3 D Surface tool are the target beads. Bright spots on Coronal Slab depict how the beads appear in the 3 D CT data. 2. The physician identifies a target site for biopsy. The operator picks a virtual viewpoint on the path to render in the Video Match tool. 3. The physician guides the endoscope to a location close to the virtual view. The registration system matches the virtual view to the endoscope view. When a match is complete, the rendered site region is drawn on the endoscope video. 4. The physician uses the drawn target site on the endoscope image to guide the needle towards the target bead. The physician sticks the needle into the rubber wall as the best biopsy point and calls for a measurement. 5. A measurement is taken with a caliper as the distance between the metal bead and the line perpendicular to the needle direction. 6. Steps 2 to 5 are repeated for each target site.

Computer Set-up during Virtually Guided Phantom Biopsy
 5. 53 mm Std Dev: 4. 36 mm")
Phantom Accuracy Results (6 physicians tested) 5. 53 mm Std Dev: 4. 36 mm Ave. guided biopsy accuracy: 1. 58 mm Std Dev: 1. 57 mm Ave. film biopsy accuracy: Physician 1 2 3 4 5 6 film accuracy (mm) 5. 80 2. 73 4. 00 8. 87 8. 62 3. 19 guided accuracy (mm) 1. 38 1. 33 1. 49 1. 60 2. 45 1. 24 ALL physicians improved greatly with guidance In fact, ALL performed nearly the SAME with guidance, whereas the film-only results showed much variation
 CT Analysis: • • • Capture first 3 D CT")
B. Animal Studies 1) CT Analysis: • • • Capture first 3 D CT scan, with animal lung volume held constant. Define 6 ROI biopsy sites. Do tree and centerline analysis. 2) During Bronchoscopy (animal breathes freely): • • Navigate to each ROI. Apply Video Match method. Insert needle into site. Repeat for next ROI. 3) Capture second 3 D CT scan, with lung volume again held constant. 4) Analyze distance errors between planned ROIs and actual biopsies by comparing the ROI positions in the two CT scans. needle Computer during procedure

Animal Study: biopsy made at a site Coronal Weighted-Sum Projection of 3 D CT Scan with centerline to biopsy site. Position of needle after biopsy made. Positions of rendered ROI (from guidance system) and needle after biopsy made. Rendered airway tree. Green ball and virtual needle indicate 3 D position. Light rendered object is target ROI.

Composite View after All Real Biopsies Performed Rendered view of predefined biopsy Sites Depth-weighted thin-slab view of 3 D CT data AFTER all needles deposited for predefined sites. Bright “flashes” are the needles.

Planned site from CT analysis. Pictorial Result for Animal Experiment Darts placed directly above targets as expected. Note: Snapshots are misaligned to compensate for differing placement during CT scanning. Actual site after dart marker placement.

Errors for Animal Experiments • Distance from Center: calculation from ROI centroid point to the closest needle point. • Distance from ROI: calculation from closest ROI voxel to the closest needle point. Note: ROI 3 is considered an outlier and not included in the statistics calculation. Excellent performance despite animal motion

C. Human Lung-Cancer Patient Study 1. To date, sixteen lung-cancer patients have been enlisted using our protocol. 2. Patients undergo a high-resolution 3 D CT scan in a state-of-the-art Marconi Mx 8000 multi-detector helical CT scanner. Images typically contain over 400 contiguous slices. 3. Most patients have been enrolled for mediastinal lymph-node biopsy. 4. biopsy yield rate of lymph tissue has been near 100% (based on histology) 5. system does not appear to be difficult or time-consuming to use 4. A few have been enrolled for airway-obstruction analysis and peripheral-nodule biopsy. 5. system appears to have potential for guiding a bronchoscopist to distant peripheral sites 6. quantitative airway measurement facility is being perfected for designing accurate stents using VB analysis

H 006 composite `

Other Publications Discussing Technical Aspects of System n Airway Tree Segmentation: A. P. Kiraly, E. A. Hoffman, G. Mc. Lennan, W. E. Higgins, and J. M. Reinhardt, “ 3 D Human Airway Segmentation for Virtual Bronchoscopy, ” to appear, SPIE Medical Imaging 2002: Physiology and Function from Multidimensional Images, A. Clough and C. T. Chen, eds. n 3 D centerline calculation and details on Visualization System: R. D. Swift, A. P. Kiraly, A. J. Sherbondy, A. L. Austin, E. A. Hoffman, G. Mc. Lennan, and W. E. Higgins, “Automatic Axes. Generation for Virtual Bronchoscopic Assessment of Major Airway Obstructions, ” Computerized Medical Imaging and Graphics, Dec. 2001. n Endoscope Video-Distortion Correction: J. P. Helferty, C. Zhang, G. Mc. Lennan, and W. E. Higgins, “Videoendoscopic distortion correction and its application to virtual guidance of endoscopy, ” IEEE Transactions on Medical Imaging, pp 605 -617, vol. 20, no. 7, July 2001. n Registration technique for matching rendered 3 D CT views and video frames: J. P. Helferty and W. E. Higgins, “Technique for Registering 3 D Virtual CT Images to Endoscopic Video, ” 2001 IEEE Int. Conf. Image Processing, Thessaloniki, Greece, 7 -10 October 2001. n Sliding Thin-Slab Volume Visualization: J. Z Turlington and W. E. Higgins, “New Techniques for Efficient Sliding Thin-Slab Volume Visualization, ” IEEE Transactions on Medical Imaging, pp. 823 -835, vol. 20, no. 8, Aug. 2001. Also, RSNA 2001 talk: J. Z Turlington et al. , “Fast Depth-Based Sliding Thin-Slab Methods: Application to 3 D Chest CT, ” Monday, 11/26/2001, 2: 48 PM, Room E 351.

4. Conclusion 1. The system enables detailed 3 D CT Analysis for follow-on bronchoscopy. It has potential for: (a) mediastinal lymph-node biopsy (b) airway analysis (c) peripheral nodule biopsy 2. Detailed HTML reports, consisting of many views, movies, and quantitative data provide a “roadmap” for bronchoscopy and treatment planning beyond CT film analysis. 3. The system is particularly effective for live guidance of bronchoscopy. 4. The system’s Augmented Reality viewing gives the physician considerable information for performing more accurate biopsy 5. 4. Phantom, Animal, and Human tests are validating the system’s efficacy and ease of use. Acknowledgments This work was partially supported by NIH Grants #CA 74325, CA 91534, and RR 11800, and by the Whitaker Foundation and Olympus Corporation. Janice Cook. Granroth, Angela Delsing, Kurt Wolf, and Dr. Alan Ross assisted in the studies. Drs. Scott Ferguson, Karl Thomas, Shaher Samera, Bruce Denney, Cyril Rooney, and Lakshmi Durairai participated in the phantom study.

Acknowledgments This work was partially supported by NIH Grants #CA 74325, CA 91534, and RR 11800, and by the Whitaker Foundation and Olympus Corporation. Janice Cook-Granroth, Angela Delsing, Kurt Wolf, and Dr. Alan Ross assisted in the studies. Drs. Scott Ferguson, Karl Thomas, Shaher Samera, Bruce Denney, Cyril Rooney, and L. Lakshmi Durairai participated in the phantom study.
f7fa2571c5489678395b01babe192547.ppt