b428c413b9445f3a28cd1f05204e9f33.ppt
- Количество слайдов: 21


Upper Newport Bay: Alternative 1 • • Lower basin deepened Addition of channel between tern islands Channel between basins Bullnose wetlands Side channel around New Island 100 -ft barge access channel from lower basin (II) to PCH bridge Side channels around Middle & Shellmaker Islands Wetland restoration at Northstar Beach & Shellmaker Island, eelgrass beds, etc.

Upper Newport Bay: Alternative 4 • • Expanding & deepening both basins (mud flats removed) Removal of 1 tern island to lower basin Segment main dike Bullnose wetlands Side channel around New Island 100 -ft barge access channel from lower basin (II) to PCH bridge Side channels around Middle & Shellmaker Islands Wetland restoration at Northstar Beach & Shellmaker Island, eelgrass beds, etc.
")
Upper Newport Bay: Alternative 5 • • Expansion of upper basin only (no deepening) Removal of 1 tern island to lower basin Segment main dike Bullnose wetlands 100 -ft barge access channel from lower basin (II) to PCH bridge Side channels around Middle & Shellmaker Islands Wetland restoration at Northstar Beach & Shellmaker Island, eelgrass beds, etc.

Upper Newport Bay: Alternative 6 • • • Expansion of upper basin Moderate expansion of lower basin Deepen both basins Removal of 1 tern island to lower basin Segment main dike Bullnose wetlands Side channel around New Island 100 -ft barge access channel from lower basin (II) to PCH bridge Side channels around Middle & Shellmaker Islands Wetland restoration at Northstar Beach & Shellmaker Island, eelgrass beds, etc.

Table 4. 9 Environmental Quality Account CATEGORY No Action Alt 1 Alt 4 Alt 5 Alt 6 Bay Sediment Deposition Uncontrolled sedimentation throughout Upper & Lower Bay after upper basin fills in. Habitat degradation, adverse species impacts, shoaling in nav channels, islands become peninsulas. Better control of sediment deposition in upper & lower basins, reducing sediment deposition below the basins. Least effective of all alts in trapping sediments. Most efficient alt in trapping sediments within upper & lower basins. 3 rd most effective alt in trapping sediments. Upper basin would act as sole sediment trap. Lower basin will continue to fill in w/ loss of more open water areas. 2 nd most efficient alt in trapping sediments within upper & lower basins. Water Quality Uncontrolled sedimentation would increase turbidity & degrade WQ throughout Bay. Decrease in volume of water in upper basins & reduced circulation would lead to more frequent violation of WQ standards. Much greater freshwater influence. Most beneficial uses of Bay waters impaired. Most effective alt at improving long term WQ due to increased sediment trapping. Least fluctuation in salinity levels during storm events w/ this alt. Least effective alt during storm events in maintaining salinity levels in Upper Bay (only upper basin restored). Improves WQ throughout Bay due to sediment trapping. Similar to Alt 4 in overall effect during storm events. Long term benefits similar to Alt 4. …
 CATEGORY No Action Alt 1 Alt 4")
Table 4. 9 Environmental Quality Account (cont’d) CATEGORY No Action Alt 1 Alt 4 Alt 5 Alt 6 Air Quality No impacts Some AQ impacts associated w/ constr. & maint. activities. Based on total # of dredge days, Alt 1 has greatest potential AQ impact. Impacts could be mitigated through best available control technology & restricting hours of operation. As in Alt 1, some AQ impacts. 3 rd greatest impact to AQ based on # of dredge days. As in Alt 1, some AQ impacts. 2 nd greatest impact to AQ based on # of dredge days. As in Alt 1, some AQ impacts. Least impact to AQ based on # of dredge days. Noise No impacts Noise impacts could be mitigated to insignificant by reducing equip noise or restricting ops to daytime hours. Based on total # of dredge days, Alt 1 has greatest potential noise impact. Impacts similar to Alt 1. 3 rd greatest impact to noise based on # of dredge days. Impacts similar to Alt 1. 2 nd greatest impact to noise based on # of dredge days. Impacts similar to Alt 1. Least impact to noise based on # of dredge days. Benthic (Aquatic) Habitat Loss of 79% open water areas in Upper Bay. Increased freshwater & lower WQ would reduce diversity of aquatic species. Decreased circulation & increased freshwater would decrease aquatic prey base. Would maintain aquatic habitat in upper basin & restore aquatic habitat in lower basin. Overall open water habitat increases by 5%. Would maintain diversity of aquatic species by reducing freshwater influence (least effective of alts). Would expand aquatic habitat in upper & lower basins by 30%. Would maintain diversity of aquatic species by reducing freshwater influence. Would expand aquatic habitat in upper & lower basins by 11%. No restoration of open water habitat in lower basin. Would maintain diversity of aquatic species. Would expand aquatic habitat in upper & lower basins by 20%. Would maintain diversity of aquatic species by reducing freshwater influence.
 CATEGORY No Action Alt 1 Alt 4")
Table 4. 9 Environmental Quality Account (cont’d) CATEGORY No Action Alt 1 Alt 4 Alt 5 Alt 6 Intertidal Mudflat Habitat Intertidal mudflat would expand by 47% in 50 yrs. Increased freshwater influence would result in decrease in invertebrate diversity. Would result in loss of 4% of intertidal mudflat habitat but decreased freshwater influence would maintain invertebrate diversity. Would result in a loss of 26% of intertidal mudflat habitat w/ biggest loss in lower basin but decreased freshwater influence would maintain invertebrate diversity. Would result in a loss of 8% of intertidal mudflat habitat w/ biggest loss in upper basin but decreased freshwater influence would maintain invertebrate diversity. Would result in a loss of 18% of intertidal mudflat habitat w/ biggest loss in lower basin but decreased freshwater influence would maintain invertebrate diversity. Marsh Habitat Marsh habitat would increase by year 50, but would be degraded due to loss of inundation. Marsh birds vulnerable to terrestrial predators. Marsh habitat would be maintained. Restoration of side channels would reduce vulnerability of marsh birds to terrestrial predators. Same as Alt 1, w/ exception of lower basin area. Species using New Island would be more vulnerable to terrestrial predators since there is no restoration of the side channel. Same as Alt 1. Wildlife Habitat for waterfowl, terns, gulls, pelicans, & other open water bird species would be lost. Habitat for shorebirds & wading birds increases. Prey base for all birds that forage on aquatic species decreases. Habitat for waterfowl, terns, gulls, pelicans, & other open water bird species would increase. Improved WQ & decreased freshwater influence increases the prey base for species that forage on aquatic fish & invertebrates. The least AAHUs (= to Alt 5). Similar overall benefits to wildlife as Alt 1. The greatest AAHUs based on HEP analysis. Similar overall benefits to wildlife as Alt 1. The least AAHUs (= to Alt 1). Similar overall benefits to wildlife as Alt 1. The 2 nd greatest AAHUs based on HEP analysis.
 CATEGORY No Action Alt 1 Alt 4")
Table 4. 9 Environmental Quality Account (cont’d) CATEGORY No Action Alt 1 Alt 4 Alt 5 Alt 6 Terrestrial Habitat Terrestrial habitat would increase. Terrestrial habitat would not be affected. Same as Alt 1. Endangered Species Significant detrimental impacts to least terns & brown pelicans from loss of foraging habitat & decrease in fish prey base. Light-footed clapper rail & Belding’s savannah sparrow gain habitat but would be more vulnerable to predators from silting in of channels. Foraging habitat for brown pelicans & least terns would be maintained. Restoration of side channels would help protect light-footed clapper rails & Belding’s savannah sparrows from terrestrial predators. Decreased freshwater influence & increased WQ would enhance aquatic prey base for pelicans, terns, & clapper rails. Less effective than Alts 4 & 6 because side channel around small tern island in upper basin would not be restored. Same benefits as Alt 1. More habitat available to least terns w/ the relocation of 1 of the islands in the upper basin to the lower basin. Same benefits as Alt 1, except no restoration of side channel around New Island in lower basin. Greater potential for storms to fill in the open water areas could cause greater terrestrial predation of clapper rails & least terns at the relocated island. Same as Alt 4. Cultural Resources None affected. No cultural resources identified except for Bullnose area, which will be surveyed prior to restoration to ensure cultural site will not be affected. Same as Alt 1. Aesthetics Continued sedimentation will degrade viewing areas around bay, including Back Bay Drive & surrounding Temporary minor visual impacts w/ dredge. Long-term improvement of aesthetic viewing by maintaining healthy balance of estuarine habitats. Same as Alt 1.

Table 4. 10 Regional Economic Development CATEGORY No Action Alt 1 Alt 4 Alt 5 Alt 6 Employment No impacts. Construction activities will create some temporary employment related to dredging. Same as Alt 1. Business & Industry Tourist industry & educational opportunities decline as the ecological preserve habitats degrade. Trapping of sediments in upper basins would help to maintain channels for boaters & would enhance Bay environment for all recreational users. Same as Alt 1. Local Government Finance Sponsor & local interests will have to provide significant amounts of $ to maintain access to marinas & boat launch ramps in UNB, more than any of the other alts. Non-federal sponsor initial investment of $6 million for construction, & $14. 4 million for O&M every 7 years on average. Total avg ann O&M costs equal about $1. 05 million. Non-federal sponsor initial investment of $14. 1 million for construction, & $38. 4 million for O&M every 24 years on average. Total avg ann O&M costs equal about $. 691 million. Non-federal sponsor initial investment of $6. 5 million for construction, & $17. 8 million for O&M every 10 years on average. Total avg ann O&M costs equal about $1. 31 million. Non-federal sponsor initial investment of $11. 4 million for construction, & $31 million for O&M every 21 years on average. Total avg ann O&M costs equal about $. 702 million. Growth Inducing Impacts No projected impacts to growth in the area. Same as No Action.

Table 4. 10 Other Social Effects CATEGORY No Action Alt 1 Alt 4 Alt 5 Alt 6 Public Health & Safety Federal & local channels will require continued maintenance to provide safe & navigable channels due to extensive shoaling. Bay water quality problems may also affect health during water contact activities. Movement of disposal scows through the Lower Bay during dredging poses some hazard to recreational boaters. Impact can be mitigated through training of scow operators to watch out for boaters. Shoaling in navigation channels will be significantly reduced. WQ will improve in the Bay. Same as Alt 1. Recreation Degraded ecosystem will reduce all recreation & education opportunities. Some conflicts w/ recreational users will occur during dredging. Trapping of silt in upper basins will enhance rec opportunities throughout the Bay following project completion. Same as Alt 1. Traffic No major impacts to vehicles. Boat impacts are significant, as stated in Public Health & Safety. No major impacts to vehicles. Boat impacts during construction are covered under Public Health & Safety. Same as Alt 1.

Table 4. 12 Summary of Ranking of Alternative Plan Features FEATURES RANK ( 1 = best, 5 = worst) No Action Alt 1 Alt 4 Alt 5 Alt 6 N/A 1 4 2 3 5 4 1 3 2 N/A 1 4 2 3 Total # of Dredge Days (initial construction, O&M) 5 4 3 2 1 Habitat Change (intertidal mudflat change: < is better) 5 1 4 2 3 HEP Benefits (overall gain in AAHUs) N/A 3 1 3 2 1 st Cost for Alternatives (< is better) N/A 1 4 2 3 Avg Ann Overall Costs (1 st const & O&M < is better) 5 1 4 2 3 Avg Ann O&M Costs (< is better) 5 2 1 3 1 N/A 2 3 4 1 5 4 1 3 2 Init Dredge Volumes (< is better) Avg Dredge Cycle (yrs) (> length of time better) Future Dredge Volumes (< is better) NER Avg Annual $/AAHU (< is better) Sediment TMDL long-term maintenance (> interval is better) …
 FEATURES RANK (")
Table 4. 12 Summary of Ranking of Alternative Plan Features (cont’d) FEATURES RANK ( 1 = best, 5 = worst) No Action Alt 1 Alt 4 Alt 5 Alt 6 ENVIRONMENTAL QUALITY Sediment Deposition (based on storage capacity: > is better) 5 4 1 3 2 Water Quality 4 2 1 3 1 Air Quality (based on total # dredge days for the project) 5 4 3 2 1 Noise (also based on # dredge days) 5 4 3 2 1 Benthic Habitat (< open water increase is better) 5 4 1 3 2 Mudflat Habitat (<10% change is better) 5 1 4 2 3 Marsh Habitat 3 1 1 2 1 Wildlife 4 3 1 3 2 Terrestrial (no action increases habitat, alts have no impact) 1 2 2 Endangered Species 3 1 1 2 1 Cultural Resources 1 2 2 Aesthetics 2 1 1 RED/ OSE Local Government Finance for Initial O&M N/A 1 4 2 3 Local Government Finance for Future O&M 4 2 1 3 1 SUMMARY TOTAL: 77 56 56 60 47

Table 4. 8 NER Account - Outputs No Action Marine Open Water Alt 1 Alt 4 Alt 5 Alt 6 62 119 150 125 138 107 75 59 71 68 Low salt marsh 47 44 44 Middle salt marsh 56 55 56 5 3 3 Total Avg Ann Sed Control HU’s 277 296 312 298 309 Net Increase in Sed Control AAHU’s 0 19 35 21 32 Added Habitat Restoration AAHU’s 0 13 14 11 14 Total Increase in AAHU’s 0 32 49 32 46 17, 184, 000 40, 146, 000 18, 643, 000 32, 475, 000 Interest (6. 625%, 50 yrs) 1, 216, 000 2, 974, 000 1, 329, 000 2, 369, 000 Avg Ann OMRR&R 1, 045, 000 691, 000 1, 310, 000 702, 000 Total Avg Ann Costs 2, 261, 000 3, 665, 000 2, 639, 000 3, 071, 000 75, 000 82, 000 67, 000 Intertidal mudflat High Salt Marsh Total First Costs Avg Ann Cost/ AAHU

Upper Newport Bay: All Alternative Plans Alternative 5 Cost: $2. 639 mil Output: 32 HU’s Alternative 6 Cost: $3. 071 mil Output: 46 HU’s Alternative 4 Cost: $3. 665 mil Output: 49 HU’s Alternative 1 Cost: $2. 261 mil Output: 32 HU’s

Upper Newport Bay: Results of Cost Effectiveness Analysis Alternative 4 Cost: $3. 665 mil Output: 49 HU’s Alternative 6 Cost: $3. 071 mil Output: 46 HU’s Alternative 1 Cost: $2. 261 mil Output: 32 HU’s

Upper Newport Bay: Results of Incremental Cost Analysis Alternative 4 Cost: $3. 665 mil Output: 49 HU’s Increm Cost/ Output: $. 198 mil/ HU Alternative 6 Cost: $3. 071 mil Output: 46 HU’s Increm Cost/ Output: $. 067 mil/ HU

Upper Newport Bay: Plan Comparison & Selection PLAN 1 PLAN 4 – PLAN 5 (Max outputs) SPONSOR – Orange County NO – sediment YES TMDL issue, dredging maintenance frequency “Compromise” Plan NO – sediment YES TMDL issue, dredging maintenance frequency STATE – Fish & Game, UNBER U. S. FISH & WILDLIFE SERVICE PLAN 6 YES NO – mudflat loss too great NER Plan

Water Resources Development Act of 2000 • TITLE I – WATER RESOURCES PROJECTS – SEC. 101 PROJECT AUTHORIZATIONS (b) PROJECTS SUBJECT TO FINAL REPORT – The following projects for water resources development and conservation and other purposes are authorized to be carried out by the Secretary substantially in accordance with the plans, and subject to the conditions, recommended in the final report of the Chief of Engineers if a favorable report of the chief is completed not later than December 31, 2000: (9) UPPER NEWPORT BAY, CALIFORNIA – The project for ecosystem restoration, Upper Newport Bay, California, at a total cost of $32, 475, 000 with an estimated Federal cost of $21, 109, 000 and an estimated non-Federal cost of $11, 366, 000

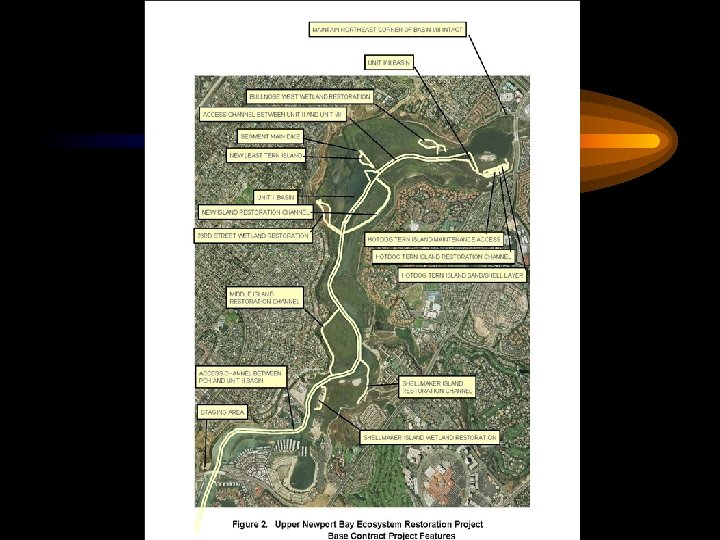
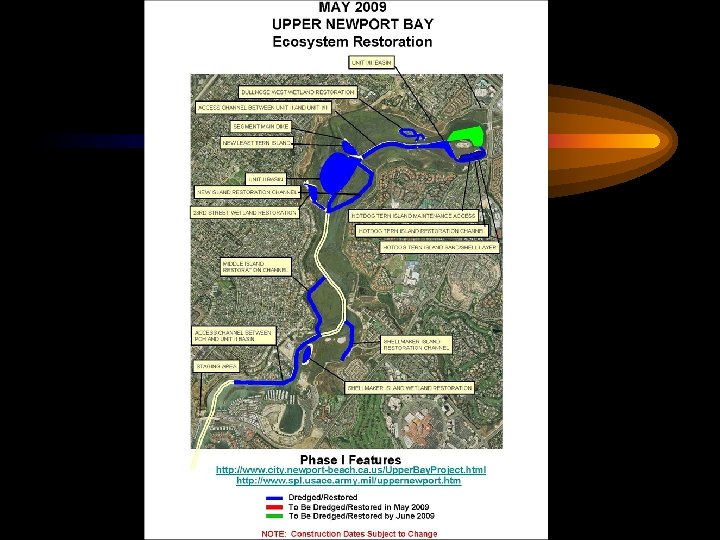
Upper Newport Bay Schedule • Feasibility completed 2000 • Authorized WRDA 2000 contingent upon favorable Chief’s Report (29 Dec 2000) • Study Manager (Jim Hutchison) – Corps Planner of the Year 2001 • PED completed 2003 • PCA (now PPA) executed 2005, but very little funding • Construction started in April 2006 • Dredging completed on main access channel, Hot Dog/Tern Is. , Shellmaker Is. , Middle Is. , and New Is. channels; Hot Dog/Tern Is. and new Least Tern Is. restorations; Unit II basin; Shellmaker Is. wetland Bullnose wetland restorations. • Phase 2 completion (Unit I/III basin + additional Unit II dredging) scheduled for Sept 2010 w/ stimulus funding • POC’s: Ehsan Eshraghi & Jane Grandon, LA District PM’s • Backstory: OMB never supported (claiming no “federal” interest in maintaining local navigation channels); but project funded through Congressional “adds” in annual appropriation bills
b428c413b9445f3a28cd1f05204e9f33.ppt