

52c2d36be155b81636d3febb41df703b.ppt
- Количество слайдов: 124
 Updates in Clinical Electrophysiology: Diagnosis, Auditory Training, and Amplification Samuel R. Atcherson, Ph. D. Professor and Director of Audiology University of Arkansas at Little Rock, University of Arkansas for Medical Sciences sratcherson@ualr. edu
 My Geographical Journey 2
 University of Arkansas for Medical Sciences University of Arkansas at Little Rock, AR
 Agenda I. Brief review of auditory evoked potentials II. Updates in click, chirp, and speech-evoked auditory brainstem responses III. Middle latency and cortical response updates, including the HEARLab System IV. Q&A
 5") My Academic Lineage with Electrophysiology (and possibly yours as well? ) 5
My Academic Lineage with Electrophysiology (and possibly yours as well? ) 5
 Jasper defined the electrode positions in the international Lindsley 10/20 system in 1958 Davis Jasper 1939
 Goldstein Derbyshire Davis
 Maurice Mendel was Goldstein’s Ph. D. student
 Teri James Bellis was Mendel’s Masters Thesis student (she later went to get a Ph. D. under Laura Wilber at Northwestern)
 Herbert Gould was Derbyshire’s Ph. D. student and Samuel Atcherson was Gould’s Ph. D. student Mendel served on Atcherson’s Dissertation committee, and Bellis was Atcherson’s first boss!
 Goldstein Derbyshire Mendel Gould Atcherson YOU? 11") Hallowell Davis (& Pauline Davis) Goldstein Derbyshire Mendel Gould Atcherson YOU? 11
Hallowell Davis (& Pauline Davis) Goldstein Derbyshire Mendel Gould Atcherson YOU? 11
 Acknowledgments • Colleagues – Nannette Nicholson, Ph. D. , Clifford Franklin, Ph. D. , Naveen Nagaraj, Ph. D. , Patti Martin, Ph. D. , John L. Dornhoffer, M. D. • Sarah E. Warren, Au. D. , Ph. D. (Class of 2014; 2017) • Ahmad Alanazi, Au. D. , Ph. D. – Ph. D. (Class of 2017) • Raven E. Brasseux, Au. D. (Class of 2014) • Brittany Tuscany, Au. D. (Class of 2016) • Sommer Richesin, Au. D. (Class of 2016) • Lindsey Sloan (Class of 2018)
 Brief Review
 In Current Clinical Practice • Widespread – Click and Toneburst ABR • Not as Widespread – ECoch. G – ASSR – MLR – LLR – P 300
; JAAA") N = 212 Martin et al (1998); JAAA
N = 212 Martin et al (1998); JAAA
; AJA") N = 195 Emanuel et al (2011); AJA
N = 195 Emanuel et al (2011); AJA
 Basic Principles and Overview Picton, 1974 17
 Another Way to Visualize P 300 ECoch. G LLR ABR MLR CM SP AP I III V V Na Pa Nb Pb P 1 N 1 P 2 Clinical Electrophysiology N 2 P 300
 CERP MLR ABR ECoch. G With Permission from Herbert Jay Gould, Ph. D. (in Atcherson & Shoemaker, 2012)
 Auditory Brainstem Response and Updates
 – assessment of the neural integrity of the") ABR Review • Click ABR (Neurodiagnostic) – assessment of the neural integrity of the auditory nerve along with the brainstem structures • Threshold Estimation ABR – under good conditions, provides audiogram estimates using correction factors • Updates – Threshold difference – Bone-conduction ABR with softband vs. metal band – CE- and LS-Chirps
ABR Review • Click ABR (Neurodiagnostic) – assessment of the neural integrity of the auditory nerve along with the brainstem structures • Threshold Estimation ABR – under good conditions, provides audiogram estimates using correction factors • Updates – Threshold difference – Bone-conduction ABR with softband vs. metal band – CE- and LS-Chirps
 ABR Threshold Difference Screening Measure?
 – Behavioral Threshold") New Measure for Lesion Detection? • Bush, Jones and Shinn (2008) – Behavioral Threshold obtained with click ABR stimulus – Then compared to ABR threshold – Looked at difference of the two thresholds • Difference <30 d. B in normal • Difference >30 d. B in known lesion
New Measure for Lesion Detection? • Bush, Jones and Shinn (2008) – Behavioral Threshold obtained with click ABR stimulus – Then compared to ABR threshold – Looked at difference of the two thresholds • Difference <30 d. B in normal • Difference >30 d. B in known lesion
 Findings • They found that all 7 of their patients had differences greater than 30 d. B in their diseased ear and less than 30 d. B in their unaffected ear.
 Threshold Difference vs Traditional • Bush, Jones and Shinn’s new threshold difference maintained a sensitivity of 100% no matter the size of the lesion • Other traditional clinical ABR markers lose their sensitivity as lesion size decreases, especially below 1 cm • Problem – Detection – Size – Ease of removing
 Our Lingering Questions 1. What does this look like in normal? 2. What does this look like in patients with SNHL? 3. Can we replicate this in a clinical environment?
 -10. 0 250 Hz 500 Hz 1 k Hz 2") Audiogram Information Frequency (Hz) -10. 0 250 Hz 500 Hz 1 k Hz 2 k Hz 4 k Hz 8 k Hz -10. 0 2 k Hz 30. 0 Intensity (d. B HL) 20. 0 30. 0 1 k Hz 10. 0 20. 0 500 Hz 0. 0 10. 0 Intensity (d. B HL) 0. 0 250 Hz 40. 0 50. 0 60. 0 70. 0 80. 0 90. 0 100. 0 110. 0 Normal Hearing (n=10) SNHL (n=3) 4 k Hz 8 k Hz
Audiogram Information Frequency (Hz) -10. 0 250 Hz 500 Hz 1 k Hz 2 k Hz 4 k Hz 8 k Hz -10. 0 2 k Hz 30. 0 Intensity (d. B HL) 20. 0 30. 0 1 k Hz 10. 0 20. 0 500 Hz 0. 0 10. 0 Intensity (d. B HL) 0. 0 250 Hz 40. 0 50. 0 60. 0 70. 0 80. 0 90. 0 100. 0 110. 0 Normal Hearing (n=10) SNHL (n=3) 4 k Hz 8 k Hz
 25 20 20 15 15") Results Behavioral vs. ABR (Right Ear - Normal Listeners) 25 20 20 15 15 15 10 Decibels 10 5 20 5 5 10 10 5 5 15 10 10 5 5 5 0 0 -5 -10 15 -5 1 2 3 4 5 BEH R 6 ABR R 7 8 9 10
Results Behavioral vs. ABR (Right Ear - Normal Listeners) 25 20 20 15 15 15 10 Decibels 10 5 20 5 5 10 10 5 5 15 10 10 5 5 5 0 0 -5 -10 15 -5 1 2 3 4 5 BEH R 6 ABR R 7 8 9 10
 25 20 20 15 15") Results Behavioral vs. ABR (Left Ear - Normal Listeners) 25 20 20 15 15 10 Decibels 10 20 15 15 10 10 5 5 0 20 0 0 10 5 5 0 -5 -10 1 2 3 4 5 BEH L 6 ABR L 7 8 9 10
Results Behavioral vs. ABR (Left Ear - Normal Listeners) 25 20 20 15 15 10 Decibels 10 20 15 15 10 10 5 5 0 20 0 0 10 5 5 0 -5 -10 1 2 3 4 5 BEH L 6 ABR L 7 8 9 10
 DIFF R DIFF L 30 Threshold Difference (d. B)") Results Difference Measure (Normal Listeners) DIFF R DIFF L 30 Threshold Difference (d. B) 25 20 15 15 15 10 10 10 5 5 5 10 10 5 5 0 1 2 3 4 5 6 Participants 7 8 9 10
Results Difference Measure (Normal Listeners) DIFF R DIFF L 30 Threshold Difference (d. B) 25 20 15 15 15 10 10 10 5 5 5 10 10 5 5 0 1 2 3 4 5 6 Participants 7 8 9 10
 BEH R 60 50 45 40") Results Behavioral vs. ABR (Right Ear - SNHL) BEH R 60 50 45 40 Decibels 40 40 35 30 30 30 20 10 0 1 2 Participants 3 ABR R
Results Behavioral vs. ABR (Right Ear - SNHL) BEH R 60 50 45 40 Decibels 40 40 35 30 30 30 20 10 0 1 2 Participants 3 ABR R
 BEH L 60 50 Decibels 50") Results Behavioral vs. ABR (Left Ear - SNHL) BEH L 60 50 Decibels 50 40 40 40 35 30 20 10 0 1 2 Participants 3 ABR L
Results Behavioral vs. ABR (Left Ear - SNHL) BEH L 60 50 Decibels 50 40 40 40 35 30 20 10 0 1 2 Participants 3 ABR L
 DIFF R Threshold Difference (d. B) 30 25 20 15") Results Difference Measure (SNHL) DIFF R Threshold Difference (d. B) 30 25 20 15 10 10 5 5 0 1 2 Participants 3 DIFF L
Results Difference Measure (SNHL) DIFF R Threshold Difference (d. B) 30 25 20 15 10 10 5 5 0 1 2 Participants 3 DIFF L
 Can We Use a Softband Instead of a Metal Band for Bone. Conduction ABR?
 – Determined pure tone bone conduction (BC)") Background • Toll, Emanuel and Letowski (2011) – Determined pure tone bone conduction (BC) thresholds for 40 participants • P-3333 headband • Soft-band at 5. 4 N, 4. 4 N, 3. 4 N, 2. 4 N • Comfort ratings on a 5 point Likert scale – Results • Mean BC thresholds were within ± 2 d. B across all conditions • Participants experienced significantly greater discomfort with the P-3333 headband when compared to the soft-band • Mean static force of the P-3333 varied considerably and was higher than the calibration standard of 5. 4 N • Concluded that this suggest future revisions should address the use of a soft-band a static force of less than 5. 4 N
Background • Toll, Emanuel and Letowski (2011) – Determined pure tone bone conduction (BC) thresholds for 40 participants • P-3333 headband • Soft-band at 5. 4 N, 4. 4 N, 3. 4 N, 2. 4 N • Comfort ratings on a 5 point Likert scale – Results • Mean BC thresholds were within ± 2 d. B across all conditions • Participants experienced significantly greater discomfort with the P-3333 headband when compared to the soft-band • Mean static force of the P-3333 varied considerably and was higher than the calibration standard of 5. 4 N • Concluded that this suggest future revisions should address the use of a soft-band a static force of less than 5. 4 N
 Methods IRB approval was granted through UALR ABR Wave V latency and amplitude were measured for six conditions Metal headband 30 d. B Metal headband 50 d. B 5. 4 N soft-band 30 d. B 5. 4 N soft-band 50 d. B 2. 4 N soft-band 30 d. B 2. 4 N soft-band 50 d. B
 Methods • Subjective comfort was measured on a 5 -point Likert scale from very comfortable (1) to very uncomfortable (5) – Metal headband – 5. 4 N soft-band – 2. 4 N soft-band • Participants – 10 otologically normal individuals – 22 -43 years of age (Mean=28. 4, SD=6. 7) – Normal otoscopic and audiometric test results
 Methods • Instrumentation – Bio-logic Navigator Pro – B-71 bone oscillator – Radioear P-3333 headband – Huggie Aids adjustable, leather soft-band – Metal push/pull force gauge
 Methods • Procedures – One-channel electrode montage – Bone oscillator was placed behind the right ear on the mastoid bone – ABR recordings were obtained first for the metal headband at 50 d. B and 30 d. B then the soft-band at 5. 4 N and 2. 4 N Active Right Left ))) Reference Ground
 Methods • Procedures – Measuring force of the soft-band mimicked the method used by Toll, Emanuel and Letowski (2011) • Fishing line attached to outside of the soft-band • Soft-band was placed around the subject’s head with the bone oscillator in the same place as the metal headband • A small, thin, metal washer attached to two fishing weights was placed in between the bone oscillator and the mastoid • Looped the fishing line around the hook of the push/pull force gauge • When the washer and weights fell, that was the measured force • 5. 4 N=~550 g ± 50 g, 2. 4 N = ~244 g ± 50 g – Participants were asked to rate their level of comfort after each headband type
 Wave V Latency Metal 30 d. B Mean= 8. 325, SD=0.") Results Latency (milliseconds) Wave V Latency Metal 30 d. B Mean= 8. 325, SD=0. 42 10 Mean=7. 495, SD=0. 41 9 5. 4 N SB 30 d. B Mean=8. 288, SD=0. 42 5. 4 N SB 50 d. B Latency (ms) Metal 50 d. B 8 30 d. B 50 d. B 7 Mean=7. 383, SD=0. 50 2. 4 N SB 30 d. B Mean=7. 945, SD=0. 48 6 Metal HB 5. 4 N SB Headband Type 2. 4 N SB 2. 4 N SB 50 d. B Mean=7. 157, SD=0. 46 No significant difference between headband type No interaction effect Significant difference between intensity [F(1, 9)=4. 9907, p=. 052355] Expected result Wave V latency decreases with increased intensity
Results Latency (milliseconds) Wave V Latency Metal 30 d. B Mean= 8. 325, SD=0. 42 10 Mean=7. 495, SD=0. 41 9 5. 4 N SB 30 d. B Mean=8. 288, SD=0. 42 5. 4 N SB 50 d. B Latency (ms) Metal 50 d. B 8 30 d. B 50 d. B 7 Mean=7. 383, SD=0. 50 2. 4 N SB 30 d. B Mean=7. 945, SD=0. 48 6 Metal HB 5. 4 N SB Headband Type 2. 4 N SB 2. 4 N SB 50 d. B Mean=7. 157, SD=0. 46 No significant difference between headband type No interaction effect Significant difference between intensity [F(1, 9)=4. 9907, p=. 052355] Expected result Wave V latency decreases with increased intensity
 Wave V Amplitude Metal 30 d. B Mean=0. 128, SD=0. 09") Results Amplitude (microvolts) Wave V Amplitude Metal 30 d. B Mean=0. 128, SD=0. 09 Mean=0. 179, SD=0. 13 5. 4 N SB 30 d. B Mean=0. 111, SD=0. 06 5. 4 N SB 50 d. B Mean=0. 193, SD=0. 10 2. 4 N SB 30 d. B Mean=0. 126, SD=0. 04 0. 3 Amplitude (µV) Metal 50 d. B 0. 35 0. 2 0. 15 30 d. B 0. 1 50 d. B 0. 05 0 Metal HB 2. 4 N SB 50 d. B Mean=0. 172, SD=0. 09 5. 4 N SB Headband Type 2. 4 N SB No significant difference between headband type No interaction effect Significant difference between intensity [F(1, 9)=4. 9907, p=. 052355] Expected result Wave V amplitude increases with increased intensity
Results Amplitude (microvolts) Wave V Amplitude Metal 30 d. B Mean=0. 128, SD=0. 09 Mean=0. 179, SD=0. 13 5. 4 N SB 30 d. B Mean=0. 111, SD=0. 06 5. 4 N SB 50 d. B Mean=0. 193, SD=0. 10 2. 4 N SB 30 d. B Mean=0. 126, SD=0. 04 0. 3 Amplitude (µV) Metal 50 d. B 0. 35 0. 2 0. 15 30 d. B 0. 1 50 d. B 0. 05 0 Metal HB 2. 4 N SB 50 d. B Mean=0. 172, SD=0. 09 5. 4 N SB Headband Type 2. 4 N SB No significant difference between headband type No interaction effect Significant difference between intensity [F(1, 9)=4. 9907, p=. 052355] Expected result Wave V amplitude increases with increased intensity
 Results Comfort • Mean= 4, SD= 0. 82 • 5. 4 N Soft-band • Mean= 1. 6, SD= 0. 70 • Subjective Comfort Metal headband 2. 4 N Soft-band • Mean= 1. 2, SD= 0. 42 5 Comfort Level • 4 3 2 1 Metal HB 5. 4 N SB Headband Type 2. 4 N SB One-way ANOVA revealed statistically significant difference in comfort ratings, [F(2)=51. 6, p<. 0001] Post-hoc Tukey HSD (Honest Significant Difference) test revealed the metal headband was rated significantly more uncomfortable than both soft-band conditions (p<. 01) However, no significant difference found between the 5. 4 N and 2. 4 N softbands
 What’s the Big Deal About Chirps with the ABR?
:") Some Background First • Stacked Derived-Band Auditory Brainstem Response Amplitude (Don et al, 1997): – Attempts to record the sum of the neural activity across the entire cochlea (output compensation) – To do this, 5 ABRs are obtained: • High-intensity click is presented first and ABR waveform is obtained • High-intensity click is presented simultaneously with highpass masking noise and then subtracted from the previous ABR • ABRs are then aligned by wave V and then summed together • Larger wave V is considered ‘normal’ • Problem? Time consuming! Post-auricular muscle artifact!
Some Background First • Stacked Derived-Band Auditory Brainstem Response Amplitude (Don et al, 1997): – Attempts to record the sum of the neural activity across the entire cochlea (output compensation) – To do this, 5 ABRs are obtained: • High-intensity click is presented first and ABR waveform is obtained • High-intensity click is presented simultaneously with highpass masking noise and then subtracted from the previous ABR • ABRs are then aligned by wave V and then summed together • Larger wave V is considered ‘normal’ • Problem? Time consuming! Post-auricular muscle artifact!
 The Stacking Method Sum of Shifted Waveforms Shifted to 5. 7 k. Hz Wave V latency Derived-band ABR Summary Ø Ø Neural contributions from different frequency regions of the cochlea can be obtained using the derived-band ABR method. Derived-band ABRs represent activity from more specific frequency regions than moderate-to-high level toneburst-evoked ABRs. House Ear SABR Summary Ø The Stacked ABR is formed by temporally aligning wave V of the derived-band ABRs and then summing the responses. Ø Aligning the derived-band ABRs eliminates phase cancellation of lower frequency activity. Thus, the Stacked ABR amplitude reflects activity from all frequency regions of the cochlea, not just the high frequencies. Ø Reduction of any neural activity due to a tumor, even a small tumor, will result in a reduction of the Stacked ABR amplitude. 46
 Chirp Background • Chirp ABR – Gradually changing, short-duration stimulus, from a low frequency to high frequency – Takes into account the cochlear traveling wave, tonotopic organization of the cochlea, and different synchronization patterns of the auditory nerve fibers – Modeled after Stacked ABR to produce one or more stimuli (input compensation) • CE-Chirp (Elberling & Don, 2008): – ABR saturates in amplitude around 50 -60 d. B • LS-Chirp (Kristensen & Elberling, 2012): – Level-specific stimuli in 5 d. B steps – Permits stimulation up to 80 d. B without amplitude saturation
") From Elberling et al. (2008)
From Elberling et al. (2008)
 Created using: http: //www. phon. ucl. ac. uk/resource/cochsim/
") From Elberling et al. (2008)
From Elberling et al. (2008)
 Click
Click
: – 4 presentation") • CE-Chirp vs. LS-Chirp vs. Click (Kristensen & Elberling, 2012): – 4 presentation levels: 20, 40, 60 & 80 d. B n. HL – Results: • LS-Chirp produced robust ABR waveforms up to the highest presentation level without saturation • CE-Chirp ABR waveforms saturated at levels greater than 60 d. B n. HL • LS-Chirp ABR waveforms were larger in amplitude than for ABR waveforms produced by the click
• CE-Chirp vs. LS-Chirp vs. Click (Kristensen & Elberling, 2012): – 4 presentation levels: 20, 40, 60 & 80 d. B n. HL – Results: • LS-Chirp produced robust ABR waveforms up to the highest presentation level without saturation • CE-Chirp ABR waveforms saturated at levels greater than 60 d. B n. HL • LS-Chirp ABR waveforms were larger in amplitude than for ABR waveforms produced by the click
 Basis for LS-Chirps Best for 20 d. Bn. HL CE-Chirp Best for 60 d. Bn. HL
 Middle Latency Response and Updates
 MLR Review • MLR used primarily for neurodiagnostics – Found especially useful in studies of auditory processing deficits, neurologic insults, and head trauma using hemispheric montage – Not new, but severely underutilized even though a conventional 2 -channel evoked potential system is capable • Most robust and useful waves – Na – approximately 18 ms (2 nd most robust wave) – Pa – approximately 30 ms (most robust wave)
 RETICULAR FORMATION Pa With Permission from Herbert Jay Gould, Ph. D. (in Atcherson & Shoemaker, 2012) Na
 Sonomotor Responses • Acoustic stimuli can activate muscles • Examples Encountered in Audiology – Stapedius M. – Sternocleidomastoid M. – Inferior Oblique M. – Post-Auricular M.
 MLR and PAM artifact share same time domain: MLR PAM Na ~ 18 - 20 msec Pa ~ 25 - 30 msec PAM = triphasic response ~ 15 -30 msec
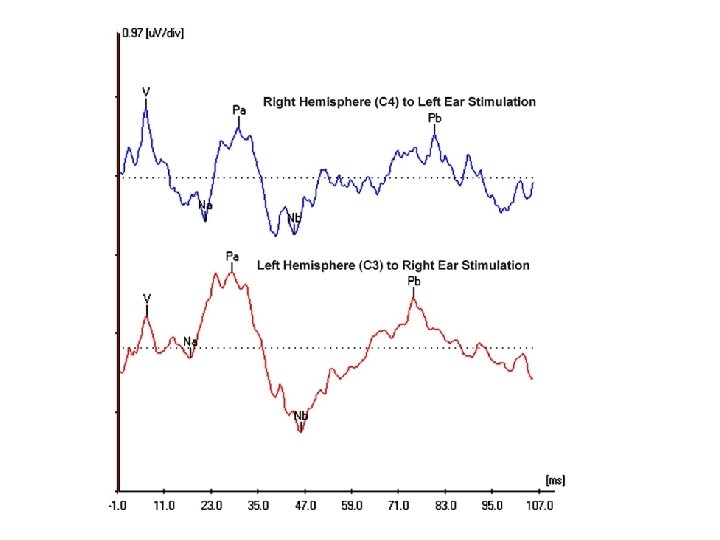
 Non-inverting (active) at Cz plus C 5/C 6") Electrode Montage • Montage: – (+) Non-inverting (active) at Cz plus C 5/C 6 or C 4/C 3 – (-) Inverting (reference) on earlobe/mastoid (e. g. , A 1 and A 2) – Ground (depends on the montage, if single channel – earlobe, if multi-channel - Fpz) • Placement of reference electrode important due to muscle artifact issue • Selection of reference site will influence results – Non cephalic site? – Linked earlobes?
Electrode Montage • Montage: – (+) Non-inverting (active) at Cz plus C 5/C 6 or C 4/C 3 – (-) Inverting (reference) on earlobe/mastoid (e. g. , A 1 and A 2) – Ground (depends on the montage, if single channel – earlobe, if multi-channel - Fpz) • Placement of reference electrode important due to muscle artifact issue • Selection of reference site will influence results – Non cephalic site? – Linked earlobes?
 Active Electrode Sites • Placement of electrodes aids in site of lesion testing • Symmetric bilateral representation – Used for neurodiagnosis in locating hemispheric differences – Use multiple electrode sites to look for electrode/ear effects • e. g. , C 4 -A 1, C 3 -A 1, C 4 -A 2, C 3 -A 2, … C 4 -A 1, C 3 -A 2
. JAAA, 10(3), 124 -132 • Response") • Based on Musiek et al. (1999). JAAA, 10(3), 124 -132 • Response of Interest: Na-Pa peak-to-peak amplitude • ((Larger Response – Smaller Response) / Smaller Response) * 100 – Compare Right Ear (A 2) and Left Hemisphere (C 3) with Left Ear (A 1) and Right Hemisphere (C 4)
• Based on Musiek et al. (1999). JAAA, 10(3), 124 -132 • Response of Interest: Na-Pa peak-to-peak amplitude • ((Larger Response – Smaller Response) / Smaller Response) * 100 – Compare Right Ear (A 2) and Left Hemisphere (C 3) with Left Ear (A 1) and Right Hemisphere (C 4)
 (C 4) Active (C 3) Active (Fpz) Ground (A") MLR Montage Setup (Unlinked References) (C 4) Active (C 3) Active (Fpz) Ground (A 1) Reference UNPLUGGED Right Left
MLR Montage Setup (Unlinked References) (C 4) Active (C 3) Active (Fpz) Ground (A 1) Reference UNPLUGGED Right Left
 (C 4) Active (C 3) Active (Fpz) Ground UNPLUGGED") MLR Montage Setup (Unlinked References) (C 4) Active (C 3) Active (Fpz) Ground UNPLUGGED (A 2) Reference Right Left
MLR Montage Setup (Unlinked References) (C 4) Active (C 3) Active (Fpz) Ground UNPLUGGED (A 2) Reference Right Left
 2. 96 296%
 • Electrode effect: responses reduced/absent at given electrode site regardless of ear stimulated – Tends to be observed with cortical lesions (e. g. , Kraus et al. , 1982; Kileny et al, 1987; Shehata. Dieler et al, 1991) • Ear effect: responses reduced/absent at all electrode sites for a given stimulus ear, but not for other ear – Tends to be observed with subcortical lesions, but not well delineated (e. g. , Kaseda et al, 1991; Fischer et al, 1994)
 Hemispheric Asymmetry • When the amplitude of MLR is 50% or more on one hemisphere to contralateral stimulation compared to the other hemisphere with contralateral stimulation, this is construed as a positive finding. Lesion? Possibly… (after Musiek et al. , 1999) • An ear effect may be more likely than electrode effect in APD (Schochat et al. , 2004)
 1. C 6 C 5 Right Ear Stimulation Cz C 6 C 5 Left Ear Stimulation
 Is there any benefit of using a chirp for MLR? In other words, does MLR benefit from increased neural synchrony?
") Atcherson & Moore (2014)
Atcherson & Moore (2014)
 Can You Give Me a Case Example of MLR?
 I’m already in College, but: - I feel like I’m having trouble hearing - I have a hard time following group conversations - I often miss important things in class - The professors seem to speak to fast and I can’t keep up - Too much extraneous noise in a classroom affects my ability to listen ASP 5063 (7333) - I have trouble understanding in background noise 72
 Case History – Brief Background • 19 -year old male • Mother called concerned about son’s future academic success in college relative to hearing, auditory function, learning, and psychosocial issues – Felt need to meet with both mother and son – Son was very well-adjusted, and mother appeared to overadvocate (counseling of the mother) – Both validated the original concerns • Prior hearing evaluation revealed normal hearing sensitivity
 – APGAR") • Birth History includes: – Nuchal cord wrap (# times unknown) – APGAR score of 6 (some resuscitation required) • Medical History includes: – Multiple sets of PE tubes as a child, including a short stint wearing a personal amplification device – Surgical removal of abscess on the neck – Delayed speech and language (therapy) – Possible concussion (age 4 -5) due to head impact with windowsill – Recurrent headaches (self-attributed to vision)
• Birth History includes: – Nuchal cord wrap (# times unknown) – APGAR score of 6 (some resuscitation required) • Medical History includes: – Multiple sets of PE tubes as a child, including a short stint wearing a personal amplification device – Surgical removal of abscess on the neck – Delayed speech and language (therapy) – Possible concussion (age 4 -5) due to head impact with windowsill – Recurrent headaches (self-attributed to vision)
 of Nuchal Cord is around 20") Perinatal Anoxic Brain Injury? Factoid: Incidence (or risk) of Nuchal Cord is around 20 -25% Factoid: Being born with Nuchal Cord is not an automatic risk factor for developmental problems Miser (1992), Journal of Family Practice
Perinatal Anoxic Brain Injury? Factoid: Incidence (or risk) of Nuchal Cord is around 20 -25% Factoid: Being born with Nuchal Cord is not an automatic risk factor for developmental problems Miser (1992), Journal of Family Practice
 • Social/ Educational History includes: – Public school education – IQ of 124 to 135 – History of auditory memory problems – Some difficulty following television dialogue – Forgetfulness – Not following precise instructions or missing steps – Some distractibility – Some impulsivity – Some “mishearing”
AP Evaluation • Behavioral Tests: – Dichotic Digits – Competing Sentences – Low Pass") (C)AP Evaluation • Behavioral Tests: – Dichotic Digits – Competing Sentences – Low Pass Filtered Speech (1 k. Hz cutoff) – Pitch Pattern Test – Quick. SIN (monaural) • Electrophysiologic Test: – Simultaneous ABR/MLR recordings (C 3 and C 4)
(C)AP Evaluation • Behavioral Tests: – Dichotic Digits – Competing Sentences – Low Pass Filtered Speech (1 k. Hz cutoff) – Pitch Pattern Test – Quick. SIN (monaural) • Electrophysiologic Test: – Simultaneous ABR/MLR recordings (C 3 and C 4)
 Results 100 - DD LE RE - X - Cmp Snt LE RE O FP Lbl X X LPFS Hum LE RE O X DAT Quick. SIN Total -30 O - O X - O 50 %- -15 - 0 - O Shaded Area = Normal Range X -0
 ABR/MLR Results
APD, however… – Right ear performance") Conclusions • No clear profile or deficit of (C)APD, however… – Right ear performance is worse on right than left for dichotic digits • more common to see left ear weakness – Humming pitch patterns was easier than labeling • More reversals with labeling – Quick. SIN showed a left ear SNR loss, but not right – ABR/MLR waveforms showed some marked asymmetry • Ear effect present with C 4 A 1 smaller than C 3 A 2 • General morphology different between ears • No clear lesion either: – Corpus callosum? – Auditory cortex (left, right, or both)?
Conclusions • No clear profile or deficit of (C)APD, however… – Right ear performance is worse on right than left for dichotic digits • more common to see left ear weakness – Humming pitch patterns was easier than labeling • More reversals with labeling – Quick. SIN showed a left ear SNR loss, but not right – ABR/MLR waveforms showed some marked asymmetry • Ear effect present with C 4 A 1 smaller than C 3 A 2 • General morphology different between ears • No clear lesion either: – Corpus callosum? – Auditory cortex (left, right, or both)?
 • Dichotic Auditory Training (DAT) • Pre- and Post-DAT testing •") Recommendation (Not exhaustive) • Dichotic Auditory Training (DAT) • Pre- and Post-DAT testing • Post-Training Retest for: – Dichotic Digits – Pitch Patterns – Quick. SIN – ABR/MLR
Recommendation (Not exhaustive) • Dichotic Auditory Training (DAT) • Pre- and Post-DAT testing • Post-Training Retest for: – Dichotic Digits – Pitch Patterns – Quick. SIN – ABR/MLR
 Pre-DAT Test Result 100 - DD LE RE - X 50 %- Cmp Snt LE RE O FP Lbl X X LPFS Hum LE RE O X DAT Quick. SIN Total -30 O - O X - O -15 PRE - 0 - O Shaded Area = Normal Range X -0
* • Basic Set Up (NU-6 words) – Pre-DAT") Recommendation • Dichotic Auditory Training (DAT)* • Basic Set Up (NU-6 words) – Pre-DAT test – Four weeks of training, 2 -days a week (45 -mins) • • Week 1 – 300 ms interaural time delays Week 2 – 300 ms and 150 ms interaural time delays Week 3 – 150 ms and 0 ms interaural time delays Week 4 – 0 ms interaural time delays – Post-DAT test * Developed by Sheryl S. Shoemaker, Au. D. , Ph. D. (2010, unpublished dissertation)
Recommendation • Dichotic Auditory Training (DAT)* • Basic Set Up (NU-6 words) – Pre-DAT test – Four weeks of training, 2 -days a week (45 -mins) • • Week 1 – 300 ms interaural time delays Week 2 – 300 ms and 150 ms interaural time delays Week 3 – 150 ms and 0 ms interaural time delays Week 4 – 0 ms interaural time delays – Post-DAT test * Developed by Sheryl S. Shoemaker, Au. D. , Ph. D. (2010, unpublished dissertation)
 Visual Example of the DAT DOG CAT 300 ms DOG CAT 150 ms DOG CAT 0 ms (dichotic)
 Post-Training Behavioral Testing 100 - DD LE RE - X 50 %- Cmp Snt FP LPFS DAT Quick. SIN LE RE Lbl Hum LE RE Total -30 O X POST O X - O -15 PRE - 0 - O Shaded Area = Normal Range X -0
 Post-Training ABR/MLR Results
 Pre- and Post-Training ABR/MLRs PRE POST
 Final Conclusions • DAT appeared to encourage/train patient to: – – Keep auditory channels separate Attend to one ear at a time Keep word items in memory and repeat in specific order Work under temporal constraints • Too soon to tell if DAT is appropriate for all cases of (C)APD, but promising • Will the changes observed be lasting? • If needed, will likely need to rely on compensatory strategies and classroom/learning skills
") Cortical Event-Related Potentials (CERP)
Cortical Event-Related Potentials (CERP)
, late auditory") First Things First on CERPs • Names: cortical auditory evoked potentials (CAEP), late auditory evoked potentials (LAEP), late auditory response (LAR), late-latency response (LLR); cortical event-related potential (CERP) • Both exogenous and endogenous components (some more than others) • Patient state needs to be awake and alert
First Things First on CERPs • Names: cortical auditory evoked potentials (CAEP), late auditory evoked potentials (LAEP), late auditory response (LAR), late-latency response (LLR); cortical event-related potential (CERP) • Both exogenous and endogenous components (some more than others) • Patient state needs to be awake and alert
 Family of CERPs
 CAEP Review • Occur between 50 and 250 ms (generally cannot see MLR and earlier waves) • All “classic” components are obligatory – P 1 (aka Pb or P 50) – N 1 (approximately 100 ms) – P 2 (approximately ~180 ms, seen as early as 150 ms) • Update – Possible use with ANSD – Tool for auditory maturation – Lately has re-emerged as possible threshold estimation tool and audibility tool
 Can the CAEP be Used with ANSD?
 The better the speech") ANSD Examples in Absence of ABR Narne & Vanaja (2008) The better the speech perception, the better the morphology of cortical response AN = auditory neuropathy
ANSD Examples in Absence of ABR Narne & Vanaja (2008) The better the speech perception, the better the morphology of cortical response AN = auditory neuropathy
 Can the CAEP to Assess Auditory Maturation?
. Ann Otol Rhinol Laryngol, 111, 7. 96") Moore (2002). Ann Otol Rhinol Laryngol, 111, 7. 96
Moore (2002). Ann Otol Rhinol Laryngol, 111, 7. 96
") Ponton et al. (2002)
Ponton et al. (2002)
") P 1 Biomarker of Auditory Development Hearing Aid Cochlear Implant Sharma et al. (2005)
P 1 Biomarker of Auditory Development Hearing Aid Cochlear Implant Sharma et al. (2005)
") Sharma et al. (2005)
Sharma et al. (2005)
 Can CAEP Be Used to Estimate Audiogram Threshold?
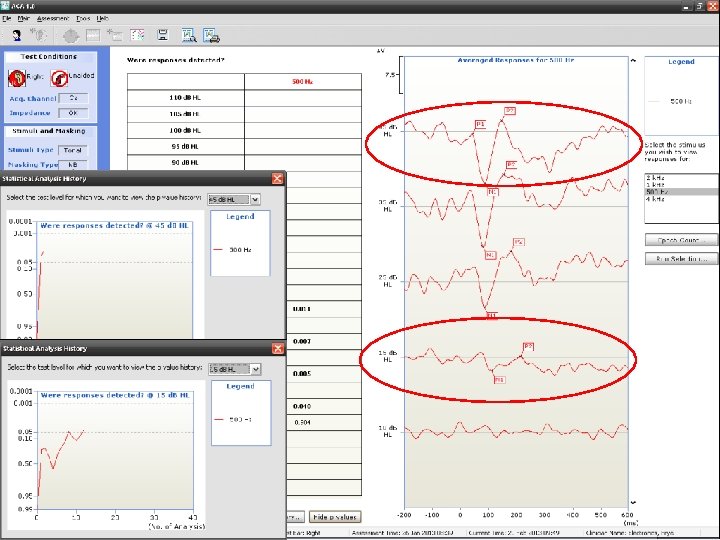
 HEARLab • • Developed by National Acoustics Laboratory Manufactured by Frye Electronics, Inc. FDA approved since April 2013 Cortical potential testing (P 1/N 1/P 2) – ACA = aided cortical assessment (main feature) – CTE = cortical threshold estimation • Uses statistical procedure (Hotelling’s T 2) and p-value to objectively determine if response is present
") http: //hearlab. nal. gov. au (Developers of the HEARLab)
http: //hearlab. nal. gov. au (Developers of the HEARLab)
 EXAMPLE AT 0. 5 AND 1 KHZ WITH PROFOUND HEARING LOSS Raven E. Brasseux, Audiology Capstone Project (2013) Research Advisor: Samuel R. Atcherson, Ph. D. 103
 104
104
 CTE Example
 EXAMPLE AT 0. 5 AND 4 KHZ WITH MODERATE HEARING LOSS Raven E. Brasseux, Audiology Capstone Project (2013) Research Advisor: Samuel R. Atcherson, Ph. D. 106
 108
108
 Hearing Level (d. B HL) . 125. 25 0") Worst Match Frequency (k. Hz) Hearing Level (d. B HL) . 125. 25 0 10 20 30 40 50 60 70 80 90 100 110 Raven E. Brasseux, Audiology Capstone Project (2013) Research Advisor: Samuel R. Atcherson, Ph. D. . 5 1 2 4 H 8
Worst Match Frequency (k. Hz) Hearing Level (d. B HL) . 125. 25 0 10 20 30 40 50 60 70 80 90 100 110 Raven E. Brasseux, Audiology Capstone Project (2013) Research Advisor: Samuel R. Atcherson, Ph. D. . 5 1 2 4 H 8
 Research Advisor: Samuel R. Atcherson,") Best Match Raven E. Brasseux, Audiology Capstone Project (2013) Research Advisor: Samuel R. Atcherson, Ph. D. 110
Best Match Raven E. Brasseux, Audiology Capstone Project (2013) Research Advisor: Samuel R. Atcherson, Ph. D. 110
 HEARLab to Behavioral Threshold Difference 50 X = -2. 5 X = -4. 2 X = -7. 5 40 30 Audiometry Threshold Better Than HEARLab 20 Subject 1 10 Subject 2 0 Subject 3 -10 Subject 4 -20 Subject 5** Subject 6 -30 -40 -50 0. 5 1 2 Frequency (Hz) Raven E. Brasseux, Audiology Capstone Project (2013) Research Advisor: Samuel R. Atcherson, Ph. D. 4 HEARLab Threshold Better Than Audiometry
") Alanazi et al (2017)
Alanazi et al (2017)
") Alanazi et al (2017)
Alanazi et al (2017)
 Can CAEP Be Used to Examine Audibility?
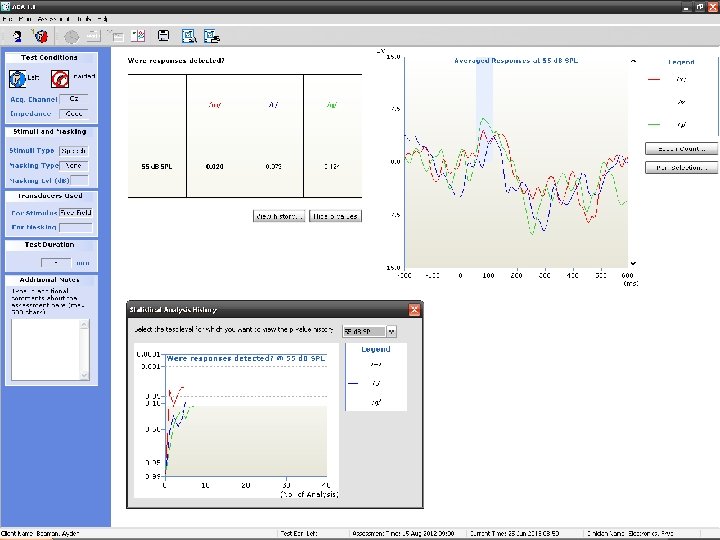


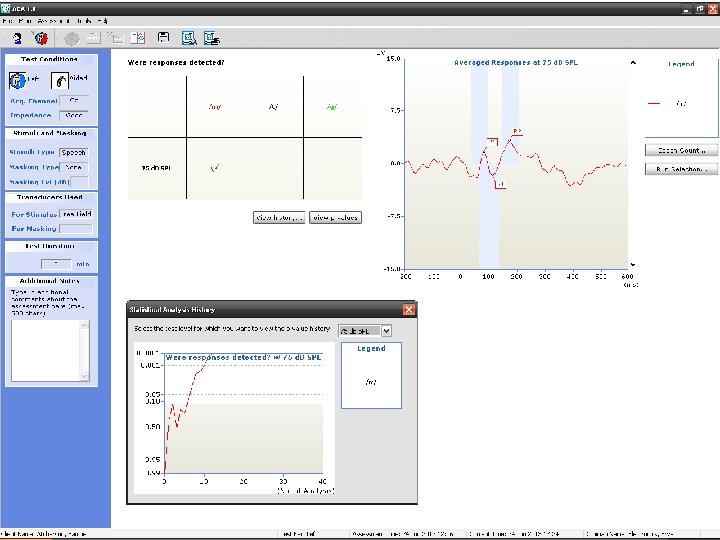
 Ear Plugs In (Simulated CHL) Atcherson, Nicholson, Franklin, & Smith-Olinde (unpublished") ACA Example (Audibility) Ear Plugs In (Simulated CHL) Atcherson, Nicholson, Franklin, & Smith-Olinde (unpublished data) Ear Plugs In + Softband BAHA
ACA Example (Audibility) Ear Plugs In (Simulated CHL) Atcherson, Nicholson, Franklin, & Smith-Olinde (unpublished data) Ear Plugs In + Softband BAHA


") Atcherson, Damji, & Upson (2011)
Atcherson, Damji, & Upson (2011)
 Q&A
Q&A
 Questions? sratcherson@ualr. edu