f998542110f790ea8e1879215aef5fb1.ppt
- Количество слайдов: 132

Unusual Map Projections Waldo Tobler Professor Emeritus Geography department University of California Santa Barbara, CA 93106 -4060 http: //www. geog. ucsb. edu/~tobler 1

Based on an invited presentation at the 1999 meeting of the Association of American Geographers in Hawaii. Copyright Waldo Tobler 2000 2

Subjects To Be Covered Partial List The earth’s surface Area cartograms Mercator’s projection Combined projections The earth on a globe Azimuthal enlargements Satellite tracking Special projections Mapping distances And some new ones 3

The Mapping Process Common Surfaces Used in cartography 4

The surface of the earth is two dimensional, which is why only (but also both) latitude and longitude are needed to pin down a location. Many authors refer to it as three dimensional. This is incorrect. All map projections preserve the two dimensionality of the surface. The Byte magazine cover from May 1979 shows how the graticule rides up and down over hill and dale. Yes, it is embedded in three dimensions, but the surface is a curved, closed, and bumpy, two dimensional surface. Map projections convert this to a flat two dimensional surface. 5

The Surface of the Earth Is Two-Dimensional 6

The easy way to demonstrate that Mercator’s projection cannot be obtained as a perspective transformation is to draw lines from the latitudes on the projection to their occurrence on a sphere, here represented by an adjoining circle. The rays will not intersect in a point. 7

Mercator’s Projection Is Not Perspective 8

It is sometimes asserted that one disadvantage of a globe is that one cannot see all of the entire earth at one time. But you can if you use the transformation ’ = , and ’ = /2. This maps the entire earth onto one hemisphere, as shown in the orthographic view that follows. Repeat this for the backside of the globe and hardly anybody will notice that everything appears twice. East-West distances are of course foreshortened. There are other ways to do this. is latitude, is longitude 9

The Entire Earth On Half A Globe 10

One way to use map projections It is useful to think of a map projection like you are used to thinking of graph paper. Semi logarithmic, probability plots, and so on, are employed to bring out different aspects of data being analyzed. Map projections may be used in the same way. This is not a common use in Geographic Information Systems. 11

Mercator’s projection is not the only one that can render loxodromes (rhumb lines) as straight lines and correct directions. But it is the only one that does it for all loxodromes. The projection shown here has all loxodromes from one location as straight lines, going in their correct direction and with correct length. This can be considered a loxodromic-azimuthal projection. The present map is focused on 45 degrees north latitude and the Greenwich meridian, near Le Havre. When centered on the equator the north and south hemispheres are symmetrical. When centered at the pole this becomes the azimuthal equidistant projection. W. Tobler, 1966, “Notes on Two Projections: Loximuthal and Two Point Equidistant”, The Cartographic Journal, (Dec): 87 -89. 12

The Loximuthal Projection Centered at 45 o N & 0 o E 13

It is possible to draw a map of the world on a Moebius strip. The map must be drawn on both sides of the paper, inverting the image on one side. The resulting map, when one uses the Lambert cylindrical projection, with the poles at the edges of the strip, has the curious property that a pin pushed through the map exits at the antipodal point. W. Tobler, & Kumler, M. , 1986, “Three World Maps on a Moebius Strip”, Cartography and Geographic Information Systems, 18(4): 275 -276. 14

The World On A Moebius Strip Print upside down on back and give it a twist then glue the ends together 15

Conventional Way of Tracking Satellites 16

Instead of straight meridians and parallels with curved satellite tracks, as on the previous map, let us bend the meridians so that the satellite track becomes a straight line. This is convenient for automatic plotting of the satellite tracks. The range rings are circles on the earth. 17

What this looks like can be seen on the map designed for a satellite heading southeast from Cape Canaveral. Observe that the satellite does not cross over Antarctica which is therefore not on the map. The track is a “sawtooth” line, first South, then North, then South again. 18

Bend The Meridians Instead 19

This Map Shows Magnetic ‘Parallels’ And ‘Meridians’ 20

On the next map we straighten the magnetic coordinates in order to simplify the solution of problems involving terrestrial magnetism. This warps the normal geographic coordinates, but so what? It is not difficult to produce such maps graphically. It can also be done analytically. Choosing the correct coordinate system is often used to simplify a problem. 21

Map Which Straightens The Magnetic Coordinates Student Drawing 22

As you know, the even numbered highways of the US interstate system run East-West and the odd numbered ones run North. South. Therefore the interstate highway system can be drawn as orthogonal equidistant lines on a map and the meridians and parallels bent to fit this. Try it! The result will look like the next map. 23

US Highway Coordinates Student Drawing 24

The azimuthal equidistant projection has the property that all distances from the center are rendered correctly, to scale. It is also possible to do this from two points, yielding the so-called two-point equidistant projection. The world map is then contained within an ellipse, the eccentricity of which depends on how far apart the two points are. The points are at the foci of the ellipse. Can you see why it must be an ellipse? When the two points coincide the map is circular; when they are antipodal the map is a straight line. Azimuths are no longer correct, although there is also a map projection with directions correct from two points. 25 C. F. Close, 1934, “A Doubly Equidistant Projection of the Sphere”, Geogr. J. , 83(2): 144145.

Two Point Equidistant Map London to Wellington 26

For three points Wellman Chamberlin of the National Geographic Society invented the “trimetric” projection. His diagram is pretty self explanatory. The arcs of distance from the three points chosen to bound the area do not meet exactly, but rather form a small curvilinear triangle. The centroid of this triangle is used as the position of the graticule intersection. This would appear to be a least squares solution, but is not so described in the literature. W. Chamberlin, 1947, The Round Earth on Flat Paper, Washington D. C. , Nat. Geogr. Soc. 27

Constructing A Trimetric Projection 28

In order to best preserve distances from more than three points one can use advanced techniques. The next map demonstrates this. The projection is produced by covering the United States with a lattice of latitude and longitude points, then computing the spherical distances between these points, and then computing plane coordinates for these points. The plane coordinates are computed to minimize, in the least squares sense, the difference between the plane distances and the spherical distances. The map outline information is then interpolated by cubic splining and drawn by computer using a 10, 000 coordinate digital file. W. Tobler, 1971, “Numerical Approaches to Map projections”, pp. 51 -66 of I. Kretschmer, Studies in Theoretical Cartography, Vienna, Deuticke 29

Optimal Distance Preserving Projection Of The United States 30

Instead of great circle distances one can construct a map to preserve, in the least squares sense, loxodromic (rhumb line) distances, an hypothesis being that Portolan charts made prior to 1500 AD might have used such distances in their construction. W. Tobler, 1971, op. cit. 31

Mediterranean Sea Preserving Loxodromic Distances 32

Peter Laskowski simultaneously minimizes distance, angular, and areal distortion to obtain his tri-optimal world projection as a pair of bivariate fifth degree algebraic polynomials. P. Laskowski, 1997, “The Distortion Spectrum”, Cartographica, 34(3). 33

Laskowski’s Tri-optimal Projection 34

Computing coordinates from distances is known in cartography as trilateration. If one takes road distances from a Rand Mc. Nally road atlas and uses these distances to compute the location of the places one can then interpolate the latitude/longitude graticule, and from this draw a map with state boundaries and coastlines. The resulting map projection illustrates the distortion introduced by the road system. Furthermore, Tissot’s indicatrix can be used to calculate the angular and areal distortion, as well as the distance distortion, in every direction, at each map location. 35

Road Distance Map Of The United States Student drawing 36

The next map is obtained by converting ocean shipping distances between world ports into coordinate locations. The coastlines are then interpolated. Observe that the poles go to the outside of the map since there is no shipping across these locations. Also the route from New York to Seattle passes very close to Panama, all three nearly lying on a straight line. 37

World Ocean Distances Map Based on Shipping Distances Between 42 Ports 38

The distinctive cordiform Stab-Werner projection is equal area and shows distances correctly, to scale, from the map center only. The projection was apparently invented by Stabius but the map was described by J. Werner, 1514, Nova translatio primi libri geographiae C. Pltolemaei, Nuremberg. 39

Werner’s (1515) Equidistant Equal Area Projection 40

Oblique versions of Werner’s projection are rare. The one shown here has its center at New York city, with the central axis directed towards Seattle. Note the position of the North Pole. This somewhat crude drawing was made directly from a computer line printer output in the 1960’s 41

An Oblique Version Of Werner’s Projection Centered at New York With Direction to Seattle North Orientation 42

It is often asserted that transportation costs increase at a decreasing rate with geographic distance. In other words, they have a concave down shape. On the map that follows the transport cost idea is represented by the square root of the spherical distance from the map center, but the map has also been made to preserve spherical areas. The equations are: X = R (2 )1/2 sin( sin ) Y = R (2 )1/2 cos( sin ) where is the spherical distance from the map center and is the longitude. 43

Equal Area Projection With Square Root Distances From Center Polar Case 44

Here are the coastlines. The oblique case of this equal area projection, with the great circle from New York (at the center) passing through Seattle as a straight 45 line, is next.

Oblique Version Of The Previous Projection Centered on New York and Directed Toward Seattle North orientation 46

Map Projections Come In Many Shapes Tobler’s hyperelliptical projection series 47

A Series of Equal Area Projections by Thomas F. Mc. Bryde, & Thomas, P. , 1949, Equal Area Projections for World 48 Statistical Maps, USC&GS Special Publication No. 245, Washington D. C.

Bonne projection variations 49

An Unusual Azimuthal Projection Directions are correct from the intersection of Greenwich and the Equator. Based on an idea by J. Craig, Cairo, 1910. 50

An Equal Area World Map 51

Lee’s Conformal Map Within A Triangle L. P. Lee, 1973, “The Conformal Tetrahedric Projection with Some Practical Applications”, Cartographic J. , 10(1): 22 -28. 52

Here Is A Little Footstool Equal area of course From Tobler’s hyperelliptical series 53

Here Is Another Novel Projection Suggested by C. Arden-Close. Implemented by P. B. Anderson. 54

Distance-Direction Diagram Distance from Santa Barbara read down. Direction from Santa Barbara read across. The line across the top represents Santa Barbara. 55

A New Three Sided Equal Area Map polar case 56

It is relatively easy to fit equal area maps into regular N sided polygons. One computer program can do them all, starting, as in the previous illustration, with N=3. Beyond about N=20 it is not very interesting because the maps all converge to Lambert’s (1772) azimuthal equal area projection with a circular boundary. W. Tobler 1972, “Lambert’s Notes on Maps”, Introduction and Translation of his “Beitraege, 1772”, Ann Arbor, 125 pages. The next map fits into a pentagon 57

A New Equal Area Map In A Five Sided Polygon polar case 58

Maps on the platonic solids have been known for a long time. They can be equal area or conformal. The gnomonic projection is particularly easy to do on the surface of these solids. Apparently they have never been done on the surface of a pyramid. The next illustration is a special case of an equal area projection having N pointed triangular protrusions on an N sided base. For three lobes the base is a triangle (this folds into a tetrahedron). With four lobes we get the pyramid. For six lobes the base is a hexagon, etc. All can be drawn with one computer program, with N as a parameter. Conformal versions are also possible. 59

Equal Area Projection on A Pyramid Cut out and glue together 60

A Map Projection for Quick Computer Display Want to display some geographic data on a computer screen? Here's a quick simple map projection that will do the job nicely for a modest sized region, away from the poles. The data are assumed to be given in latitude and longitude coordinates. The number of Lat/Lon points and the name of the file containing these points must be known. The main parameter is the average latitude of the region in question, and this is computed by the program. The average longitude is also needed, to center the projection. The projection uses the Gaussian mean radius sphere at the average latitude on the Clarke ellipsoid of 1866. A small program change permits the use of the WGS 83 ellipsoid. An output file name is also required. 61

The equations used are X = R { cos( o) * - sin( o) * * } Y = R { + 0. 5 * sin( o) * cos( o) * * }, where R is in kilometers per degree on the mean radius sphere (computed by the program). is the latitude minus the average latitude o and is the longitude minus the average longitude o. The X and Y coordinates are given in kilometers. The simplicity of the system can be seen by rewriting it as X = a 01 * + a 12 * * Y = a 10 * + a 22 * * . The distortion is also easily calculated from these equations. 62

The next two maps illustrate what happens when the equations are, inappropriately, applied to the entire sphere. The maps are neither equal area nor conformal, but, for a small area they are quite accurate and easy to compute. The entire world is not considered a small area. W. Tobler, 1974, “Local Map Projections”, The American Cartographer, 1(1): 51 -62. 63

The Bow Tie Projection By Tobler 64

The Floppy Bow Tie Projection By Tobler 65

Here Is an Equal Area Projection for the Pacific Ocean 66

This One is Equal Area and Makes the Earth Look Elliptical 67

Polyconic and polycylindric (a. k. a. pseudocylindric) projections are often used. Shown next is the development from three cylinders to the limiting case of an infinite number of cylinders resulting in the equal area sinusoidal projection. W. Tobler, 1986, “Polycylindrical Map Projections”, The American Cartographer, 13(2): 117 -120. 68

Many Projection Surfaces Are Used Here Is a Polycylindrical Development. From three cylinders to infinitely many, resulting in a continuous map. 69

All map projections result in distorted maps! Since the time of Ptolemy the objective has been to obtain maps with as little distortion as possible. But then Mercator changed this by introducing the idea of a systematic distortion to assist in the solution of a problem. Mercator’s famous anamorphose helps solve a navigation problem. His idea caught on. Anamorphic projections are used to solve problems and are not primarily for display. 71

Area cartograms are also anamorphoses - a form of map projection designed to solve particular problems. They represent map area proportional to some distribution on the earth, through a ‘uniformization’. This property is useful in studying distributions. The equations show that equal area projections are a special case of area cartograms. Area cartograms can also be displayed on a globe. 72

73

A Map Projection To Solve A Special Problem The next illustration shows the U. S. population assembled into one degree quadrilaterals We would like to partition the U. S. into regions containing the same number of people There follows a map projection (anamorphose) that may be useful for this problem 74

US Population By One Degree Quadrilaterals 75

Now use the Transform-Solve-Invert paradigm Transform the graticule, and map, to obtain areas of equal population. Then position a hexagonal tesselation on the map. Then take the inverse transformation. 76 W. Tobler, 1973, “A Continuous Transformation Useful for Districting”, Annals, N. Y Academy of Sciences, 219: 215 -220.

77

World Population by Latitude North to South 78

World Population by Longitude West to East 79

On the next map the tick marks indicate the latitude - longitude grid. The map is based on world population given by five degree quadrilaterals, but uses only the marginal distribution of the population (population by latitude and population by longitude) hence it is a “pseudo” cartogram. Map area is only approximately proportional to world population. Computer rendition using an anamorphising map projection computer program. 80 W. Tobler, 1986, “Pseudo Cartograms”, The American Cartographer, 13(1): 43 -50.

Pseudo-cartogram Of The World According To Population 81

Composite Equal Area Projections These are of little value but fun. The ones demonstrated include the Lambert cylindrical, Carl Mollweide’s projection, and the sinusoidal. Of course the combining technique also works with most polycylindric and pseudo-cylindric projections, including those of Craster, Eckert, Boggs, etc. and with my hyperelliptical system of projections. Affine transformations can yield more variants. 82

All are Equal Area Projections. All Maintain the Length of the Equator. All Meridians Meet the Equator at a Right Angle. Therefore they can be joined at the equator to have one projection for the Northern hemisphere and another for the Southern 83 hemisphere.

Lambert Above Mollweide Might make a nice bowl 84

Lambert Above Sinusoidal 85

Mollweide Above Lambert A loaf of bread, a cake? 86

Happy 70 th Birthday Professor Tobler 87

Sinusoidal Above Lambert A cap, maybe? 88

Sinusoidal Above Mollweide 89

Mollweide Above Sinusoidal A spinning top? 90

Mollweide Above Lambert Squashed With An Equal Area Affine Transformation. A church window? 91

Lambert Above Mollweide Squashed With An Equal Area Affine Transformation 92

Sinusoidal Above Lambert Squashed With An Equal Area Affine Transformation. Another church window? 93

Lambert Above Sinusoidal Squashed With An Equal Area Affine Transformation 94

Sinusoidal Above Mollweide Squashed With An Equal Area Affine Transformation Obviously a teardrop. 95

Mollweide Above Sinusoidal Squashed With An Equal Area Affine Transformation. A very unstable world. 96

Sinusoidal Projection Squashed With An Equal Area Affine Transformation. A nice lens. 97

Mollweide Projection Squashed With An Equal Areal Affine Transformation. The world on a diet. 98

Mollweide Projection Squashed Into An Equal Area Circle A new, attractive, world in a circle 99

Lambert Cylindrical Projection Squashed into an equal area square for use as a global quadtree W. Tobler, Chen, Z. , 1986, "A Quadtree for Global Information Storage", Geographical 100 Analysis, 18, 4 (Oct): 360 -371.

Another Equal Area Map in a Square 101

All azimuthal projections show directions from a center correctly. The only difference between them is the representation of distances from the center. The conventional representational display of the common azimuthal projections shows the latitude circles in the north polar case. The diagram illustrates the variation in the distances from the center of the map by showing variation the spacing of parallels. 102

Some Azimuthal Projections 103

Another representation leads to a more useful display of the azimuthal projections. The X axis represents distance on the sphere. The Y axis represents the same distance on the map. Take an increment (one centimeter, say) on the X axis, then move up to the curve. Then move across to the Y axis to find the amount by which the spherical distance has changed. The advantage of this representation is that the slope of the curves quickly reveals the distance change. It is an approximation to the areal enlargement. For example, if the slope is greater than one, the map area is enlarged. If the slope is less than one the map distances shrink. If the slope is equal to one we have the azimuthal equidistant projection. 104

The Radial Function Display Of Azimuthal Projections 105

Snyder’s Magnifying Glass Projection In the radial function display, with two scales and a discontinuity. 106

Snyder’s Magnifying Glass Projection J. P. Snyder, 1987, “Magnifying Glass Azimuthal Map Projection”, Am. Cartographer, 14(1): 61 -68 107

In studying migration about the Swedish city of Asby, Hägerstrand used the logarithm of the actual distance as the radial scale. This enlarges the scale in the center of Asby, near which most of the migration takes place. Actually, but not shown, there is a small hole in the middle of the map since the logarithm of zero is minus infinity. 108

Hägerstrand’s Logarithmic Map 109

An obvious choice for an azimuthal projection is to fit the spherical equivalent to a normal (Gaussian) distribution, or, as practiced by Hägerstrand, on some other empirical distribution on the earth. W. Tobler, 1963, "Geographic Area and Map Projections", The Geographical Review, LIII, 1 pp. 59 -78; reprinted in B. Berry and D. Marble, eds. , Spatial Analysis, Prentice Hall, 1968, pp. 78 -90; translated as "Geographischer Raum und Kartenprojektionen", pp. 262 -277 of D. Bartels, ed. , Wirtschafts und Sozialgeographie, Koln, Kiepenheur und Witsch, 1970. Also reprinted in S. Angell & G. Hyman, Urban Fields, Pion, London, 1976. 110
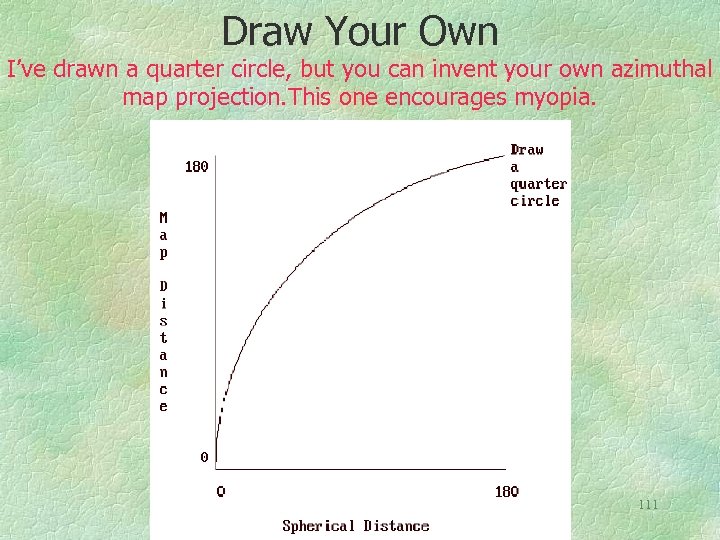
Draw Your Own I’ve drawn a quarter circle, but you can invent your own azimuthal map projection. This one encourages myopia. 111
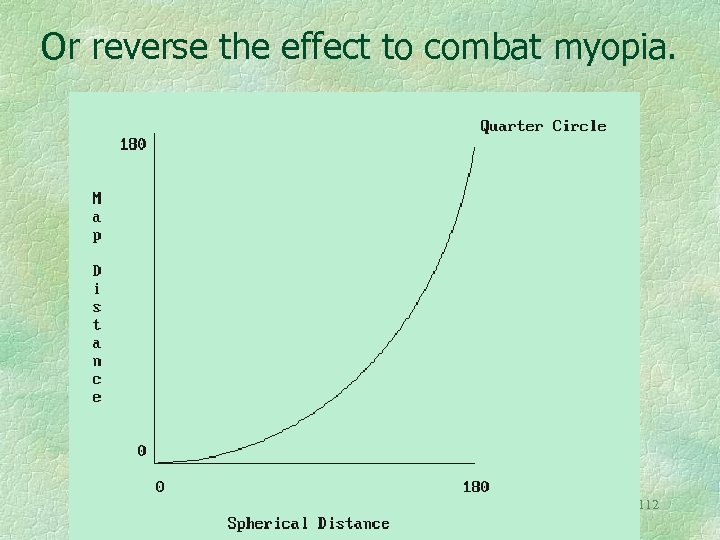
Or reverse the effect to combat myopia. 112
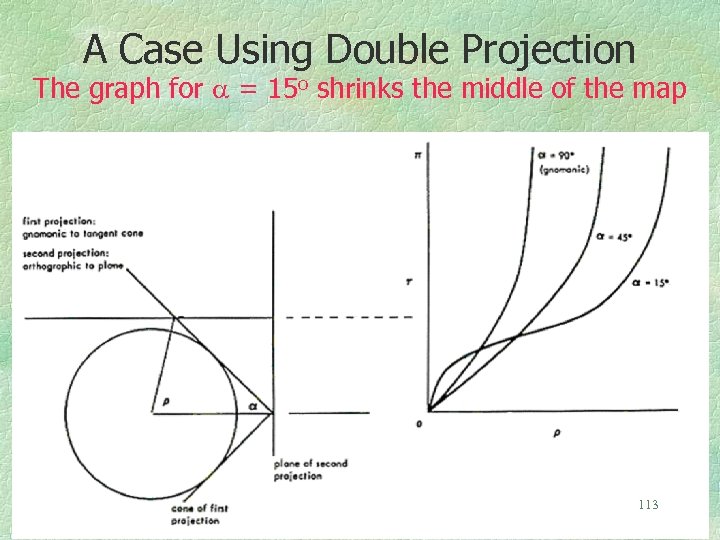
A Case Using Double Projection The graph for = 15 o shrinks the middle of the map 113
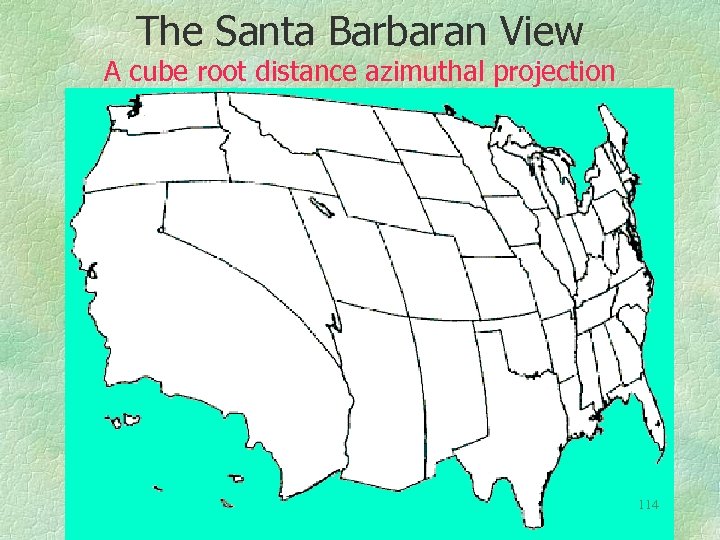
The Santa Barbaran View A cube root distance azimuthal projection 114
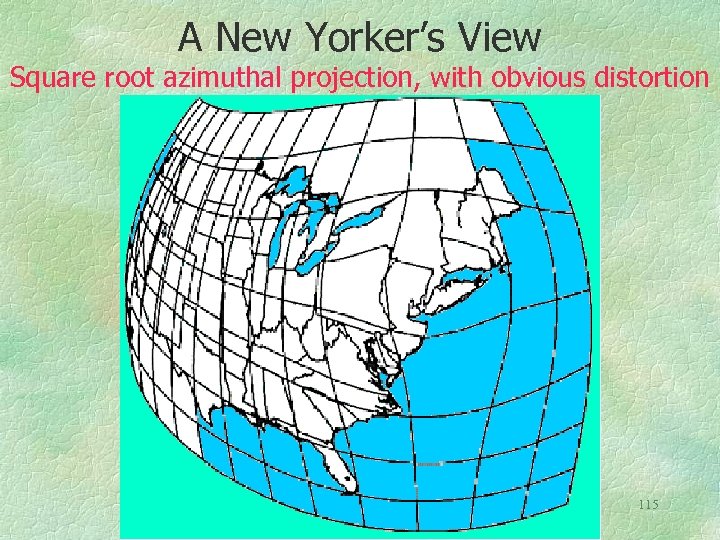
A New Yorker’s View Square root azimuthal projection, with obvious distortion 115
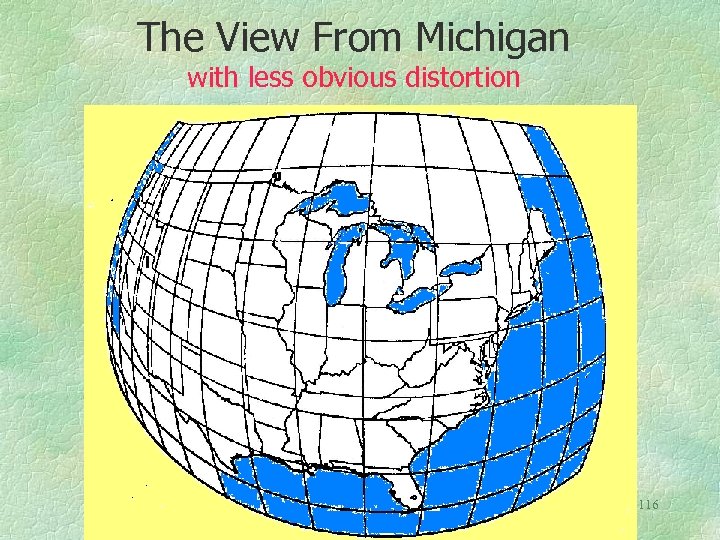
The View From Michigan with less obvious distortion 116
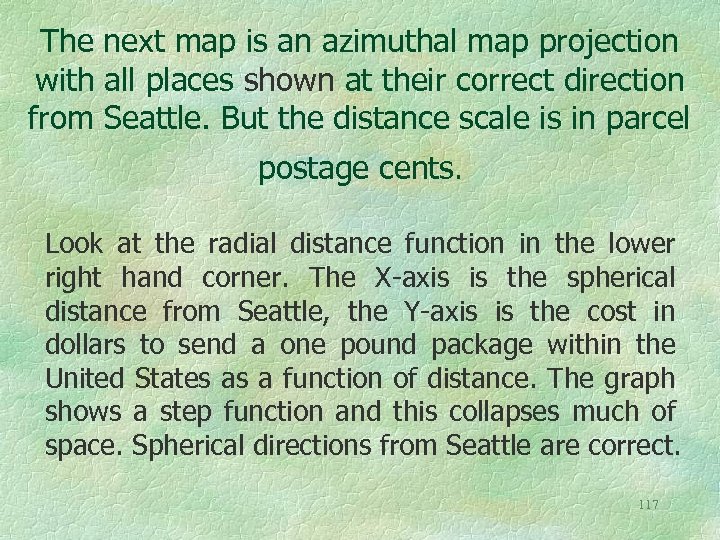
The next map is an azimuthal map projection with all places shown at their correct direction from Seattle. But the distance scale is in parcel postage cents. Look at the radial distance function in the lower right hand corner. The X-axis is the spherical distance from Seattle, the Y-axis is the cost in dollars to send a one pound package within the United States as a function of distance. The graph shows a step function and this collapses much of space. Spherical directions from Seattle are correct. 117
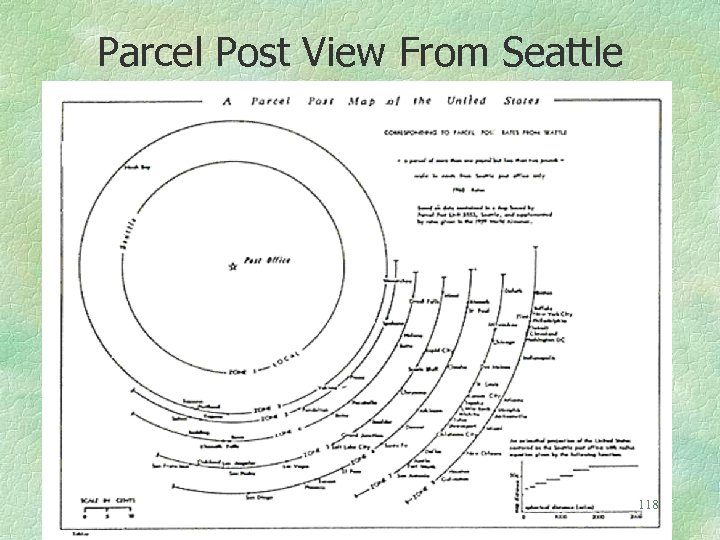
Parcel Post View From Seattle 118
There Are Many More Unusual Projections Of these the strangest may be the retro azimuthals, on which the map may fold over on itself. The size of the overlap, and the void, depends on the latitude of the center. 119
Retro-azimuthal projections show reverse directions to a center. This property can be combined with correct distances to the center. J. I. Craig, 1910, Map Projections, Cairo, Ministry of Finance. E. Hammer, 1910, “Gegenazimutale Projektionen”, Petermanns Mitteilungen, 56(3): 153 -155+Plate. C. F. Arden-Close, 1938, A polar retro azimuthal projection”, Geogr. J. , 92(6): 536 -537. D. A. King, 1999, World Maps for Finding the Direction and Distance to Mecca, Leiden, Brill. 120
A radio station was established at Rugby to broadcast a time signal to British colonies overseas. The equidistant retro-azimuthal projection was used to let the colonials know in which direction to point their radio antennas. A. R. Hinks, 1929, “A retro-azimuthal equidistant projection of the whole sphere”, Geogr. J. , 73(2): 245 -247. E. A. Reeves, 1929, “A Chart Showing the true bearing of Rugby from all Parts of the World, Geogr. J. , 73: 247 -250 121
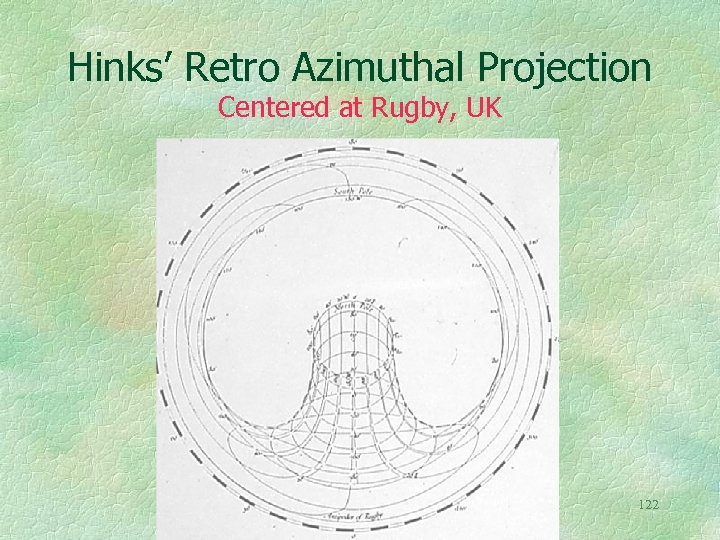
Hinks’ Retro Azimuthal Projection Centered at Rugby, UK 122
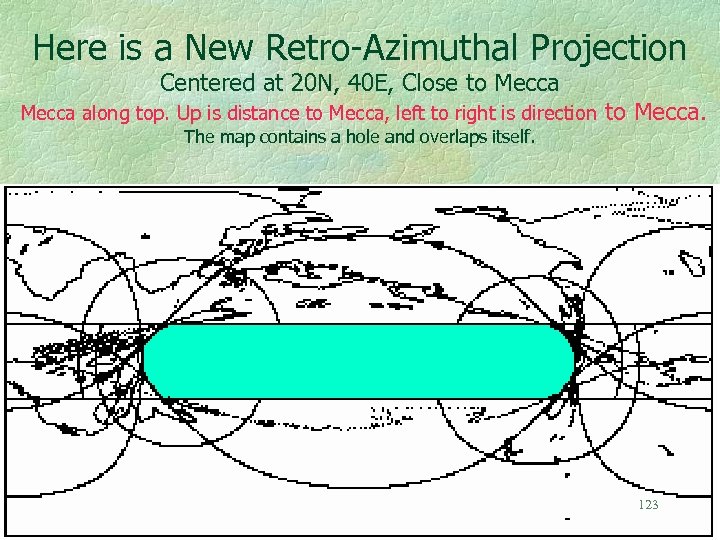
Here is a New Retro-Azimuthal Projection Centered at 20 N, 40 E, Close to Mecca along top. Up is distance to Mecca, left to right is direction The map contains a hole and overlaps itself. to Mecca. 123
In 1935 Brown Published A Mathematical Paper That Included All conformal projections with meridians and parallels as straight lines or as conics All equal area projections with meridians and parallels as straight lines or conics Conics include circles, ellipses, parabolas, and hyperbolae B. H. Brown, 1935, “Conformal and equiareal world maps”, Am. 124 Math. Monthly, 42(4): 212 -223.
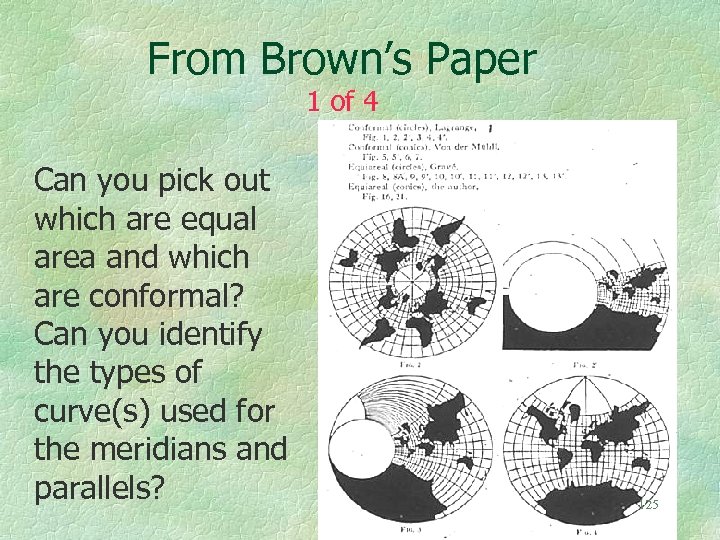
From Brown’s Paper 1 of 4 Can you pick out which are equal area and which are conformal? Can you identify the types of curve(s) used for the meridians and parallels? 125
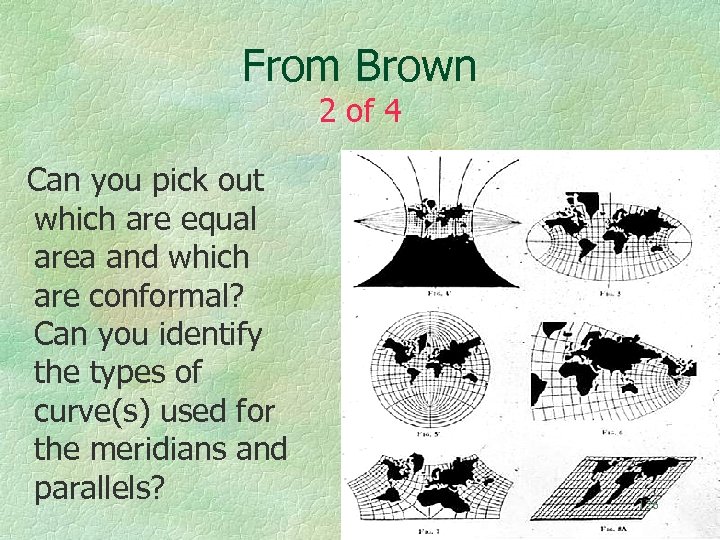
From Brown 2 of 4 Can you pick out which are equal area and which are conformal? Can you identify the types of curve(s) used for the meridians and parallels? 126
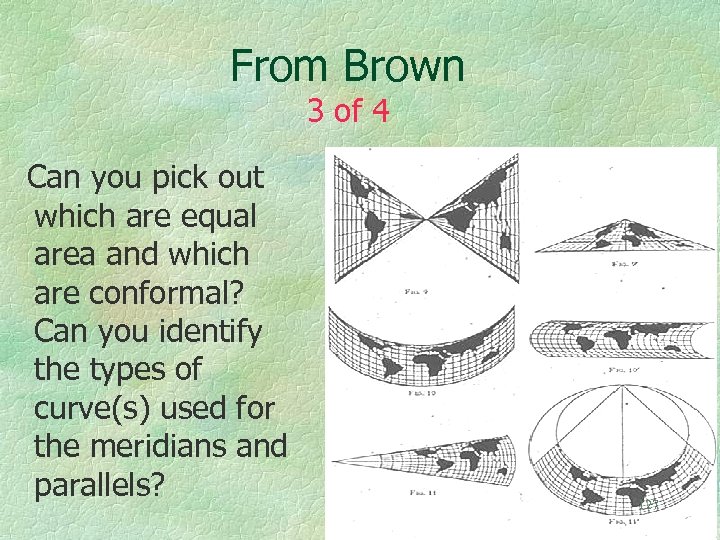
From Brown 3 of 4 Can you pick out which are equal area and which are conformal? Can you identify the types of curve(s) used for the meridians and parallels? 127
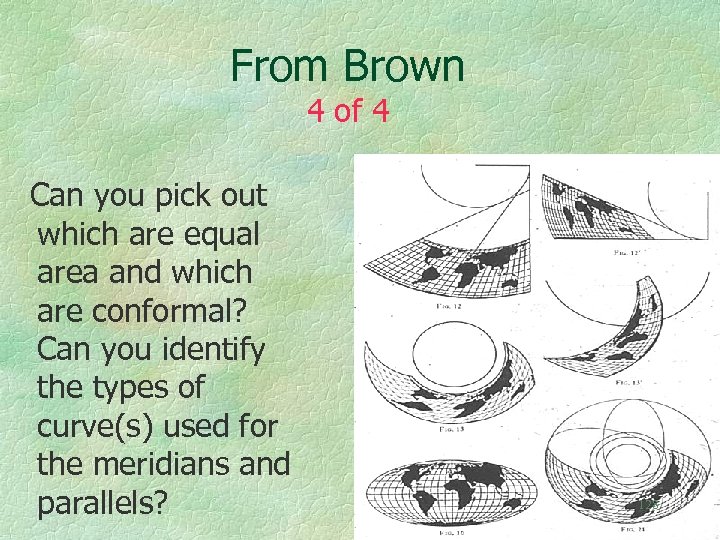
From Brown 4 of 4 Can you pick out which are equal area and which are conformal? Can you identify the types of curve(s) used for the meridians and parallels? 128
Finally, A classification of problems Given the need for a map • Of a geographic area - find the best projection l l Long, narrow, North-South, East-West, compact, circular, curving Local, regional, national, international, World • For a given geographical problem - find the best projection l Involving latitudes, great circles, loxodromes, azimuths, retro-azimuths, spherical circles, parabolas, or hyperbolas, directions, distances, areas, densities, or satellite tracks, etc. , or for navigation, land surveying, or thematic or special map, or conformal with least area distortion, equal area map or equal density cartogram with least angular distortion • Combine the foregoing • More of mathematical interest l l All equal area and all conformal projections with meridians and parallels of 1 st or 2 nd degree (solved by Brown, as in the previous views). The differential equation for: all conformal projections (Gauss), the ‘best’ conformal projection for an area (Chebyschev), all equal area projections (Lambert), all area cartograms (Tobler), all projections with meridian 129 and parallel intersections at a right angle (solved).
Projection problem classification, continued Find a map projection when l Given distances on sphere (ellipsoid) - find the best fitting plane map. • Great circle (geodesic) or loxodromic distances; chose from amongst known projections, or use least squares to construct interpolation tables l Given directions on sphere (ellipsoid) - find the best fitting plane map. • Great circle (geodesic) or loxodromic directions; choices as above l l Given densities on sphere (ellipsoid) - find the least distorted cartogram. Given distortion pattern - find the map projection. • From Tissot’s indicatrix, integrate to get the forward equations l l Given travel times (costs, etc. ) on the earth - find a map that represents these correctly (to scale) from one (two) center(s). Also make the map equal area. Find a projection (conformal, equal area, etc) for an irregular object • asteroid, human head, etc. 130
Projection problem classification, continued Given the map projection Given a known map projection. • • • Forward computation. The classic problem, now simple Determine distortion characteristics. Tissot the best known Devise measurement rules for use on the map (cartometry) Determine inverse equations when given forward formulae Inverse computation from coordinates on the map when no inverse formula is available Given two known map projections. • Determine the equations to interconvert directly • interconvert by interpolation or splining • Determine their similarity 131
Projection problem classification, concluded Given a map on an unknown projection Measure x, y coordinates at estimated or known lat/lon positions, then l Determine the exact projection • l Approximate the projection from the inverse • l Interpolate table for x, y -> lat/lon and lat/lon -> x, y Estimate the distortion • • l Center point, standard parallels, central meridian, etc. Get Tissot’s indicatrix from the tables (above) or from estimated equations Somewhat simpler, estimate scale variation, etc. Estimate the forward equations 132
Thank You For Your Attention 133 You are now prepared to have fun with map projections.
f998542110f790ea8e1879215aef5fb1.ppt