

96cac7531e8907d62526f51655cec994.ppt
- Количество слайдов: 46
 United States Cancer Registries FDA Meeting of Pediatric Subcommittee of the Anti-Infective Drugs Advisory Committee October 30, 2003 Phyllis A. Wingo, Ph. D, MS
 Outline of Presentation u Cancer registry programs in the United States u. Data available u. Data quality issues u. United States Cancer Statistics (USCS), including childhood cancers u. Follow-up u. Summary
 Cancer Registry Programs in the United States
 History of Cancer Registration in the United States u 1930's -First hospital based registries u 1941 - Connecticut Cancer Registry u 1971 - SEER Program u 1987 - NAACCR u 1990 - National Cancer Data Base u 1992 - National Program of Cancer Registries u 2000 - CDC and NCI Memorandum of Understanding u 2002 - United States Cancer Statistics
 Program u. NCI u 1973+ u 9 States") Surveillance Epidemiology and End Results (SEER) Program u. NCI u 1973+ u 9 States and 6 SEER/NPCR (2000+) AK HI metropolitan areas u 26% population coverage
Surveillance Epidemiology and End Results (SEER) Program u. NCI u 1973+ u 9 States and 6 SEER/NPCR (2000+) AK HI metropolitan areas u 26% population coverage
 u. CDC u 1995+ u 45 states, 3") National Program of Cancer Registries (NPCR) u. CDC u 1995+ u 45 states, 3 territories, District of Columbia u 96% population coverage NPCR/SEER AK HI
National Program of Cancer Registries (NPCR) u. CDC u 1995+ u 45 states, 3 territories, District of Columbia u 96% population coverage NPCR/SEER AK HI
 u. Passed by Congress October 1992 u.") Cancer Registries Amendment Act (PL 102 -515) u. Passed by Congress October 1992 u. Authorized establishment of National Program of Cancer Registries (NPCR) u. Set requirements for funded central registries
Cancer Registries Amendment Act (PL 102 -515) u. Passed by Congress October 1992 u. Authorized establishment of National Program of Cancer Registries (NPCR) u. Set requirements for funded central registries
 Requirements of Cancer Registries Amendment Act u. Statewide, population-based registry u. Statewide legislation/regulations u. Compliance with standards l Completeness l Timeliness l Quality u. Uniform data elements, uniformat u. Statewide annual report
 Legislation and Regulations u. Authorizing legislation supports existence of central registries u. State regulations: - Comprehensive reporting - Access to records - Reporting of uniform data - Protection of confidentiality - Access to data by researchers - Authorization to conduct research - Protection from liability
 Data available in population-based registries in the United States
 Reportable Cancer Case Defined as "each form of invasive cancer with the exception of basal cell and squamous cell carcinoma of the skin and each form of in situ cancer except for carcinoma in situ of the cervix uteri"
 Data Items Demographic Information, including at a minimum: l Name l Address at diagnosis l Census tract l Race and Spanish/Hispanic origin l Sex l Birth date l Social security number
 Clinical Information, including at a minimum: l Date of diagnosis l") Data Items (Continued) Clinical Information, including at a minimum: l Date of diagnosis l Date of admission/first contact l Source of information l Date and type of first course of definitive treatment (surgery) l Date of death l Underlying cause of death
Data Items (Continued) Clinical Information, including at a minimum: l Date of diagnosis l Date of admission/first contact l Source of information l Date and type of first course of definitive treatment (surgery) l Date of death l Underlying cause of death
 Pathologic Information, including at a minimum: l Primary site l Morphology") Data Items (Continued) Pathologic Information, including at a minimum: l Primary site l Morphology Type, behavior, and grade l Sequence number l Laterality l Diagnostic confirmation
Data Items (Continued) Pathologic Information, including at a minimum: l Primary site l Morphology Type, behavior, and grade l Sequence number l Laterality l Diagnostic confirmation
 Data Quality Issues
 NPCR Standards for Completeness Standard processes for measuring completeness: u. Case sharing with all bordering states u. Case reporting from all facilities providing cancer screening, diagnosis, and treatment u. Case finding audits u. Death clearance and follow-back u. Duplicate records protocol
 NPCR Standards for Timeliness Standard data items for measuring timeliness: u. Dates case report l sent to central registry l received by central registry l loaded into central registry database u. Date tumor record available in central registry
 NPCR Standards for Completeness and Timeliness u. Within 24 months, l <3% death certificate only cases l ≤ 0. 1% of records are duplicates u 90% of unduplicated, expected, malignant cases within 12 months u 95% of unduplicated, expected, malignant cases within 24 months
 NPCR Standard for Quality u. Within 12 months of the close of the dx year, 97% of the cases pass an NPCR prescribed set of standard data edits. u. Within 24 months of the close of the dx year, 99% of the cases pass an NPCR prescribed set of standard data edits.
 u. Uniform data standards for cancer") North American Association of Central Cancer Registries (NAACCR) u. Uniform data standards for cancer registration u. Education and training u. Certification u. Data publication u. Data use
North American Association of Central Cancer Registries (NAACCR) u. Uniform data standards for cancer registration u. Education and training u. Certification u. Data publication u. Data use
 NAACCR*-Certified State Cancer Registries by Year of Data Submission 1997 1998 2000 2002 DC *North American Association of Central Cancer Registries DC
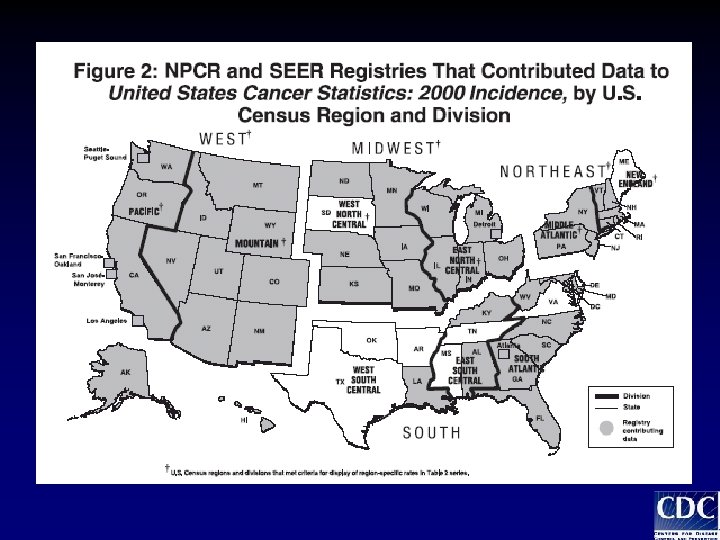
 United States Cancer Statistics, 2000 Incidence
 Joint Publication of National, Regional, and State Cancer Incidence Data United States Cancer Statistics (USCS) u 2000 incidence data u. Crude and ageadjusted rates per 100, 000 u 95% CI u 84% population coverage
 USCS – Eligibility Criteria u. High quality data l > 90% completeness of case ascertainment l < 5% death certificate-only cases l > 97% records pass EDITS l < 3% records missing information on race l < 2% records missing information on sex and age u 41 statewide and 6 metropolitan area cancer registries met criteria
 Registry Programs Meeting Quality Criteria 2000 Seattl e/Pug WA et Sound MT ME ND MN OR VT ID NH WI SD MI WY San Francisc o/Oaklan d San Jose/ Monterey Los Angeles PN NJ IL UT OH IN CO DE MD WV KS MO CA MA CT Detroi t IA NE NV NY VA DC KY NC TN OK AZ SC AR NM MS TX AK LA AL Atlant a GA REPUBLIC of Palau FL VIRGIN ISLANDS HAWAII PUERTO RICO 7 RI
 USCS - Content u. Section 1: National cancer incidence data by site, sex and race l 84% coverage US population u 84% White u 81% Black u 91% Asian / Pacific Islander l > 1 million new cases l > 10, 000 new cases among children 019 years old u. Section 2 u. Section 3
 Invasive Cancer Incidence Rates for the 15 Primary Sites with the Highest Age-Adjusted Incidence Rates, United States, 2000 Males, All Races Prostate Lung & Bronchus Colon & Rectum Urinary Bladder Non-Hodgkin Lymphoma Melanomas of the Skin Kidney & Renal Pelvis Oral Cavity & Pharynx Leukemias Pancreas Stomach Esophagus Larynx Brain & ONS Liver & IBD 160. 4 87. 9 65. 0 37. 8 21. 6 19. 4 16. 4 15. 7 14. 5 12. 1 10. 5 8. 5 7. 8 7. 7 7. 4 0 50 100 150 200 Rate per 100, 000 250 300
 Invasive Cancer Incidence Rates for the 15 Primary Sites with the Highest Age-Adjusted Incidence Rates, United States, 2000 Females, All Races Breast Lung & Bronchus Colon & Rectum Corpus & Uterus, NOS Ovary Non-Hodgkin Lymphoma Melanomas of the Skin Thyroid Urinary Bladder Pancreas Cervix Uteri Leukemias Kidney & Renal Pelvis Oral Cavity & Pharynx Brain & ONS 128. 9 52. 5 47. 0 23. 5 15. 8 15. 4 12. 4 10. 7 9. 8 9. 5 9. 2 8. 7 8. 4 6. 0 5. 5 0 50 100 150 Rate per 100, 000 250 300
 Lymphoma Incidence Rates by Sex, United States, 2000 Males Females Rate Count Lymphoma 22 23, 092 14 26, 052 Hodgkin 19 12 3 1 Non-Hodgkin Age-adjusted rates (2000) per 100, 000
 Invasive Skin Cancer Incidence Rates by Sex, United States, 2000 Males Females Rate Skin* Melanoma of skin Non-epi skin Count Rate Count 25 26, 052 18 23, 162 3 2 22 15 Age-adjusted rates (2000) per 100, 000 *Excluding basal and squamous cell skin cancer
 Invasive Cancer Incidence Rates for Childhood Cancers, by Sex, Ages 0 -19, 2000 ICCC category Males Females Rate Count All sites combined 166 5, 674 147 I Leukemia 42 36 II Lymphoma 28 20 III CNS 30 25 IV Sympath nerv sys 8 7 V 3 2 6 7 Retinoblastoma VI Renal tumors Age-adjusted rates (2000) per 1, 000 4, 782
 Invasive Cancer Incidence Rates for Childhood Cancers, by Sex, Ages 0 -19, 2000 Males Females ICCC category VII Hepatic tumors 2 2 VIII Malignant bone 9 8 IX Soft-tissue sarcoma 13 10 XI Carcinomas 11 19 XII Other 1 1 Not classified ^ 1 Germ-cell tropho Age-adjusted rates (2000) per 1, 000
 USCS - Content u. Section 1: National cancer incidence data by site, sex and race u. Section 2: Cancer incidence data by states, census division, sex and race l Regions > 80% population coverage u. Pacific 100%, u. Mt. 100% u. W. N. Central 96% u. E. N. Central 100% u. Mid. Atlantic 100% u. New England 91% u. South 57%
 USCS - Content u. Section 1: National cancer incidence data by site, sex and race u. Section 2: Cancer incidence data by states, census division, sex and race for the leading 20 sites males, 29 sites females u. Section 3: State-specific cancer incidence rates ranked within sex and race for the leading 15 sites
 Follow-up in Population-Based Registries in the United States
 Follow-up to Determine Vital Status To confirm deaths among cancer patients, all NPCR and SEER registries link with: u. State death certificates files u. Social security files u. National Death Index (NDI)
 Follow-up to Determine Vital Status To confirm alive status among cancer patients, all SEER (9 states) and selected NPCR registries (very few) link with: u. Social security files u. Hospital discharge data u. Medicare (CMS) u. Voter registration u. Motor vehicle registration u. Other
 Summary u. Population-based cancer registries in all 50 states and the District of Columbia. u. CTQ varies across states u. Follow-up good for death status, limited for alive status
 Summary u. Strong nationwide cancer registry infrastructure in place u. Data available at national, regional, state and local levels for: l Monitoring burden of disease l Planning comprehensive cancer control programs l Conducting special research studies
 www. cdc. gov/cancer/npcr
 Future Plans u u u Expand population-based coverage Include other racial and ethnic groups Estimated of case counts at the national and regional levels u Trend data u Pediatric cancers u Mortality data
 Frequency Distribution Ages 0 -19, 2000 ICCC category NPCR N=9, 882 SEER N=1, 823 I Leukemia 25% 27% II Lymphoma 15 14 III CNS 18 17 IV Sympathetic nervous system 5 5 V 2 2 VI Renal tumors 4 4 VII Hepatic tumors 1 1 VIII Malignant bone tumors 5 5 Retinoblastoma
 Frequency Distribution, continued Ages 0 -19, 2000 ICCC category IX Soft-tissue sarcoma X Germ-cell trophoblastic XI Carcinomas XII Other Not classified Total NPCR N=9, 882 8% SEER N=1, 823 9% 7 7 9 0 0 100
 Lymphoma and Reticuloendothelial Neopl, 2000 Age-Specific and Age-Adjusted Incidence Rates are per 1, 000 and are age-adjusted to the 2000 US standard population
 Acute Lymphocytic Leukemia, 2000 Age-Specific and Age-Adjusted Incidence Rates 0 -04 Rates are per 1, 000 and are age-adjusted to the 2000 US standard population