15a354b6d0139f5aa4523c637adcedaf.ppt
- Количество слайдов: 55


Unit 2 Supply & Demand

Demand Basics • Demand Schedule and Demand Curve

Demand Basics • Demand versus Quantity Demanded • Demand- quantities consumers are willing and able to buy at various prices • Quantity Demanded- quantity consumers are willing and able to buy at a given price

Demand Basics • Demand versus Quantity Demanded • Demand- the whole curve • Quantity Demanded- a point on the curve

Demand Basics • Demand versus Quantity Demanded • Change in Demand- the whole curve shifts • Change in Quantity Demanded- move from one point on the curve to another

Demand Basics • Changes in Demand – Consumer Income • Normal v. Inferior Goods – Population – Preference/Taste – Price of Other Goods • Compliments • Substitutes – Expectation of Change in Price

Why Demand Slopes Downward? • Income Effect • Substitute Effect • Diminishing Marginal Utility

Why Demand Slopes Downward? • Income Effect – Higher price = Lower purchasing power – Lower price = Higher purchasing power – “ability to buy”

Why Demand Slopes Downward? • Substitute Effect- think opportunity cost – Higher price = Lower relative price of substitutes – Lower price = Higher relative price of substitutes
, get a 2 nd")
Why? • 1 st pizza for full price ($11. 00), get a 2 nd for $5?

Why? • Buy one pair at regular price and get the second pair half off? • BOGO Days!

Why Demand Slopes Downward? • Diminishing Marginal Utility

Why Demand Slopes Downward? • Diminishing Marginal Utility – MU= satisfaction quantified in dollars of an additional unit of consumption – Marginal Utility ALWAYS* decreases with additional consumption

Why Demand Slopes Downward? • Diminishing Marginal Utility/Benefit • Cost-Benefit Analysis – How many slices will you consume? – MU=MC – MB=MC

Individual & Market Demand Curve • Horizontal sum of individual demand curves

Supply Basics • Supply Schedule and Supply Curve

Supply Basics • Supply versus Quantity Supplied • Supply - quantities producers are willing and able to sell at various prices • Quantity Supplied- quantity producers are willing and able to sell at a given price

Supply Basics • Supply versus Quantity Supplied • Supply - the whole curve • Quantity Supplied- a point on the curve

Supply Basics • Change in Supply - the whole curve shifts • Change in Quantity Supplied- move from one point on the curve to another

Supply Basics- Changes • • # of Producers Technology Price of Inputs Substitutes of Production Compliments of Production Taxes and Subsidies Other Regulations

Individual & Market Supply Curve • Horizontal sum of individual supply curves
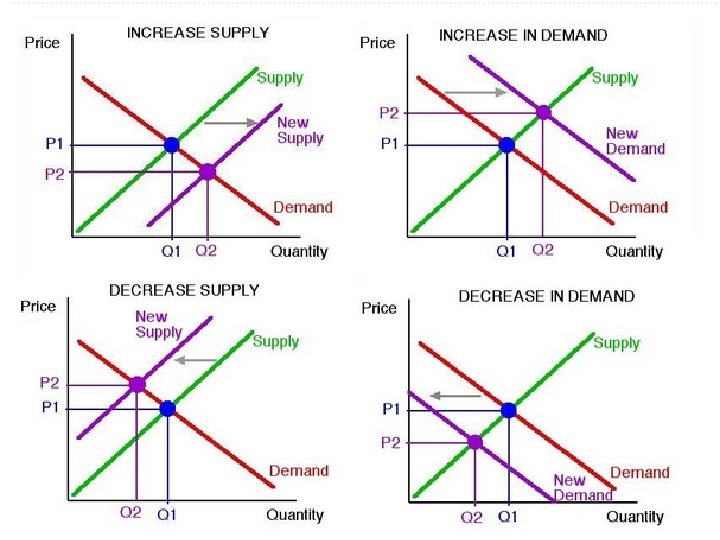

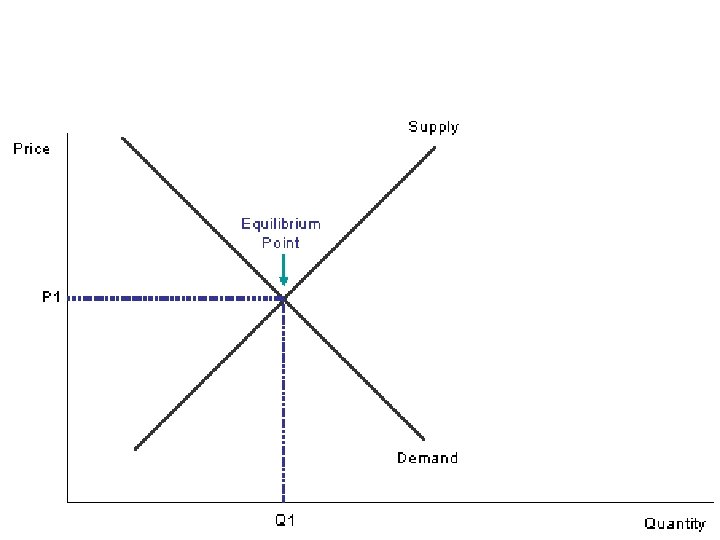
What if they both shift? • Equilibrium Price? • Equilibrium Quantity? • One change is certain • The other is ambiguous

What if they both shift? • Coffee – New Rebecca Black Song – New Fertilizer

What if they both shift? • Same Shift- know Q • Opposite Shift- know P

Equilibrium Price = Market Clearing Price

Let’s Review • • Shifts Double Shifts Ceilings and Floors Shortage and Surplus ---------------------Quantifying Shortage and Surplus Other Effects of Ceilings and Floors
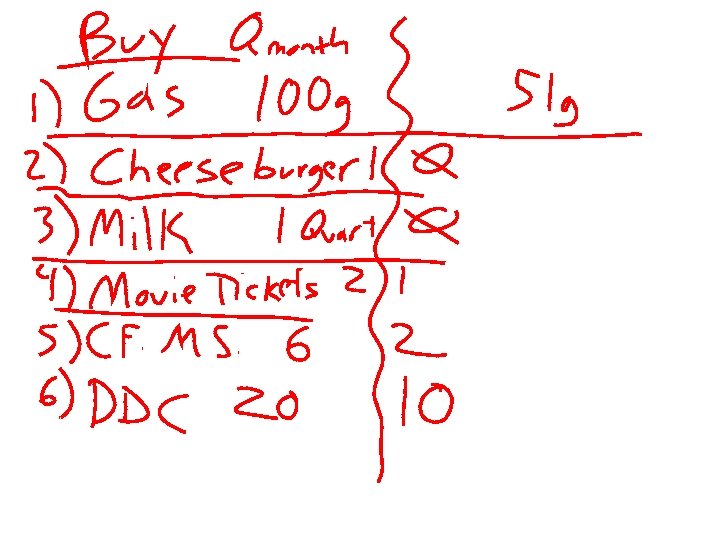

PED

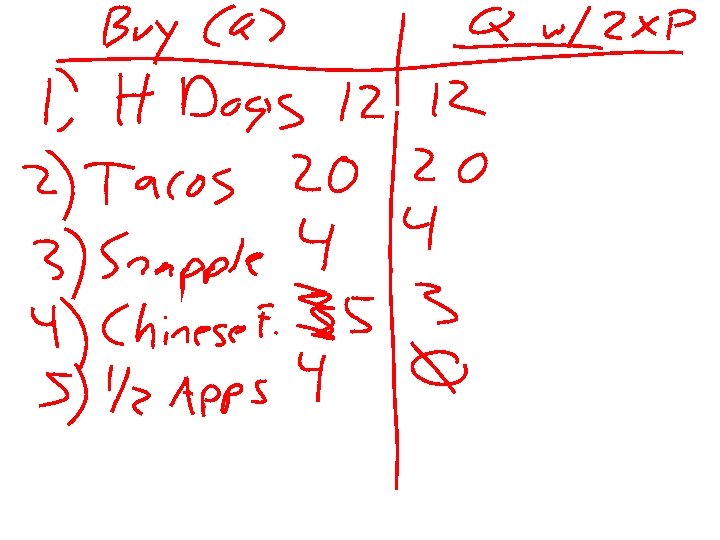
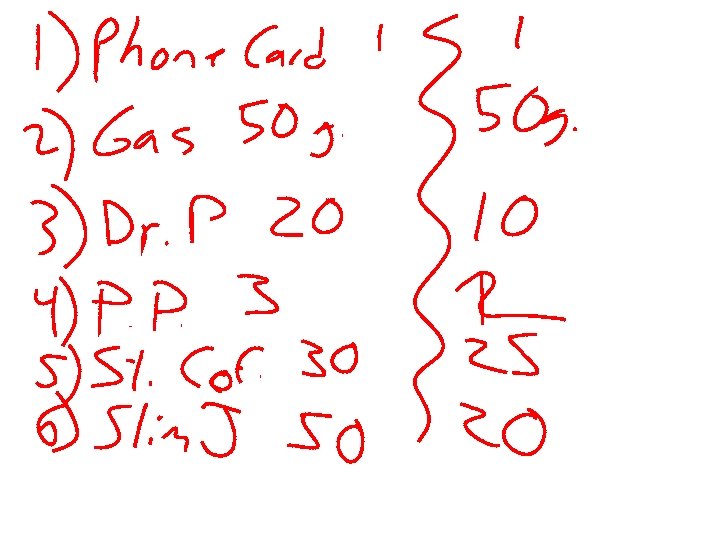
PED • Relationship between % change in price and % change in quantity

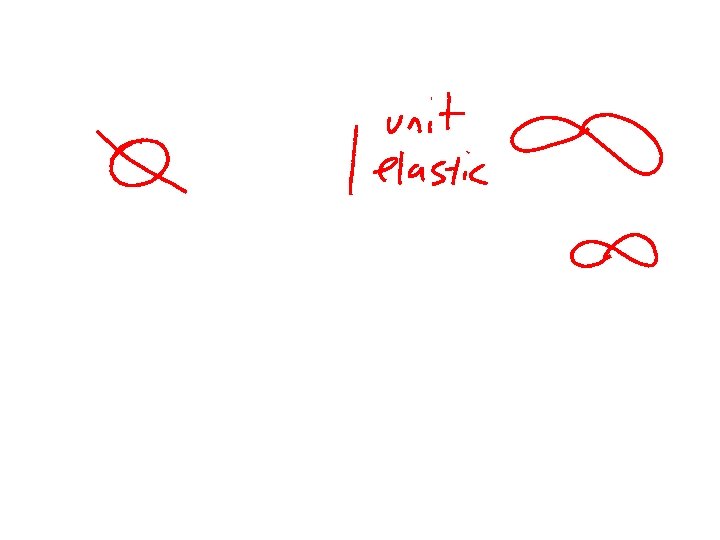
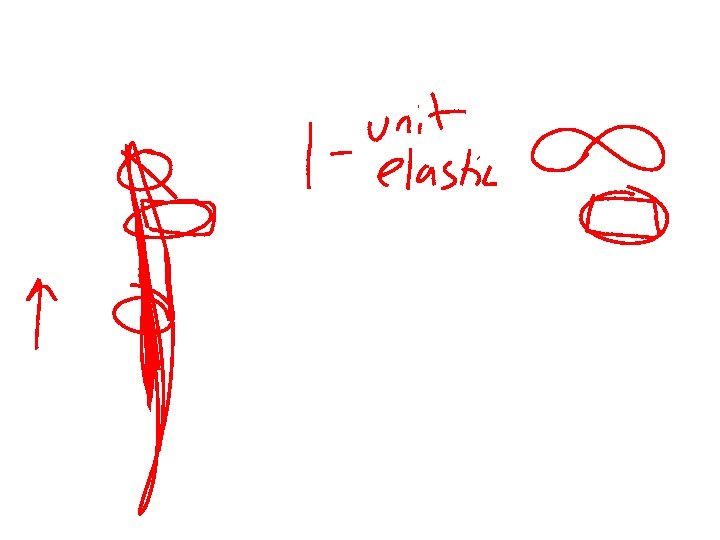
PED Perfectly Inelastic = 0 Unit Elastic = 1 Perfectly Elastic =

PED Perfectly Inelastic = 0 • Inelastic <1 Unit Elastic = 1 • Unit Elastic = 1 Perfectly Elastic = • Elastic > 1

If the market price is above equilibrium price…

If the market price is below equilibrium price…
 • Decrease in unemployment P Q")
S & D for Non-Smart Phones (inferior good) • Decrease in unemployment P Q
 • Increase in the price of")
S & D for Non-Smart Phones (inferior good) • Increase in the price of Smart Phones P P Q Q
 • Gov’t subsidy for the production")
S & D for Non-Smart Phones (inferior good) • Gov’t subsidy for the production of smart phones P P Q Q

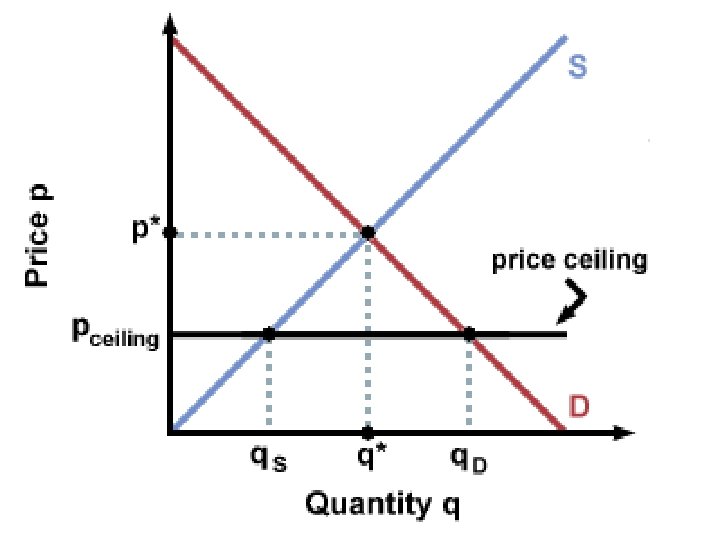
Price Controls Effects beyond Surpluses and Shortages

Price Controls Effects beyond Surpluses and Shortages • BOTH reduce the quantity of a good bought and sold

Price Ceilings • Shortages • Inefficiencies • Black Markets

Price Ceilings- Inefficiencies • Misallocation of Resources – Need and willingness to pay • Wasted Resources – Time and money spent overcoming the shortage • Inefficiently Low Quality

Price Ceilings- Black Markets • Illegal Markets • Prices ABOVE equilibrium – Prices account for additional cost in the form of risk

How to stop Canal Street Sales?

Price Ceilings Non-Binding • Set above equilibrium • Market prices will remain below the ceiling

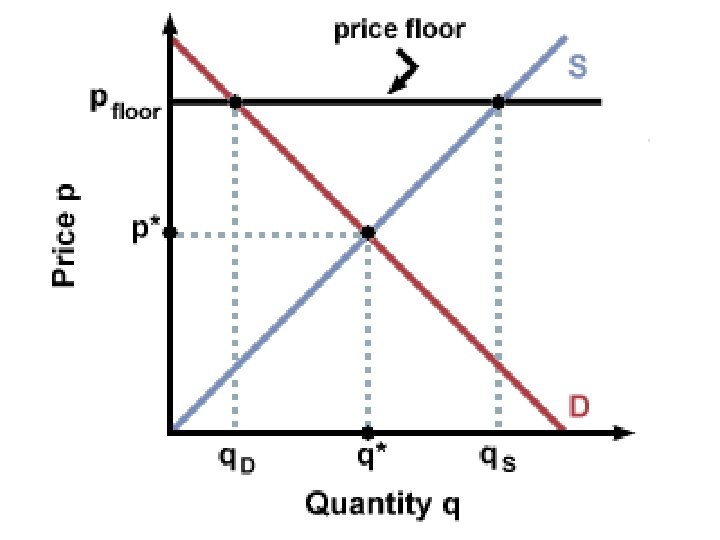
Price Floors Non-Binding • Set below equilibrium • Market prices will remain above the floor

Price Floors • Surpluses • Inefficiencies • Black Markets

Price Floors- Inefficiencies • Misallocation of Resources – Those willing to sell at the lowest price do not always succeed • Wasted Resources • Inefficiently High Quality

Price Floors- Black Markets • Illegal Markets • Prices below equilibrium – Prices account for the relatively low number of consumers willing to break the law
15a354b6d0139f5aa4523c637adcedaf.ppt