

a9524054a830f698bc1ff2e9f27a3a96.ppt
- Количество слайдов: 181
 The agricultural negotiations at") UNION OF SMALL AND MEDIUM SCALE FARMERS OF NIGERIA (USMEFAN) The agricultural negotiations at the WTO: mechanisms and tricks 9 April 2007 Jacques Berthelot, Solidarité
UNION OF SMALL AND MEDIUM SCALE FARMERS OF NIGERIA (USMEFAN) The agricultural negotiations at the WTO: mechanisms and tricks 9 April 2007 Jacques Berthelot, Solidarité
 OUTLINE Introduction: from the GATT to the WTO I – Origin and justifications of the liberalisation of agricultural policies II – Analysis of the WTO's Agreement on Agriculture III – The strategy of the main groups of WTO Members IV – The Doha Round stalled negotiations since Hong-Kong V – The mechanisms at work beyond Northern subsidies: the role of prices and supply management
 Introduction: from the GATT to the WTO Close to the end of the 39 -45 war, which had killed 50 million people on the 5 continents, the Allies met in Bretton Woods (North-East of the US) in 1944 to lay the foundations of Institutions in charge of regulating the international economic relations, convinced that this conflict had largely been caused by the protectionist moves of Western countries in the 1930 s in order to face the strong rise in unemployment generated by the great crisis triggered by the Wall Street krach of 1929.
 Introduction: from the GATT to the WTO They have therefore created the IMF to lend strong currencies to countries unable to import, the World Bank to finance on the medium and long run the reconstruction of countries devastated by the war then the developing countries' needs, but they did not yet agree to create an International Trade Organisation (ITO). After a preparatory meeting by 23 countries in October 1947 in Geneva, an international conference has gathered in 1948 more than 50 countries in Cuba which have signed the Havana Chart creating the ITO.
 Introduction: from the GATT to the WTO But the US Congress has refused to ratify it, because it foresaw a coordination of intervention mechanisms on the prices of raw materials which would have worked against the "free play of market forces", and therefore the other countries did not ratify it either. But the 23 countries (including some DCs) which had signed the chapter 4 of the Chart in Geneva, related to a General Agreement on Tariffs and Trade (GATT) have become the Contracting Parties of a mere intergovernmental Agreement and not of a constraining Treaty.
 Introduction: from the GATT to the WTO The GATT contains the principles leading to free trade, by reducing tariffs progressively, during periodical trade rounds. Already 8 of them where negotiated before the Doha Round. It was at the end of the Uruguay Round negotiations (1986 -93) that the WTO (World Trade Organization) has been created the 15 April 1994 in Marrakech, in order to coordinate the trade in goods and services and to judge the trade disputes arising among its Members States (125 in Marrakech, 150 to-day and negotiations are going on with 30 more).
 Introduction: from the GATT to the WTO The WTO has been created to coordinate the smooth working of the 21 multilateral Agreements signed in Marrakech – of which the Agreement on Agriculture (Ao. A), the Agreement on Sanitary and Phytosanitary Measures (SPM) and the Agreement on Trade Related Intellectual Property Rights linked to trade (TRIPS) – and this through the Dispute Settlement Body (DSB) which runs the complaints between Members through panels. The ministerial conference meets every other year and the General Council according to needs.
 The WTO's exhibited objectives According to the preamble of the Agreement creating the WTO, the worldwide sustainable development requires the growth of trade in goods and services through "the substantial reduction of tariffs and other barriers to trade". Why? Because the premise or "Washington consensus" is laid down that trade barriers prevent the maximization of world growth, of world "welfare", when all countries can implement their "comparative advantages".
 Trade liberalization is supposed to increase world welfare It is claimed that the "consumers' surplus" is then maximized – they are supposedly benefiting from world prices lower than the domestic prices – and is higher than the sum of the losses in the producers' surplus – their prices drop given the increase in cheaper imports – and the government's surplus, following the drop in tariffs. However we will see that the cut in agricultural prices is not transmitted to consumers.
 The decision-making process at the WTO Despite theoretical rule 1 Member=1 vote, the generalisation of the decision-making process per consensus had actually given the guidance powers to the QUAD: EU, US, Japan, Canada. Since Cancun, the QUAD has turned into the G-4 with Brazil and India replacing Japan and Canada. During the Rounds, notably now in the Doha Round (DR), the decisions are prepared in informal meetings restricted to 20 -30 Members, known as "mini-ministerials" outside the WTO Ministerial Conferences and as "green rooms" during them, excluding the majority of DCs.
 I – Origin and justifications of the agricultural policies liberalisation Up to 1995 – with the implementation of the WTO's Agreement on Agriculture (Ao. A) –, the agricultural prices and market policies remained a purely national concern since the GATT, created in 1947 to liberalize the trade in goods, admitted exceptions for agriculture, notably the right to impose quantitative restrictions – which was positive – but also to subsidize exports, which was not !
 I – Origin and justifications of the agricultural policies liberalisation As long as protecting agriculture met the US interests, international organizations (OECD, WB, IMF, GATT) and the mainstream economic theory put up very well with it, in the name of the specificity of agriculture In the mid 80 s the US interests, whose agricultural exports had shrunk due to a too strong $, converged with those of the EU to launch a new trade Round (the Uruguay Round) in order to integrate into the GATT agriculture (for the US) and the services linked to trade (for the EU)
 I – Origin and justifications of the agricultural policies liberalisation The liberalisation of agricultural policies has been fostered under the pressures of large agrifood corporations (agro-industries and large food chains), with the main objective of a continuous slump in the prices of agricultural products, which constitute their raw materials The priority has been given to the slump in the prices of feedstuffs (COP: cereals, oilseeds and pulses) in order to reduce the production cost of animal products (meats, eggs and dairy)
 I – Origin and justifications of the agricultural policies liberalisation The international institutions and neo-liberal economists have then accentuated their propaganda on the benefits of free-trade for agricultural products and predicted a high increase of world agricultural prices. To such an extent that a "Decision on measures concerning the possible negative effects of the reform programme on least-developed and net foodimporting countries" was adopted at Marrakech the 15 April 1994 which compelled developed countries to compensate poor and net food deficit DCs for these expected prices increases.
 I – Origin and justifications of the agricultural policies liberalisation The increased liberalisation of agricultural trade has been a disaster for family farmers worldwide since agricultural products are not ordinary goods and their markets do not self-regulate. Facing a stable demand in the short run, agricultural production fluctuates along with climatic vagaries, and even more agricultural prices and incomes so as consumers' prices. That is why all countries since the Pharaohs have run agricultural policies to regulate the supply at the import level and through stockholdings.
 I – Origin and justifications of the agricultural policies liberalisation Agri-food corporations have been very cunning, avoiding to push themselves forward in the media and arguing that this would benefit consumers first and foremost. Agricultural prices have collapsed without any transmission to consumers' prices which have continued to increase, at least in developed countries, and the profits of agri-food corporations have increased greatly.
 I – Origin and justifications of the agricultural policies liberalisation Whereas coffee and cocoa prices had reached their lowest level, Nestlé, the 1 st world corporation in agri-food, has realized a net profit of 21% in 2001, 22% in 2002, 17% in 2003, 17. 4% in 2004, 18% in 2005 on a shareholders’ equity doubled from $19. 9 billion to $40 billion Kraft Foods, 2 nd world corporation in agri-food, has got a net return of 13. 1% on its $25. 8 billion of shareholders' equity (SE) in 2002 although it dropped to 8, 9% on a SE of $29. 6 bn in 2005
 The earlier and larger agricultural liberalisation imposed to DCs since the 80 s 98% of farmers are living to-day in DCs In DCs the liberalisation of agriculture has been imposed in the early 80 s by the structural adjustment policies (SAPs) of the IMF and World Bank to increase the competitiveness of their products in order to reimburse their foreign debts by exporting more and importing less: reducing import protection and subsidies to farmers and consumers, devaluation, privatising marketing boards, reducing State interventions upstream and downstream farms level.
 The earlier and larger agricultural liberalisation imposed to DCs since the 80 s Whereas the Agreement on Agriculture (Ao. A) had been negotiated practically between the EU and US according to their interests, DCs have been obliged to sign even if they did not want it. Indeed WTO negotiations are concluded by the obligation to sign all Agreements ('single undertaking') or to get out of WTO, which has become impossible since it regulates now practically all international economic relations. Besides, being a WTO Member is a requirement of developed countries and the WB and IMF.
 The quasi-religious brainwashing on agricultural liberalisation: IMF and World Bank The dogma: if the liberalisation of agriculture has not fulfilled all the promises made at the time of signing the WTO in 1994 – notably higher world agricultural prices –, it is because it has not be sufficient and one should therefore brought it quickly to completion The high-priests: the WB and IMF are dominating more and more the WTO, with an annual meeting of its General Council on the "coherence" of their policies, and being observers in all WTO Committees, notably the Committee on agriculture.
 The quasi-religious brainwashing on agritural liberalisation: IMF and World Bank The WB has declared at the Committee on agriculture the 15 -11 -04: "Unfortunately. . . the concept of food security has been used in the Doha negotiations primarily to suggest that developing countries should be allowed to maintain high barriers to imports of food products as a means of increasing national production, under the rubric of 'special products' or as a component of the 'development box'… This kind of policy is likely to have only very limited short-term benefits to farmers - and to be counter-productive to the objective of long-run structural food security. "
 The EU and US have imposed complementary bilateral free-trade agreements to DCs The EU and US have negotiated since 1995 many free-trade agreements with DCs. Notably the EPAs (Economic partnership agreements) decided by the Cotonou Agreement (2000) for the 1 st January 2008 with ACP countries (see the second file). To show it is a model WTO Member, the EU has adopted the Decision "Everything but arms" in 2001 for LDCs, but the incentive to export rather than protect the domestic market would have detrimental effects on LDCs.
 The disarray of most family farmers in the world is not a North-South issue For the farmers' organisations of Via Campesina, the agricultural trade liberalisation promoted by the WTO, the WB and IMF is not opposing Northern farmers to Southern farmers but agricultural policies and agricultural production systems designed in the sole interest of agrifood corporations, which are eliminating the small family farmers, even if those from the South are the most numerous and suffer more.
 The mythology of boxes") II – Analysis of the WTO Agreement on Agriculture 1) The mythology of boxes at the WTO 2) That typology of boxes is theoretically mystifying and politically a major swindle 3) The lack of control by the WTO has allowed the EU and the USA to cheat massively 4) The EU's blue box and Single Payment Scheme are coupled and should be in the amber box
II – Analysis of the WTO Agreement on Agriculture 1) The mythology of boxes at the WTO 2) That typology of boxes is theoretically mystifying and politically a major swindle 3) The lack of control by the WTO has allowed the EU and the USA to cheat massively 4) The EU's blue box and Single Payment Scheme are coupled and should be in the amber box
 The mythology of boxes at the WTO a) The distinction between support and") 1) The mythology of boxes at the WTO a) The distinction between support and subsidy b) The OECD's indicators of agricultural support c) Coupled support or trade-distorting support d) The hierarchy of boxes at the WTO e) Reductions of support according to categories of WTO Member countries
1) The mythology of boxes at the WTO a) The distinction between support and subsidy b) The OECD's indicators of agricultural support c) Coupled support or trade-distorting support d) The hierarchy of boxes at the WTO e) Reductions of support according to categories of WTO Member countries
 Distinction between support and subsidy If any subsidy – a public expenditure financed") a) Distinction between support and subsidy If any subsidy – a public expenditure financed by tax-payers – is a support, the reverse is not true: support is a broader concept than subsidy since it encompasses "the market price support", which results first from the import protection increasing the gap between the domestic and world prices but also from other measures limiting the production put on the domestic market: - export subsidies - administered prices with public stockholding - set aside of agricultural lands - external and domestic food aid - subsidies to private stockholding
a) Distinction between support and subsidy If any subsidy – a public expenditure financed by tax-payers – is a support, the reverse is not true: support is a broader concept than subsidy since it encompasses "the market price support", which results first from the import protection increasing the gap between the domestic and world prices but also from other measures limiting the production put on the domestic market: - export subsidies - administered prices with public stockholding - set aside of agricultural lands - external and domestic food aid - subsidies to private stockholding
 OECD's indicators of agricultural support Since for OECD, the main 'think tank' of") b) OECD's indicators of agricultural support Since for OECD, the main 'think tank' of Western countries promoting free-trade, consumers are entitled to pay their food at the world prices, and since import protection prevent them to do so, they are suffering a negative consumers' surplus, measured by the gap between the domestic and world prices, considered as a trade distortion and as a "transfer from consumers to producers", assimilated to a subsidy of consumers to producers.
b) OECD's indicators of agricultural support Since for OECD, the main 'think tank' of Western countries promoting free-trade, consumers are entitled to pay their food at the world prices, and since import protection prevent them to do so, they are suffering a negative consumers' surplus, measured by the gap between the domestic and world prices, considered as a trade distortion and as a "transfer from consumers to producers", assimilated to a subsidy of consumers to producers.
 OECD's indicators of agricultural support For OECD, the total support estimate (TSE) to") b) OECD's indicators of agricultural support For OECD, the total support estimate (TSE) to farmers of Western countries has reached $330 billion on average from 2001 to 2003, i. e. almost $1 billion per day, but the truth is $186 billion since the market price support (gap between domestic and world prices) has been $148 billion. The TSE is equal to the GSSE (general services support estimate), which groups together the collective subsidies in kind plus the PSE. The PSE (producer support estimate) has reached $241 billion from 2001 to 2003 but, deducting the $148 billion of market price support, actual individual subsidies to farmers have reached $94 billion.
b) OECD's indicators of agricultural support For OECD, the total support estimate (TSE) to farmers of Western countries has reached $330 billion on average from 2001 to 2003, i. e. almost $1 billion per day, but the truth is $186 billion since the market price support (gap between domestic and world prices) has been $148 billion. The TSE is equal to the GSSE (general services support estimate), which groups together the collective subsidies in kind plus the PSE. The PSE (producer support estimate) has reached $241 billion from 2001 to 2003 but, deducting the $148 billion of market price support, actual individual subsidies to farmers have reached $94 billion.
 OECD's indicators of agricultural support The idea that consumers are deprived from their") b) OECD's indicators of agricultural support The idea that consumers are deprived from their 'right' to pay their food at the world prices is all the less founded that: 1) This world price is a dumping price, lower than the production cost of all countries. 2) The slump in world prices is generally not transmitted to consumers. 3) The drop in domestic agricultural prices is even less transmitted, as the experience has shown in the EU and US, where farmers sell rarely directly to consumers but mainly to agri-food companies which have been able to increase their margins.
b) OECD's indicators of agricultural support The idea that consumers are deprived from their 'right' to pay their food at the world prices is all the less founded that: 1) This world price is a dumping price, lower than the production cost of all countries. 2) The slump in world prices is generally not transmitted to consumers. 3) The drop in domestic agricultural prices is even less transmitted, as the experience has shown in the EU and US, where farmers sell rarely directly to consumers but mainly to agri-food companies which have been able to increase their margins.
 Coupled or trade-distorting support For the free-traders, any support linked to the level") c) Coupled or trade-distorting support For the free-traders, any support linked to the level of price or production of the current year is a coupled support. Therefore coupled supports group together: 1) The border supports: import protection and export subsidies. 2) The domestic coupled supports: administered (or intervention) prices triggering public purchases and stocks; subsidies linked to production or prices (e. g. : marketing loans in the US) and subsidies on inputs and investment.
c) Coupled or trade-distorting support For the free-traders, any support linked to the level of price or production of the current year is a coupled support. Therefore coupled supports group together: 1) The border supports: import protection and export subsidies. 2) The domestic coupled supports: administered (or intervention) prices triggering public purchases and stocks; subsidies linked to production or prices (e. g. : marketing loans in the US) and subsidies on inputs and investment.
 The hierarchy of boxes at the WTO There is a hierarchy of supports") d) The hierarchy of boxes at the WTO There is a hierarchy of supports according to their degree of 'trade-distortion' or coupling to the production or price of the current year 1) red box: a) forbidden import supports other than tariffs b) coupled border supports: tariffs and export subsidies 2) amber box: domestic supports coupled to the current price or production levels 3) blue box: partially decoupled fixed domestic subsidies 4) green box: allegedly fully decoupled domestic subsidies 5) gold box ignored by the WTO: non agricultural subsidies
d) The hierarchy of boxes at the WTO There is a hierarchy of supports according to their degree of 'trade-distortion' or coupling to the production or price of the current year 1) red box: a) forbidden import supports other than tariffs b) coupled border supports: tariffs and export subsidies 2) amber box: domestic supports coupled to the current price or production levels 3) blue box: partially decoupled fixed domestic subsidies 4) green box: allegedly fully decoupled domestic subsidies 5) gold box ignored by the WTO: non agricultural subsidies
 Forbidden supports: import protection other") The red box of forbidden and border supports 1) Forbidden supports: import protection other than tariffs: quotas, variable levies… 2) Coupled border supports*: - import protection - export subsidies * most people put them in the amber box
The red box of forbidden and border supports 1) Forbidden supports: import protection other than tariffs: quotas, variable levies… 2) Coupled border supports*: - import protection - export subsidies * most people put them in the amber box
 de minimis: as long as supports") The amber box of domestic coupled supports 3) de minimis: as long as supports remain lower than 5% of the production value (10% for DCs), they are not taken into account in the productspecific AMSs and the non product-specific AMS 1) Product specific supports: - market price support linked to administered prices: they are meaningless ! - subsidies to production or prices 2) Non product specific subsidies: subsidies on inputs (feedstuffs, credit, insurances, irrigation…) and on investment of farmers and agri-food industries
The amber box of domestic coupled supports 3) de minimis: as long as supports remain lower than 5% of the production value (10% for DCs), they are not taken into account in the productspecific AMSs and the non product-specific AMS 1) Product specific supports: - market price support linked to administered prices: they are meaningless ! - subsidies to production or prices 2) Non product specific subsidies: subsidies on inputs (feedstuffs, credit, insurances, irrigation…) and on investment of farmers and agri-food industries
 Why product-specific AMSs linked to administered prices are meaningless Product-specific market price supports linked to administered prices such as the EU's intervention prices account for 90% of its total AMS in 1995 -2000 and 86. 2% in 2001 -04. However they would not have had any impact on domestic prices without coexisting with much more determining market prices supports such as import protection, export subsidies, production quotas, set aside and foreign and domestic food aid.
 Why product-specific AMSs linked to administered prices are meaningless The product-specific AMS linked to an administered price (intervention price in the EU) is computed as the gap between the present administered price and the world reference price of the 1986 -88 base period, gap multiplied by the present production. As long as this administered price does not change, neither the AMS does, although the actual price support changes (through other measures) since the world price is always changing. The AMS linked to an administered price is therefore like a thermometer remaining fixed despite the temperature variations.
 Why product-specific AMSs linked to administered prices are meaningless The 1 st July 2002 the EU has eliminated its intervention price on bovine meat (BM), reducing from one day to the other its BM AMS by € 9. 7 billion and its total AMS by 30%, without any change in the domestic price nor in the farmers' income since the 1999 CAP reform had increased largely their direct payments. And, as there is no longer any BM AMS, this elimination has opened a de minimis allowed support of € 1. 021 billion (5% of the BM production value). What is presented as a cut in domestic support ends up as an increase!
 The blue box of fixed partially decoupled subsidies Subsidies based on programmes limiting production and: 1) Either on fixed areas and yields 2) Or on at most 85% of the production 3)level of the base period 4)3) Or on fixed bovine heads
 Definition of the blue box: Ao. A article 6. 5 " (a) Direct payments under production-limiting programmes shall not be subject to the commitment to reduce domestic support if: (i) such payments are based on fixed area and yields; or (ii) such payments are made on 85 per cent or less of the base level of production; or (iii) livestock payments are made on a fixed number of head. (b) The exemption from the reduction commitment for direct payments meeting the above criteria shall be reflected by the exclusion of the value of those direct payments in a Member's calculation of its Current Total AMS" (Ao. A article 6. 5).
 The green box of fully decoupled subsidies Subsidies supposedly without any effect on prices or production or a minimal one 1) Fully decoupled payments, without obligation for farmers to produce 2) Agri-environmental payments 3) Subsidies to farmers in deprived areas 4) Subsidies for natural disasters
 The gold box ignored by WTO: non agricultural sub The higher present competitiveness of the North stems more from the past agricultural and non agricultural high import protection and subsidies than from the present agricultural subsidies alone It contains all present and past nonagricultural subsidies: - efficient transport and communication infrastructures - general education and research - health and pensions of farmers financed by the nation - wealthy consumers able to pay fair prices for their agri-food products, etc.
 Reductions of support according to countries c") e) Reductions of support according to countries c
e) Reductions of support according to countries c
 Overwhelming domination of Western countries for the various types of agricultural supports
 That typology of boxes is theoretically mystifying and politically a major swindle a)") 2) That typology of boxes is theoretically mystifying and politically a major swindle a) False conception – much too restrictive – of what protection actually means b) Scandalous definition of dumping by the GATT c) The WTO Appellate Body's precedents reconsidering the GATT definition of dumping d) Why import protection is the least protectionist type of agricultural support e) The import protection of basic food products is higher in the more industrialised countries f) Comparison of tariffs in the EU and in WAEMU for its most sensitive products
2) That typology of boxes is theoretically mystifying and politically a major swindle a) False conception – much too restrictive – of what protection actually means b) Scandalous definition of dumping by the GATT c) The WTO Appellate Body's precedents reconsidering the GATT definition of dumping d) Why import protection is the least protectionist type of agricultural support e) The import protection of basic food products is higher in the more industrialised countries f) Comparison of tariffs in the EU and in WAEMU for its most sensitive products
 False conception – much too restrictive – of what protection actually means For") a) False conception – much too restrictive – of what protection actually means For economists, any government measure which increases the competitiveness of national products relatively to foreign products is a form of protection
a) False conception – much too restrictive – of what protection actually means For economists, any government measure which increases the competitiveness of national products relatively to foreign products is a form of protection
 The scandalous definition of dumping by the GATT and the Ao. A For") b) The scandalous definition of dumping by the GATT and the Ao. A For economists and the man in the street there is dumping if exports are made at a price lower than the average production cost of the exporting country For the GATT and the Ao. A, there is no dumping as long as exports are made at the domestic price, even if it is lower than the average production cost
b) The scandalous definition of dumping by the GATT and the Ao. A For economists and the man in the street there is dumping if exports are made at a price lower than the average production cost of the exporting country For the GATT and the Ao. A, there is no dumping as long as exports are made at the domestic price, even if it is lower than the average production cost
 The scandalous definition of dumping by the GATT and the Ao. A Exporting at a price lower than the domestic price is only possible in rich countries where farmers are receiving direct payments authorized by the WTO to complement their low prices This has been the main reason of the CAP reforms in 1992, 1999 and 2003 -04: reducing by steps agricultural prices to the world price level will allow to export EU's agricultural products without export subsidies
 The scandalous definition of dumping by the GATT and the Ao. A This definition of dumping has also been the main reason of the US Farm Bill in 1996 and 2002: as the world prices of grains are aligned on the US FOB prices (at the border), reducing the later was a means to reduce the former so as to eliminate the US competing exporters, unable to compensate their farmers through domestic subsidies as the US was able to do without using specific export subsidies.
 WTO Appellate Body's precedents are reconsidering the GATT definition of dumping In the") c) WTO Appellate Body's precedents are reconsidering the GATT definition of dumping In the "Dairy products of Canada" case, the WTO Appellate Body has ruled the 3 December 2001 that dumping should take into account all domestic subsidies to exported products: "The distinction between the domestic support and export subsidies disciplines in the Agreement on Agriculture would also be eroded if a WTO Member were entitled to use domestic support, without limit, to provide support for exports of agricultural products (paragraph 91)…The potential for WTO Members to export their agricultural production is preserved, provided that any export-destined sales by a producer at below the total cost of production are not financed by virtue of governmental action (par. 92)".
c) WTO Appellate Body's precedents are reconsidering the GATT definition of dumping In the "Dairy products of Canada" case, the WTO Appellate Body has ruled the 3 December 2001 that dumping should take into account all domestic subsidies to exported products: "The distinction between the domestic support and export subsidies disciplines in the Agreement on Agriculture would also be eroded if a WTO Member were entitled to use domestic support, without limit, to provide support for exports of agricultural products (paragraph 91)…The potential for WTO Members to export their agricultural production is preserved, provided that any export-destined sales by a producer at below the total cost of production are not financed by virtue of governmental action (par. 92)".
 WTO Appellate Body's precedents are reconsidering the GATT definition of dumping The Appellate") c) WTO Appellate Body's precedents are reconsidering the GATT definition of dumping The Appellate Body has confirmed the 20 -12 -02 in the same case: "If governmental action in support of the domestic market could be applied to subsidize export sales, without respecting the commitments Members made to limit the level of export subsidies, the value of these commitments would be undermined. Article 9. 1(c) addresses this possibility by bringing, in some circumstances, governmental action in the domestic market within the scope of the "export subsidies" disciplines of Article 3. 3 " (paragraph 148). This precedent has been confirmed in the Appellate Body's rulings on cotton (03 -03 -05) and sugar (28 -04 -05).
c) WTO Appellate Body's precedents are reconsidering the GATT definition of dumping The Appellate Body has confirmed the 20 -12 -02 in the same case: "If governmental action in support of the domestic market could be applied to subsidize export sales, without respecting the commitments Members made to limit the level of export subsidies, the value of these commitments would be undermined. Article 9. 1(c) addresses this possibility by bringing, in some circumstances, governmental action in the domestic market within the scope of the "export subsidies" disciplines of Article 3. 3 " (paragraph 148). This precedent has been confirmed in the Appellate Body's rulings on cotton (03 -03 -05) and sugar (28 -04 -05).
 3 other types of dumping might be considered Besides the normal commercial type of dumping, 3 other types are worth considering as they reduce the price of the agricultural products traded domestically or exported. They may be identified in 3 new boxes. The brown box of social dumping The purple box of environnemental dumping The white box of monetary dumping
 The brown box of social dumping It includes the violation of the basic human rights and of the 4 basic labour rights on: child labour, forced labour (particularly in prison), interdiction of trade-union and collective bargaining, and gender discrimination. The issue of social (and environmental) dumping is politically very sensitive as DCs have some good reasons to denounce it as another means for developed countries to hide their protectionist interests. Furthermore they do not comply themselves with their own labour laws particularly for migrant workers in agriculture. If DCs' compliance with these labour rights is in their own interests, their difficulty to comply with them, particularly on child labour, can also be explained partially by the impoverishment of farmers due to the low agricultural prices resulting from the Ao. A and the high Northern dumping.
 The purple box of environnemental dumping Here also the overexploitation of the soils in DCs is largely due to the impoverishment of farmers facing too low prices and unable to use farming systems improving soil fertility. Yet, as for social dumping, we should differentiate between LDCs and advanced DCs such as Brazil where the exploitation of the environment and agricultural workers, even slave labour, does not result from a lack of lands and capital but from a high inequality in their distribution. And this social-ecological overexploitation is mainly due to large agribusiness farms and foreign corporations for exports. Here again the North's ecological dumping is higher, particularly for global warming which will be more harmful to DC. One of the reasons of the US low agricultural prices comes from an oil price 3 times lower than in the EU, so that with 4. 5% of world population, they are emitting 25% of the GHG.
 The white box of monetary dumping Here again the monetary dumping is mainly practiced by the US given the hegemonical position of the dollar allowing this country not to be penalized by the $ depreciation since it can borrow in its own currency, in which most agricultural products and raw materials are also sold on the world market. If the $ depreciation helps also many DCs whose currency is pegged to the $, such as China, the US is not the best placed to criticize them. On the other hand the fact that French speaking ACPs with CFA francs are suffering a lot from the € appreciation vis-àvis the $ is largely due to the absurd monetary policy of the European Central Bank, only concerned with inflation but does not care about the loss of competitiveness of the EU firms, even less of the CFA zone (namely for cotton).
 Why import protection is the least protectionist type of agricultural support") d) Why import protection is the least protectionist type of agricultural support "Free-trade is not anti-protectionism. It is the protectionism of the mighty" (Vandana Shiva, 1997)
d) Why import protection is the least protectionist type of agricultural support "Free-trade is not anti-protectionism. It is the protectionism of the mighty" (Vandana Shiva, 1997)
 Why import protection is the least protectionist type of agricultural support Import protection") d) Why import protection is the least protectionist type of agricultural support Import protection is the only support affordable to poor countries, which do not have the means to subsidize significantly their farmers, the more so as their represent generally the majority of the active population (2/3 in Sub-Saharan Africa)
d) Why import protection is the least protectionist type of agricultural support Import protection is the only support affordable to poor countries, which do not have the means to subsidize significantly their farmers, the more so as their represent generally the majority of the active population (2/3 in Sub-Saharan Africa)
 Why import protection is the least protectionist type of agricultural support All types") d) Why import protection is the least protectionist type of agricultural support All types of subsidies, even those of the green box aimed at protecting the environment, are reducing the production cost and have a dumping effect when the products are exported
d) Why import protection is the least protectionist type of agricultural support All types of subsidies, even those of the green box aimed at protecting the environment, are reducing the production cost and have a dumping effect when the products are exported
 Why import protection is the least protectionist type of agricultural support Only rich") d) Why import protection is the least protectionist type of agricultural support Only rich countries can use subsidies to protect their domestic market from imports without using specific measures at the import level: by compensating through allowed blue and green subsidies the reduction of domestic prices down to the world price level, the agri-food corporations have no longer any incentive to import.
d) Why import protection is the least protectionist type of agricultural support Only rich countries can use subsidies to protect their domestic market from imports without using specific measures at the import level: by compensating through allowed blue and green subsidies the reduction of domestic prices down to the world price level, the agri-food corporations have no longer any incentive to import.
 Why import protection is the least protectionist type of agricultural support Due to") d) Why import protection is the least protectionist type of agricultural support Due to their limited budget, DCs prioritize coupled supports which have a more direct effect on the production and price levels Coupled supports may maintain domestic prices above world prices and do not imply that the country is exporting, but the blue and green subsidies allow to reduce the domestic prices below the national average production cost and have a dumping effect if the products are exported
d) Why import protection is the least protectionist type of agricultural support Due to their limited budget, DCs prioritize coupled supports which have a more direct effect on the production and price levels Coupled supports may maintain domestic prices above world prices and do not imply that the country is exporting, but the blue and green subsidies allow to reduce the domestic prices below the national average production cost and have a dumping effect if the products are exported
 Why import protection is the least protectionist type of agricultural support Decoupled subsidies") d) Why import protection is the least protectionist type of agricultural support Decoupled subsidies of the green box being authorized without any limit, they are even more protectionist than export subsidies, more transparent and permitting antidumping measures or countervailing duties when they exceed the allowed ceiling
d) Why import protection is the least protectionist type of agricultural support Decoupled subsidies of the green box being authorized without any limit, they are even more protectionist than export subsidies, more transparent and permitting antidumping measures or countervailing duties when they exceed the allowed ceiling
 Why import protection is the least protectionist type of agricultural support Even export") d) Why import protection is the least protectionist type of agricultural support Even export subsidies would not be a real issue if every country could protect itself at the import level. However, given that most DCs cannot increase their import protection as a result of the insuperable IMF and WB pressures, eliminating explicit and indirect export subsidies remain a priority
d) Why import protection is the least protectionist type of agricultural support Even export subsidies would not be a real issue if every country could protect itself at the import level. However, given that most DCs cannot increase their import protection as a result of the insuperable IMF and WB pressures, eliminating explicit and indirect export subsidies remain a priority
 Why import protection is the least protectionist type of agricultural support Import protection") d) Why import protection is the least protectionist type of agricultural support Import protection is the only means to rebuild market oriented agricultural policies, where the bulk of agricultural income is based on remunerative prices, but on domestic prices, not on the highly volatile and dumped world prices which are below the average production cost of all countries
d) Why import protection is the least protectionist type of agricultural support Import protection is the only means to rebuild market oriented agricultural policies, where the bulk of agricultural income is based on remunerative prices, but on domestic prices, not on the highly volatile and dumped world prices which are below the average production cost of all countries
 The import protection of agricultural products is higher in the more industrialised countries") e) The import protection of agricultural products is higher in the more industrialised countries 1) The example of the 19 th century Europe 2) The example of emerging countries, notably South Korea up to now, Brazil up to the early 90 s and India up to the end 90 s 3) The opposite example of Sub-Saharan Africa where the per capita GDP has fallen by 13% from 1980 to 2002 and even more for farmers
e) The import protection of agricultural products is higher in the more industrialised countries 1) The example of the 19 th century Europe 2) The example of emerging countries, notably South Korea up to now, Brazil up to the early 90 s and India up to the end 90 s 3) The opposite example of Sub-Saharan Africa where the per capita GDP has fallen by 13% from 1980 to 2002 and even more for farmers
 The import protection of basic food products is higher in the more industrialised") e) The import protection of basic food products is higher in the more industrialised countries 4) Import protection remains, after the Ao. A implementation, much higher on basic food products in Western countries than in developing countries 5) The average applied agricultural tariff of LDCs (16%) is lower than that of all DCs (20%) 6) Western countries have cheated in the conversion to tariffs of their import measures ('dirty tariffication') and have kept for themselves the Special safeguard clause
e) The import protection of basic food products is higher in the more industrialised countries 4) Import protection remains, after the Ao. A implementation, much higher on basic food products in Western countries than in developing countries 5) The average applied agricultural tariff of LDCs (16%) is lower than that of all DCs (20%) 6) Western countries have cheated in the conversion to tariffs of their import measures ('dirty tariffication') and have kept for themselves the Special safeguard clause
 Comparison of tariffs in the EU and in WAEMU for its most sensitive") f) Comparison of tariffs in the EU and in WAEMU for its most sensitive products The WAEMU (UEMOA) considers as its most sensitive products, those benefiting from the TCI (import tax linked to the economic climate): bovine meat, condensed milk, rice, wheat flour, sugar, crude and refined vegetal oil It is useful to compare the present levels of tariffs on these products in the EU and UEMOA. The first graph shows the average applied EU and UEMOA tariffs per broad group of products and the second is per restricted groups. Besides some EU tariffs lines exceed 100%: 14 for meat, 9 for dairy, 33 for beverage & tobacco and 15 for other products. Some tariffs exceed even 250% (third slide).
f) Comparison of tariffs in the EU and in WAEMU for its most sensitive products The WAEMU (UEMOA) considers as its most sensitive products, those benefiting from the TCI (import tax linked to the economic climate): bovine meat, condensed milk, rice, wheat flour, sugar, crude and refined vegetal oil It is useful to compare the present levels of tariffs on these products in the EU and UEMOA. The first graph shows the average applied EU and UEMOA tariffs per broad group of products and the second is per restricted groups. Besides some EU tariffs lines exceed 100%: 14 for meat, 9 for dairy, 33 for beverage & tobacco and 15 for other products. Some tariffs exceed even 250% (third slide).
 Comparison of the UEMOA CET and EU tariff
 Comparison of tariffs in the EU and in WAEMU for its most sensitive") f) Comparison of tariffs in the EU and in WAEMU for its most sensitive products We see that, except for refined vegetal oil, as a result of duty free imports of oilseeds since 1962 under the US pressure, the EU non preferential (MFN) tariffs are 3 to 19 times higher than the WAEMU's ones on basic staples.
f) Comparison of tariffs in the EU and in WAEMU for its most sensitive products We see that, except for refined vegetal oil, as a result of duty free imports of oilseeds since 1962 under the US pressure, the EU non preferential (MFN) tariffs are 3 to 19 times higher than the WAEMU's ones on basic staples.
 EU applied tariff structure distribution according to HS Chapters Source: FAO according to ICONE, ftp: //ftp. fao. org/docrep/fao/007/j 4019 e 01. pdf
 Structure of applied tariffs at the start of the DR negotiations, in ad valorem percent Source: OMC: le sens de la formule, La lettre du CEPII, Février 2006 For CEPII, if the average applied agricultural tariffs are close among the developed countries, DCs and LDCs, around 16 -20%, the bound tariffs reach 100% in the LDCs, 50% in the DCs and 25% in the developed countries.
 The lack of control by the WTO has allowed the EU and the") 3) The lack of control by the WTO has allowed the EU and the US to cheat massively a) Cheatings on input subsidies b) Cheatings on investment subsidies c) Cheatings on export subsidies d) The WTO does not check the veracity of its Members' notifications
3) The lack of control by the WTO has allowed the EU and the US to cheat massively a) Cheatings on input subsidies b) Cheatings on investment subsidies c) Cheatings on export subsidies d) The WTO does not check the veracity of its Members' notifications
 The EU and US massive b) cheatings on their input subsidies The Ao.") a) The EU and US massive b) cheatings on their input subsidies The Ao. A states first that input subsidies are coupled for developed countries (Art. 6. 2) before stating that the fixed payments of the blue box are exempted from reduction (Art. 6. 5). About 60% of the production of COP (cereals, oilseeds, pulses) in the EU and US are fed to animals, hence are inputs for animal products. Therefore 60% of direct payments are coupled and subject to reductions but neither the EU nor the US have notified them in the amber box.
a) The EU and US massive b) cheatings on their input subsidies The Ao. A states first that input subsidies are coupled for developed countries (Art. 6. 2) before stating that the fixed payments of the blue box are exempted from reduction (Art. 6. 5). About 60% of the production of COP (cereals, oilseeds, pulses) in the EU and US are fed to animals, hence are inputs for animal products. Therefore 60% of direct payments are coupled and subject to reductions but neither the EU nor the US have notified them in the amber box.
 The EU and US massive cheatings on their subsidies to feedstuffs That has represented € 68. 6 billion in under-notifications in the EU amber box (AMS), close to half the subsidies of its blue box from 1995 -96 to 2001 -02!
 The EU massive cheatings on its subsidies to feedstuffs The CAP reform of June 2003, which has supposedly transfer about 85% of direct payments to COP from the blue box to the green box ('single payment scheme') will not change their status of input subsidies to be put in the amber box, as long as 60% of COP will still be fed to EU animals
 The US massive cheatings on its feedstuffs subsidies On average, from 2001 to 2005, 56. 8% of the US feed cereals (corn, sorghum, barley, oats), i. e. 158. 8 Mt, have been used as feed in the US + 8. 8% of wheat (4. 8 Mt) + 83. 8% of soybean meals (149 Mt) + 155 Mt of hay. These feeds have got average yearly subsidies of $4. 522 bn in the 1995 -00 period, $7. 520 bn in 1999 -01 and $4. 486 in 2001 -05. Therefore a parallel proportion of "Production flexibility contract" (PFC) payments (from 1996 to 2002) and of "direct payments" since 2002 should have been notified in the amber box (in the product-specific AMS of the animal products having consumed these feeds) but they have been notified fully in the green box !
 The EU and US massive cheatings on their subsidies to other inputs Irrigation subsidies 1) The US has notified $300 -380 million a year 2) but the actual figure exceeds surely $2 billion. 2) The EU does notify any although they are at least of € 1. 2 bn (large in Spain & Italy). Subsidies to agricultural insurances 1) The US has under-notified them by 2) an average $813 M from 1995 to 2001. 3) 2) The EU has notified them by € 21 -102 M, 4) but they are at least € 500 million higher.
 The EU and US massive cheatings on their subsidies to other inputs Interest rates rebates on agricultural loans 1) The US has notified $49 M yearly to WTO but $561 M more to OECD 2) The EU has notified for 1998 Ecu 312. 5 M but have reached Ecus 360 M in France alone Taxes rebates on agricultural fuel 1) The US has notified to OECD $2. 3 bn per year but 0 to the WTO, not even in green box 2) The EU does notify any to the WTO but they have been of at least € 2 bn
 The EU massive cheatings on its subsidies to agricultural investments The EU has") b) The EU massive cheatings on its subsidies to agricultural investments The EU has notified in the green box € 5. 638 billion on average in the 1995 -00 period, hence € 33. 828 billion in total, in investments subsidies of farmers, agri-food industries and marketing. Thus violating Ao. A's articles 6. 2, paragraph 4 of Annexe 4 and paragraph 13 of Annexe 3.
b) The EU massive cheatings on its subsidies to agricultural investments The EU has notified in the green box € 5. 638 billion on average in the 1995 -00 period, hence € 33. 828 billion in total, in investments subsidies of farmers, agri-food industries and marketing. Thus violating Ao. A's articles 6. 2, paragraph 4 of Annexe 4 and paragraph 13 of Annexe 3.
 The EU massive cheatings on its export subsidies: cereals The EU claims to") c) The EU massive cheatings on its export subsidies: cereals The EU claims to have reduced sharply its export subsidies, fallen from Ecus 9. 5 billion in 1992 to € 3. 4 billion in 2002 and, for cereals, from Ecus 2. 16 billion to € 121 M. However, taking into account blue direct payments to exported cereals, which have skyrocketed from Ecus 117 M in 1992 to € 1. 28 billion in 2002, and given the halving of exports (from 36. 4 to 18. 4 M tonnes), the total subsidy per exported tonne has increased by 20% (from Ecus 62. 5 to € 75. 1)
c) The EU massive cheatings on its export subsidies: cereals The EU claims to have reduced sharply its export subsidies, fallen from Ecus 9. 5 billion in 1992 to € 3. 4 billion in 2002 and, for cereals, from Ecus 2. 16 billion to € 121 M. However, taking into account blue direct payments to exported cereals, which have skyrocketed from Ecus 117 M in 1992 to € 1. 28 billion in 2002, and given the halving of exports (from 36. 4 to 18. 4 M tonnes), the total subsidy per exported tonne has increased by 20% (from Ecus 62. 5 to € 75. 1)
 The EU massive cheatings on its export subsidies: poultry The EU has granted on average € 329 million in total subsidies to poultry meat exports from 1995 to 2001 for 1. 011 million tonnes, or € 325 per tonne, of which € 243 in domestic subsidies (mainly to feed) which have been 3 times larger than the € 83 million in export refunds. Comparing these € 329 million to the € 1. 043 billion in export value gives a dumping rate of 24%: 329/(329+1, 043).
 The EU massive cheatings on its export subsidies: pork Total subsidies on pig meat exports (export refunds + domestic subsidies to exports) have reached an average of € 316. 0 million from 1995 to 2001, of which € 188. 2 million in domestic subsidies, 47% more than the € 127. 8 million in export refunds. Comparing with the export value of € 2. 243 billion, the implied dumping rate has been of 12. 3%.
 The EU massive cheatings on its export subsidies: dairy Even though refunds on dairy products exports have remained considerable, the domestic subsidies to the exported dairy products have nevertheless represented 38. 2% of total subsidies or 61. 7% of the refunds over 1995 -2001, giving an average dumping rate of 33. 3%
 The EU massive cheatings on its export subsidies: beef It is bovine meat which has had the highest dumping rate – 63. 7% on average from 1996 to 2002 – since the total subsidies to the exported bovine meat have exceeded by 75. 1% its export value, the domestic subsidies to this exported meat having exceeded the export refunds by 9. 2%
 The US massive cheatings on its export subsidies According to IATP, the average dumping rate from 1997 to 2003 has been of 11. 8% on soybean, 19. 2% on corn and rice, 37% on wheat and 48. 4% on cotton. As the intensification of cattle production systems is higher in the US to that in the EU (higher dependency from grains than from grass) for bovine meat and milk, the dumping rate is close to that of the EU, even if export subsidies are low (some for dairy products).
 The WTO does not check the veracity of its Members' notifications Having asked") d) The WTO does not check the veracity of its Members' notifications Having asked the WTO on this issue, Gabrielle Marceau, of the Dispute Settlement Body, replied: "The WTO has neither the resources nor the skills to act like "a regulator" of these notifications. It is up to each Member to do these verifications… This is the very spirit of the whole disputes settlement system of the WTO: every Member country acts as a guarddog of the system" (Answer on an internet forum the 27 -02 -2001). Haïti guard-dog of the US and Niger guard-dog of the EU?
d) The WTO does not check the veracity of its Members' notifications Having asked the WTO on this issue, Gabrielle Marceau, of the Dispute Settlement Body, replied: "The WTO has neither the resources nor the skills to act like "a regulator" of these notifications. It is up to each Member to do these verifications… This is the very spirit of the whole disputes settlement system of the WTO: every Member country acts as a guarddog of the system" (Answer on an internet forum the 27 -02 -2001). Haïti guard-dog of the US and Niger guard-dog of the EU?
 Why the EU's blue box's direct payments are coupled and should be in") 4) Why the EU's blue box's direct payments are coupled and should be in the amber box The Ao. A's Article 6. 5 is inconsistent twice: a) Because any measure limiting production is clearly coupled to production and price b) The criteria of Article 6. 5 (payments based on fixed areas and yields or on fixed heads of cattle) cannot limit production. The only means to do it is to impose production quotas and deterrent penalties for any excess, as in the EU common market organisation for dairy quotas.
4) Why the EU's blue box's direct payments are coupled and should be in the amber box The Ao. A's Article 6. 5 is inconsistent twice: a) Because any measure limiting production is clearly coupled to production and price b) The criteria of Article 6. 5 (payments based on fixed areas and yields or on fixed heads of cattle) cannot limit production. The only means to do it is to impose production quotas and deterrent penalties for any excess, as in the EU common market organisation for dairy quotas.
 Why the EU's blue box direct payments are coupled and should be in the amber box The huge increase of the EU's blue direct payments from 1992 to 2004 contradicts radically the Ao. A aim to fix them over time, although they were based on fixed production factors. From 2005 we see a dairy premium and an increased shift of the blue box to the green box due to the 2003 CAP reform.
 Why the EU's blue box direct payments are coupled and should be in the amber box Granting blue payments on the basis of fixed areas and yields did not prevent the EU to increase them per tonne of cereals from € 54. 34 (from 1995 to 1999) to € 63 since July 2001, as a result of the 1999 CAP reform This increase has fostered a 11. 9% rise in the EU-15's production of cereals from 181 Mt in 1992 to 215 Mt in 2002, the yield having increased by 1 tonne (from 4. 72 to 5. 67 t/ha).
 Why the EU's blue box's direct payments are coupled and should be in the amber box Direct payments to producers of bovine meat (BM) have increased even more: although based on the 1992 number of cattle heads, the rate of payment has jumped after the 1999 CAP reform and new subsidies were added (extensification premium and slaughter premium). However these larger subsidies were not enough to raise the production because of other brakes, and first dairy quotas: 60% of the EU's bovine meat come from dairy cows but the yearly increased yield of 70 kg of milk per cow reduces the number of cows, hence the production of BM.
 Why the EU's blue box's direct payments are coupled and should be in the amber box As seen already, as long as the EU's farmers will continue to grow COPs fed to animals within the EU, the corresponding direct payments will remain coupled input subsidies. The coexistence of blue payments with the alleged green "single payment scheme" (SPS) will couple them since the EU farmers are allowed to produce as much as they want for the products without caps, e. g. to increase COP and bovine meat, thus defeating the basic condition that these payments are "under production-limiting programmes".
 of the new CAP is coupled The EU") Why the 'single payment scheme' (SPS) of the new CAP is coupled The EU has reformed its CAP in 2003 to transfer its blue box direct payments – that Ao. A's Article 13 will no longer protect from prosecutions at the WTO in 2004 – to the green box by not requiring that farmers have to produce to get them. But the SPS is coupled since it does not abide by the Ao. A's rules: 1) it is based on the amount of subsidies received from 2000 to 2002, a criterion not mentioned; 2) it remains coupled to eligible hectares; 3) many productions are forbidden; 4) 60% of COP are still fed to animal so that the SFP contains large input subsidies.
Why the 'single payment scheme' (SPS) of the new CAP is coupled The EU has reformed its CAP in 2003 to transfer its blue box direct payments – that Ao. A's Article 13 will no longer protect from prosecutions at the WTO in 2004 – to the green box by not requiring that farmers have to produce to get them. But the SPS is coupled since it does not abide by the Ao. A's rules: 1) it is based on the amount of subsidies received from 2000 to 2002, a criterion not mentioned; 2) it remains coupled to eligible hectares; 3) many productions are forbidden; 4) 60% of COP are still fed to animal so that the SFP contains large input subsidies.
 of the new CAP is in the amber") Why the 'single payment scheme' (SPS) of the new CAP is in the amber box The WTO has ruled the 3 March 2005 that US "direct payments" to cotton producers are in the amber box because they cannot grow fruits and vegetables and wild rice The EU SPS would be even more put in the amber box as much more productions are forbidden – fruits & vegetables, milk and sugar beet if they do not have quotas) – or capped (cotton, tobacco, olive oil, some wines), contradicting the condition "b". All the EU exported products could be sued for dumping since the SPS lowers their price below the EU average production cost
Why the 'single payment scheme' (SPS) of the new CAP is in the amber box The WTO has ruled the 3 March 2005 that US "direct payments" to cotton producers are in the amber box because they cannot grow fruits and vegetables and wild rice The EU SPS would be even more put in the amber box as much more productions are forbidden – fruits & vegetables, milk and sugar beet if they do not have quotas) – or capped (cotton, tobacco, olive oil, some wines), contradicting the condition "b". All the EU exported products could be sued for dumping since the SPS lowers their price below the EU average production cost
 The main stages") III – Strategy of the main groups of WTO Members 1) The main stages of the agricultural negotiations 2) The EU and US strategy 3) The G-10 strategy 4) The Cairns Group strategy 5) The common positions of G-20, G-33 and G-90 6) The G-20 strategy 7) The G-33 strategy 8) The G-90 strategy 9) The EU and US new offensive since Cancun
III – Strategy of the main groups of WTO Members 1) The main stages of the agricultural negotiations 2) The EU and US strategy 3) The G-10 strategy 4) The Cairns Group strategy 5) The common positions of G-20, G-33 and G-90 6) The G-20 strategy 7) The G-33 strategy 8) The G-90 strategy 9) The EU and US new offensive since Cancun
 The main stages of the agricultural negotiations After the signature of the Doha") 1) The main stages of the agricultural negotiations After the signature of the Doha Round in September 2001, agricultural negotiations began in January 2002 in Geneva in the Special Committee on Agriculture but they have not made significant breakthroughs ever since. Because of the EU and US uncompromising demands that DCs open widely their domestic markets to EU and US exports of non agricultural products and services whilst the EU and US offers on agriculture were judged too low by DCs. 2002 was also the year in which the EU CAP reform of June 2003 was discussed and in which a new Farm Bill was adopted which increases much direct aids: the coupled "marketing loans", less coupled "countercyclical payments, and the decoupled "direct payments".
1) The main stages of the agricultural negotiations After the signature of the Doha Round in September 2001, agricultural negotiations began in January 2002 in Geneva in the Special Committee on Agriculture but they have not made significant breakthroughs ever since. Because of the EU and US uncompromising demands that DCs open widely their domestic markets to EU and US exports of non agricultural products and services whilst the EU and US offers on agriculture were judged too low by DCs. 2002 was also the year in which the EU CAP reform of June 2003 was discussed and in which a new Farm Bill was adopted which increases much direct aids: the coupled "marketing loans", less coupled "countercyclical payments, and the decoupled "direct payments".
 The main stages of the agricultural negotiations The Doha Round ag negotiations are focusing on the same 3 pillars as the Ao. A: domestic supports, export subsidies and market access. In fact the DR main stress has been put on market access not only by the US and Cairns Group but also, in an opposite sense, by the G-33 and G-90 which want to keep a high protection of their domestic market, a positionshared by the G-10 of developed countries. Just before the Cancun Ministerial the EU and US have circulated the 13 August 2003 a joint position on agriculture, hoping to impose it in the WTO agricultural negotiations in Cancun but the G-20 and G-33 have refused and circulated their own texts.
 The EU and US strategies They are using agriculture (increased access to their") 2) The EU and US strategies They are using agriculture (increased access to their markets, elimination of export subsidies, cut in their domestic trade-distorting supports) as a bargaining chip to pry open the DCs markets of non ag products and services. However their offers to reduce their domestic trade-distorting supports and export subsidies are loaded as they rest on massive cheatings with the WTO rules and case law, so that neither the EU nor the US could implement these offers. The most important is not that the EU and US would cut their actual domestic trade-distorting subsidies: they could use as many as they want as long as they would not export any product having received any subsidy, directly or indirectly (upstream and downstream the production level), including from the blue an green boxes.
2) The EU and US strategies They are using agriculture (increased access to their markets, elimination of export subsidies, cut in their domestic trade-distorting supports) as a bargaining chip to pry open the DCs markets of non ag products and services. However their offers to reduce their domestic trade-distorting supports and export subsidies are loaded as they rest on massive cheatings with the WTO rules and case law, so that neither the EU nor the US could implement these offers. The most important is not that the EU and US would cut their actual domestic trade-distorting subsidies: they could use as many as they want as long as they would not export any product having received any subsidy, directly or indirectly (upstream and downstream the production level), including from the blue an green boxes.
 The G-10 strategy Members: Bulgaria, Taipei, South Korea, Iceland, Israel, Japan, Liechtenstein, Mauritius,") 3) The G-10 strategy Members: Bulgaria, Taipei, South Korea, Iceland, Israel, Japan, Liechtenstein, Mauritius, Norway and Switzerland Group of mainly developed countries having the most defensive interest in agriculture because they are large net importers: although they represent only 4% of the world population they have a 13% share in world agricultural imports. They are against caps on tariffs, sensitive products, blue box and green box. It links the elimination of export subsidies to a final DR agreement with parallel openness in NAMA and services. The EU has long shared the G-10 firm positions on import protection but has been more flexible since Peter Mandelson has become the EU trade Commissioner.
3) The G-10 strategy Members: Bulgaria, Taipei, South Korea, Iceland, Israel, Japan, Liechtenstein, Mauritius, Norway and Switzerland Group of mainly developed countries having the most defensive interest in agriculture because they are large net importers: although they represent only 4% of the world population they have a 13% share in world agricultural imports. They are against caps on tariffs, sensitive products, blue box and green box. It links the elimination of export subsidies to a final DR agreement with parallel openness in NAMA and services. The EU has long shared the G-10 firm positions on import protection but has been more flexible since Peter Mandelson has become the EU trade Commissioner.
 The Cairns Group strategy Members: Argentina, Australia, Bolivia, Brazil, Canada, Chile, Colombia, Costa") 4) The Cairns Group strategy Members: Argentina, Australia, Bolivia, Brazil, Canada, Chile, Colombia, Costa Rica, Fiji, Guatemala, Indonesia, Malaysia, New Zealand, Paraguay, Philippines, South Africa, Thailand Uruguay (G-33 Members underlined). The Cairns Group is, with the US, the most offensive on agricultural market access. It wants to limit as much as possible the sensitive products, the Blue and Green boxes. Given that two Members are also in the G-33, it cannot be too offensive against the SPs & SSM. Since Cancun and the creation of the G-20 the Cairns Group has been less active in the negotiations but Brazil has been keen to organize meetings to pressure the G-20 to prioritize its offensive interests rather than its defensive ones.
4) The Cairns Group strategy Members: Argentina, Australia, Bolivia, Brazil, Canada, Chile, Colombia, Costa Rica, Fiji, Guatemala, Indonesia, Malaysia, New Zealand, Paraguay, Philippines, South Africa, Thailand Uruguay (G-33 Members underlined). The Cairns Group is, with the US, the most offensive on agricultural market access. It wants to limit as much as possible the sensitive products, the Blue and Green boxes. Given that two Members are also in the G-33, it cannot be too offensive against the SPs & SSM. Since Cancun and the creation of the G-20 the Cairns Group has been less active in the negotiations but Brazil has been keen to organize meetings to pressure the G-20 to prioritize its offensive interests rather than its defensive ones.
 The creation of DCs groupings before Cancun The failure of the WTO Ministerial") 5) The creation of DCs groupings before Cancun The failure of the WTO Ministerial conference in Cancun in September 2003 is less linked to the civil society mobilization as in Seattle (December 1999), despite the sacrifice of the Korean farmer Lee Kyung Hae, that to the end put to the domination of the QUAD (EU, US, Canada and Japan) over the WTO, owing to the creation of 3 DCs groupings – G-20, G-33 et G-90 –, based on the agriculture issue, which has remained central in the Doha Round negotiation ever since.
5) The creation of DCs groupings before Cancun The failure of the WTO Ministerial conference in Cancun in September 2003 is less linked to the civil society mobilization as in Seattle (December 1999), despite the sacrifice of the Korean farmer Lee Kyung Hae, that to the end put to the domination of the QUAD (EU, US, Canada and Japan) over the WTO, owing to the creation of 3 DCs groupings – G-20, G-33 et G-90 –, based on the agriculture issue, which has remained central in the Doha Round negotiation ever since.
 The common positions of the G-20, G-33 & G-90 They share the same objectives to pressure the developed countries to eliminate their agricultural trade distorting supports and export subsidies and to open largely their borders to DCs exports. They recognize the WTO legitimacy and its capacity to reach these objectives which, they think, would create the conditions to make true that the Doha Round would actually be the Development Round. Because they think that the WTO is the lesser evil, in the face of much higher risks linked to bilateral free-trade agreements with developed countries.
 The specific positions of each of the 3 "Gs" The 3 DCs' Gs are divided on the other agricultural issues, particularly on the degree of import protection that net food importing DCs could maintain.
 The G-20 strategy 22 G-20 Members (12 underlined also in G-33, 10 in") 6) The G-20 strategy 22 G-20 Members (12 underlined also in G-33, 10 in italics also in G-90): Argentina, Bolivia, Brazil, Chile, China, Cuba, Egypt, Guatemala, India, Indonesia, Mexico, Nigeria, Pakistan, Paraguay, Peru, South Africa, Tanzania, Thailand, Uruguay, Philippines, Venezuela, Zimbabwe. The G-20 is torn apart between the demand of its most competitive Members to extend agricultural trade liberalization as much as possible, including in DCs, and the demand of its less competitive Members, also in the G-33, to maintain a high import protection. China and India are the most torn apart on agriculture given their strong wish to export more industrial products (China) and services (India). Brazil is already (since 2004) exporting more agricultural products to DCs than to developed countries.
6) The G-20 strategy 22 G-20 Members (12 underlined also in G-33, 10 in italics also in G-90): Argentina, Bolivia, Brazil, Chile, China, Cuba, Egypt, Guatemala, India, Indonesia, Mexico, Nigeria, Pakistan, Paraguay, Peru, South Africa, Tanzania, Thailand, Uruguay, Philippines, Venezuela, Zimbabwe. The G-20 is torn apart between the demand of its most competitive Members to extend agricultural trade liberalization as much as possible, including in DCs, and the demand of its less competitive Members, also in the G-33, to maintain a high import protection. China and India are the most torn apart on agriculture given their strong wish to export more industrial products (China) and services (India). Brazil is already (since 2004) exporting more agricultural products to DCs than to developed countries.
 The G-20 challenges also the EU's non reciprocal preferences with ACPs This is because South-South agricultural exports in total agricultural exports have increased from 27. 5% in 1981 to 37% in 2001 and are progressing faster than the average, which is quite understandable as developed countries' population and per capita consumption are stagnating whereas they are increasing and will increase more in DCs. Indeed the world population would rise from 6. 6 billion inhabitants in 2006 to 9. 2 billion in 2050, all the rise occuring in DCs and Western countries stagnating at 1. 2 billion.
 The") The G-20 leadership over the G-33 and the G-90 Through five means: 1) The leadership of Brazil and India in the G-20 2) after Cancun when they have become Members 3) of the G-5 (with EU, US, Australia) or G-4 (without 4) Australia) for the leadership of the DR agenda. 2) The common preparation, at the Brazil's embassy to the WTO in Geneva, of the meetings of the Committee on agriculture in order that all its Members adopt common positions. 3) The G-20 has invited representatives of the G-33 and G-90 to its ministerial meetings.
The G-20 leadership over the G-33 and the G-90 Through five means: 1) The leadership of Brazil and India in the G-20 2) after Cancun when they have become Members 3) of the G-5 (with EU, US, Australia) or G-4 (without 4) Australia) for the leadership of the DR agenda. 2) The common preparation, at the Brazil's embassy to the WTO in Geneva, of the meetings of the Committee on agriculture in order that all its Members adopt common positions. 3) The G-20 has invited representatives of the G-33 and G-90 to its ministerial meetings.
 The G-20 has convinced") The G-20 leadership over the G-33 and the G-90 4) The G-20 has convinced the G-33 and G-90 to resist the EU and US pressures to discriminate between DCs – emerging DCs or poorer DCs – for the reduction rates on tariffs and subsidies. 5) The G-20 has brought together the G-33 & G-90 in the G-110 in the HK Ministerial in December 2005.
The G-20 leadership over the G-33 and the G-90 4) The G-20 has convinced the G-33 and G-90 to resist the EU and US pressures to discriminate between DCs – emerging DCs or poorer DCs – for the reduction rates on tariffs and subsidies. 5) The G-20 has brought together the G-33 & G-90 in the G-110 in the HK Ministerial in December 2005.
 The G-20 strategy Brazil and India seem to have understood that, to drag maximal concessions out of the EU and US, they had to proceed in 2 steps in order not to alarm the EU and US. 1) For the DR, limit their objectives at the elimination of developed countries' export subsidies (already decided in HK if the round is concluded) and significant cuts in the EU and US tariffs and domestic trade distorting supports. 2) Because they are confident that, after the ratification of the DR, and given the WTO Appellate Body's precedents, they will be able to sue with the best chance of success the coupled nature of the EU and US blue and green subsidies. And, as the EU and US have offered to cut their allowed amber box by 70% and 60%, this would increase much the G-20 competitiveness.
 Market access: the developed countries' tariffs") The G-20 positions for the DR negotiations 1) Market access: the developed countries' tariffs should 2) be reduced by 54% on average, those of DCs by 36% at 3) most. Tariffs should be capped at 100% for developed 4) countries and 150% for DCs. Minimal access at reduced 5) tariffs for at least 6% of domestic consumption. The 6) tariffs on the "sensible products" of developed 7) countries would not be reduced by more than 30% and 8) they would open additional tariff rate quotas (TRQs). 2) Domestic supports: cut the allowed total AMS of developed countries by 80% when it exceeds $25 bn (EU), by 70% between $15 and $25 bn (Japan, US) and 60% below. Their allowed TDS should be cut by 80% when it exceeds $60 bn (EU), 75% between $10 & $60 bn (Japan, US), 70% for others. DCs without notified AMS (only 13 have one, often nil) would not have to cut their TDS since they don't have de minimis supports.
The G-20 positions for the DR negotiations 1) Market access: the developed countries' tariffs should 2) be reduced by 54% on average, those of DCs by 36% at 3) most. Tariffs should be capped at 100% for developed 4) countries and 150% for DCs. Minimal access at reduced 5) tariffs for at least 6% of domestic consumption. The 6) tariffs on the "sensible products" of developed 7) countries would not be reduced by more than 30% and 8) they would open additional tariff rate quotas (TRQs). 2) Domestic supports: cut the allowed total AMS of developed countries by 80% when it exceeds $25 bn (EU), by 70% between $15 and $25 bn (Japan, US) and 60% below. Their allowed TDS should be cut by 80% when it exceeds $60 bn (EU), 75% between $10 & $60 bn (Japan, US), 70% for others. DCs without notified AMS (only 13 have one, often nil) would not have to cut their TDS since they don't have de minimis supports.
 The G-33 strategy 46 Members: Antigua & Barbuda, Barbados, Belize, Benin, Bolivia, Botswana,") 7) The G-33 strategy 46 Members: Antigua & Barbuda, Barbados, Belize, Benin, Bolivia, Botswana, China, Congo, Cote d'Ivoire, Cuba, Dominican Republic, El Salvador, Grenada, Guatemala, Guyana, Haiti, Honduras, India, Indonesia, Jamaica, Kenya, Korea, Mauritius, Madagascar, Mongolia, Mozambique, Nicaragua, Nigeria, Pakistan, Panama, Peru, Philippines, St Kitts and Nevis, St Lucia, St Vincent & Grenadines, Senegal, Sri Lanka, Suriname, Tanzania, Trinidad and Tobago, Turkey, Uganda, Venezuela, Zambia, Zimbabwe (underlined: also in G-20; italics: also in G-90).
7) The G-33 strategy 46 Members: Antigua & Barbuda, Barbados, Belize, Benin, Bolivia, Botswana, China, Congo, Cote d'Ivoire, Cuba, Dominican Republic, El Salvador, Grenada, Guatemala, Guyana, Haiti, Honduras, India, Indonesia, Jamaica, Kenya, Korea, Mauritius, Madagascar, Mongolia, Mozambique, Nicaragua, Nigeria, Pakistan, Panama, Peru, Philippines, St Kitts and Nevis, St Lucia, St Vincent & Grenadines, Senegal, Sri Lanka, Suriname, Tanzania, Trinidad and Tobago, Turkey, Uganda, Venezuela, Zambia, Zimbabwe (underlined: also in G-20; italics: also in G-90).
 The 23 June 2000 11 DCs have proposed at the") The Developement Box (DB) The 23 June 2000 11 DCs have proposed at the WTO to create a DB allowing DCs to: 1) declare for which ag products they agree reduction commitments (positive list); 2) raise their tariff bindings on key staple products; 3) increase their de minimis support to 20% of VAP. And developed countries should: 1) reduce their tariff peaks and escalation; 2) abandon the Special Safeguard Clause. To the contrary, it should be rendered more flexible and opened to all DCs; 3) eliminate all forms of direct and indirect dumping, including through domestic subsidies. This appeal has then been echoed by many NGOs (of which Oxfam, IATP, Action. Aid, Cafod, South Centre, Focus) which have argumented that the DB is intended only for low income/resource poor (LI/RP) farmers, which a 4 DCs' paper has endorsed in February 2002.
The Developement Box (DB) The 23 June 2000 11 DCs have proposed at the WTO to create a DB allowing DCs to: 1) declare for which ag products they agree reduction commitments (positive list); 2) raise their tariff bindings on key staple products; 3) increase their de minimis support to 20% of VAP. And developed countries should: 1) reduce their tariff peaks and escalation; 2) abandon the Special Safeguard Clause. To the contrary, it should be rendered more flexible and opened to all DCs; 3) eliminate all forms of direct and indirect dumping, including through domestic subsidies. This appeal has then been echoed by many NGOs (of which Oxfam, IATP, Action. Aid, Cafod, South Centre, Focus) which have argumented that the DB is intended only for low income/resource poor (LI/RP) farmers, which a 4 DCs' paper has endorsed in February 2002.
 The Developement Box Whatever the good intentions of the DCs and NGOs supporting the DB, it has important limits: 1) The DB is only a means of mitigating the harmful impact of Ao. A on LI/RP farmers without denouncing most of its basic flaws, beginning by its objective of "progressive and substantial reductions in support and protection" (article 20), endorsed by the DR Declaration. And particularly without denouncing the huge EU and US cheatings. 2) Most DB proponents do not care to eliminate the Northern farmers as they ask that "Developed countries should provide quota-free and tariff-free access to products from LI/RP farmers in developing countries" (4 DCs paper of Feb. 2002). Therefore they are far from advocating the Food Sovereignty without dumping principle for all countries (Via Campesina). Besides promoting increased market access to the North might marginalize Southern LI/RP farmers and consumers.
 The G-90 strategy 64 WTO Members of ACPs (56 on 79), LDCs (32") 8) The G-90 strategy 64 WTO Members of ACPs (56 on 79), LDCs (32 on 50) and the African Group (42 on 46), given a large overlap. 79 ACP (LDCs in italics, African Group underlined): Angola, Antigua and Barbuda, Belize, Cape Verde, Comoros, Bahamas, Barbados, Benin, Botswana, Burkina Faso, Burundi, Cameroon, Central African Republic, Chad, Congo (Brazzaville), Congo (Kinshasa), Cook Islands, Côte d'Ivoire, Cuba, Djibouti, Dominican Republic, Eritrea, Ethiopia, Fiji, Gabon, Gambia, Ghana, Grenada, Guinea-Bissau, Equatorial Guinea, Guyana, Haiti, Jamaica, Kenya, Kiribati, Lesotho, Liberia, Madagascar, Malawi, Mali, Marshall Islands, Mauritania, Mauritius, Micronesia, Mozambique, Namibia, Nauru, Nigeria, Niue, Palau, Papua New Guinea, Rwanda, St. Kitts and Nevis, St. Lucia, St. Vincent and the Grenadines, Solomon Islands, Samoa, Sao Tome and Principe, Senegal, Seychelles, Sierra Leone, Somalia, South Africa, Sudan, Suriname, Swaziland, Tanzania, Timor Leste, Togo, Tonga, Trinidad and Tobago, Tuvalu, Uganda, Vanuatu, Zambia, Zimbabwe). Cuba did not sign the Cotonou agreement with the EU.
8) The G-90 strategy 64 WTO Members of ACPs (56 on 79), LDCs (32 on 50) and the African Group (42 on 46), given a large overlap. 79 ACP (LDCs in italics, African Group underlined): Angola, Antigua and Barbuda, Belize, Cape Verde, Comoros, Bahamas, Barbados, Benin, Botswana, Burkina Faso, Burundi, Cameroon, Central African Republic, Chad, Congo (Brazzaville), Congo (Kinshasa), Cook Islands, Côte d'Ivoire, Cuba, Djibouti, Dominican Republic, Eritrea, Ethiopia, Fiji, Gabon, Gambia, Ghana, Grenada, Guinea-Bissau, Equatorial Guinea, Guyana, Haiti, Jamaica, Kenya, Kiribati, Lesotho, Liberia, Madagascar, Malawi, Mali, Marshall Islands, Mauritania, Mauritius, Micronesia, Mozambique, Namibia, Nauru, Nigeria, Niue, Palau, Papua New Guinea, Rwanda, St. Kitts and Nevis, St. Lucia, St. Vincent and the Grenadines, Solomon Islands, Samoa, Sao Tome and Principe, Senegal, Seychelles, Sierra Leone, Somalia, South Africa, Sudan, Suriname, Swaziland, Tanzania, Timor Leste, Togo, Tonga, Trinidad and Tobago, Tuvalu, Uganda, Vanuatu, Zambia, Zimbabwe). Cuba did not sign the Cotonou agreement with the EU.
 The G-90 strategy 9 other G-90 non ACPs LDCs: Yemen, Afghanistan, Bangla. LDCs") 8) The G-90 strategy 9 other G-90 non ACPs LDCs: Yemen, Afghanistan, Bangla. LDCs desh, Maldives, Nepal, Bhutan, Myanmar, Laos, Cambodia 3 other non ACPs of African Group (on 46 countries): countries) Egypt, Morocco, Tunisia The most crucial and common concern of the ACPs and African Group is the preference erosion related to all 3 pillars but mostly to the market access pillar: they fear that too large cuts in developed countries' tariffs will lead to the loss of their small preferential access to their markets given their much lower competitiveness than many emerging DCs.
8) The G-90 strategy 9 other G-90 non ACPs LDCs: Yemen, Afghanistan, Bangla. LDCs desh, Maldives, Nepal, Bhutan, Myanmar, Laos, Cambodia 3 other non ACPs of African Group (on 46 countries): countries) Egypt, Morocco, Tunisia The most crucial and common concern of the ACPs and African Group is the preference erosion related to all 3 pillars but mostly to the market access pillar: they fear that too large cuts in developed countries' tariffs will lead to the loss of their small preferential access to their markets given their much lower competitiveness than many emerging DCs.
 The EU and US new offensive since Cancun Profoundly humiliated by the end") 9) The EU and US new offensive since Cancun Profoundly humiliated by the end put in Cancun to their domination on the WTO, the EU and US have reacted skilfully through enhancing the international status of the two leaders of the G-20 (Brazil) and G-33 (India), through the following means: 1) Creation of the G-5 (Brazil, India, EU, US, Australia) to assume the informal leadership of the DR negotiations, which has been effective in adopting the Framework Agreement of 31 July 2004. Ever since the G-5 or G-4 (without Australia) and sometimes the G-6 (G-5 + Japan) has multiplied informal meetings, sometimes enlarged to "mini-ministerials" of 20 -25 Members, with the function to let the other Members accredit that they will eventually unlock the negotiations. However the G-5 and mini-ministerials have been challenged by most other Members which have been excluded from participating.
9) The EU and US new offensive since Cancun Profoundly humiliated by the end put in Cancun to their domination on the WTO, the EU and US have reacted skilfully through enhancing the international status of the two leaders of the G-20 (Brazil) and G-33 (India), through the following means: 1) Creation of the G-5 (Brazil, India, EU, US, Australia) to assume the informal leadership of the DR negotiations, which has been effective in adopting the Framework Agreement of 31 July 2004. Ever since the G-5 or G-4 (without Australia) and sometimes the G-6 (G-5 + Japan) has multiplied informal meetings, sometimes enlarged to "mini-ministerials" of 20 -25 Members, with the function to let the other Members accredit that they will eventually unlock the negotiations. However the G-5 and mini-ministerials have been challenged by most other Members which have been excluded from participating.
 The EU and US new offensive since Cancun 2) Through new offers made") 9) The EU and US new offensive since Cancun 2) Through new offers made to Brazil and India in negotiating bilateral agreements with them – EU-Mercosul, US-ALCA, US-India, EU-India –, so as to mitigate their demands at the WTO. 3) Through invitations to Celso Amorim (Brazil trade minister) and Kamal Nath (India trade minister) to chair many international seminars on the future of the international world trade system, particularly for agricultural products. 4) Through supporting Brazil and India candidacies to a permanent seat at the United Nations Security Council. We will analyse in the next part the empty EU and US offers to cut their trade-distorting domestic subsidies.
9) The EU and US new offensive since Cancun 2) Through new offers made to Brazil and India in negotiating bilateral agreements with them – EU-Mercosul, US-ALCA, US-India, EU-India –, so as to mitigate their demands at the WTO. 3) Through invitations to Celso Amorim (Brazil trade minister) and Kamal Nath (India trade minister) to chair many international seminars on the future of the international world trade system, particularly for agricultural products. 4) Through supporting Brazil and India candidacies to a permanent seat at the United Nations Security Council. We will analyse in the next part the empty EU and US offers to cut their trade-distorting domestic subsidies.
 IV – The Doha Round stalled negotiations since the Framework Agreement of 1 August 2004 1) DCs have been deceived by the Framework Agreement of 01 -08 -04, the Hong-Kong Declaration of 18 -12 -05 and the stalled negotiations ever since 2) The empty EU and US offers of October 2005 to cut their trade-distorting domestic supports and export subsidies 3) The EU reluctance to lower its agricultural tariffs at the level demanded by the US and the G-20 4) The actual accomplice behaviour of the Chair of the Special Committee on Agriculture with the EU and US 5) The limited defensive strategy of DCs on 'special products' (SP) and the 'special safeguard mechanism'
 DCs have been deceived by the Framework Agreement of 01 -08 -04, the") 1) DCs have been deceived by the Framework Agreement of 01 -08 -04, the Hong-Kong Declaration of 18 -12 -05 and the stalled negotiations ever since The WTO's Framework for Establishing Modalities on Agriculture (FEMA) of 01 -08 -04 had been hailed by DCs as a step forward in reequilibrating North. South agricultural trade relations, the North committing itself to eliminate its export subsidies and to reduce its trade-distorting domestic supports. But DCs have been deceived by the complex wording of the FEMA since it would allow the EU and the US to increase their coupled domestic subsidies.
1) DCs have been deceived by the Framework Agreement of 01 -08 -04, the Hong-Kong Declaration of 18 -12 -05 and the stalled negotiations ever since The WTO's Framework for Establishing Modalities on Agriculture (FEMA) of 01 -08 -04 had been hailed by DCs as a step forward in reequilibrating North. South agricultural trade relations, the North committing itself to eliminate its export subsidies and to reduce its trade-distorting domestic supports. But DCs have been deceived by the complex wording of the FEMA since it would allow the EU and the US to increase their coupled domestic subsidies.
 DCs have been deceived by the FEMA of 01 -08 -04 and by the Hong-Kong Declaration of 18 -12 -05 This sleight of hands can be explained by 4 tricks: 1) The possible confusion between allowed and applied levels of support. 2) Not taking into account that most CAP payments will have been transfered from the amber and blue boxes to the green box in 2007. 3) Not taking into account the possibility to exempt twice from the amber box the de minimis supports below 5% of the production value: for the product-specific AMS (Agregate Measure of Support) and for the non productspecific AMS. 4) The possible confusion between subsidy and market price support.
 DCs have been deceived by the FEMA of 01 -08 -04 and by the Hong-Kong Declaration of 18 -12 -05 Since DCs did not understand that domestic subsidies play the same role as export subsidies (and import protection), they were pleased that developed countries had agreed to phase out "all forms of export subsidies". In fact the biggest threat for net food-importing DCs is the priority given by the FEMA and the HK Declaration to "market access", to the reduction of import protection for all countries (Articles 28 & 29), except for LDCs.
 The empty US and EU offers of October 2005 to cut their trade-distorting") 2) The empty US and EU offers of October 2005 to cut their trade-distorting domestic supports From the US point of view – without taking into account its massive cheatings –, its offer is not feasible without changing drastically the Farm Bill, although Canada's simulations have told the contrary. USDA has recognized that "60 -percent reduction cuts the AMS ceiling to $7. 6 billion. An estimate for the 2005/06 marketing year suggests an AMS of around $13 billion, so the U. S. proposal implies a real and substantial reduction in amber box support". However, from the EU point of view – i. e. without taking into account its massive cheatings –, its offer is feasible without having to change its 2003 CAP reform and it could even reduce its total AMS by 72% and its TDS by 75%. This has been endorsed by the Canada's simulations of 22 May 2006.
2) The empty US and EU offers of October 2005 to cut their trade-distorting domestic supports From the US point of view – without taking into account its massive cheatings –, its offer is not feasible without changing drastically the Farm Bill, although Canada's simulations have told the contrary. USDA has recognized that "60 -percent reduction cuts the AMS ceiling to $7. 6 billion. An estimate for the 2005/06 marketing year suggests an AMS of around $13 billion, so the U. S. proposal implies a real and substantial reduction in amber box support". However, from the EU point of view – i. e. without taking into account its massive cheatings –, its offer is feasible without having to change its 2003 CAP reform and it could even reduce its total AMS by 72% and its TDS by 75%. This has been endorsed by the Canada's simulations of 22 May 2006.
 The empty US offers of 10 October 2005 to cut its trade-distorting domestic supports The 10 October 2005 the US has offered to cut, at the end of the implementation period of the next Ao. A, by 60% its allowed total AMS, which is the sum of product-specific AMSs (PS AMSs) and the non product-specific AMS (NPS AMS), i. e. from $19. 1 bn to 7. 6 bn, and by 53% its allowed "all trade-distorting domestic support" (TDS) composed of the total AMS + PS and NPS de minimis (dm) + the blue box (BB). It has also offered to cap by that time at 2. 5% of the value of agricultural production (VAP) the 2 de minimis supports (PSdm and NPSdm) and the BB. Base period for reduction commitments: the US is alone to ask 1999 -01 as its applied AMS was of $16. 0 bn against $10. 4 bn for 1995 -00, period claimed by the other Members. Yet none of both complies with the Framework Agreement to reduce the TDS as the Final bound AMS was that of end 2000 so that the base period must start in January 2001.
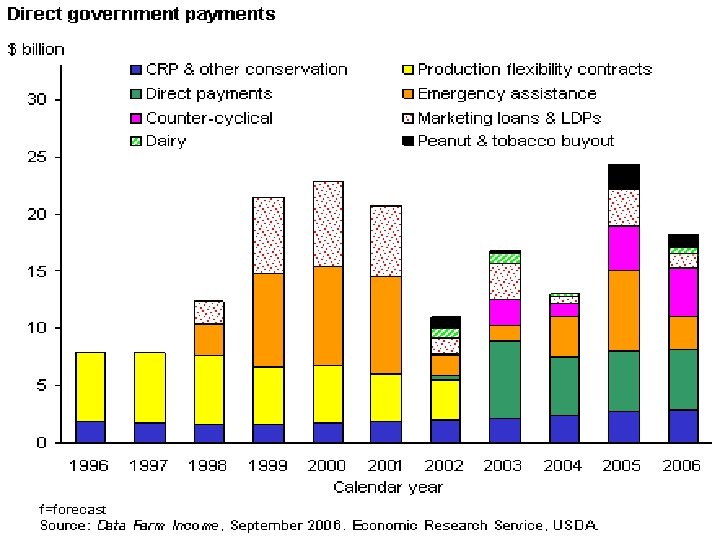
 The empty US offers of 10 October 2005 to cut its trade-distorting domestic supports First the WTO Appellate Body has ruled the 3 March 2005 in the cotton case that "Production Flexibility Contracts" (PFC) payments up to 2001 and Direct Payments (DP) from 2002 are not in the green box but in the NPS AMS because they are not fully decoupled as farmers are prevented to grow fruits & vegetables. That is why USDA is proposing to grant a full planting flexibility to farmers in the new Farm Bill but this would not be enough to shelter the DP from litigation on dumping grounds after the WTO Appellate Body rulings that dumping should take into account all domestic subsidies to exported products (slides 49 -50).
 The empty US offers of 10 October 2005 to cut its trade-distorting domestic supports The US is overdue by 5 years to notify its agricultural supports to the WTO (last notified year: 2001) as it is expecting the conclusion of the DR to notify its countercyclical payments (CCPs) in the new BB created by the Framework Agreement of 31 July 2004. Problem: the CCPs have succeded to the "market loss Problem payments" notified in the amber box (BO) as based on the current prices level. Hence the USDA's proposal for the new Farm Bill to base the CCPs on revenues, unaware that they would then be coupled twice: to prices and production! The Congressional Research Service has also admitted the 25 October 2006 that the CCPs are in the NPS AMS since they are linked to current prices.
 The empty US offers of 10 October 2005 to cut its trade-distorting domestic supports Another reason why the PFC, DP and CCP are in the amber box (NPS AMS) is that a large part of them has been given to grains consumed as feeds in the US (slides 71 & 74). If we add the US cheatings on other input subsidies (slides 71 -72), the NPS AMS had exploded beyond the de minimis cap so that it has been added to the applied total AMS from 1996 to 2000, which has jumped to $22. 3 bn in the 19952000 period and even of $33. 8 bn in 2000, thus exceeding by far the allowed total AMS of $19. 1 at the end of 2000. The same conclusion applies to the 2001 -05 period when the applied total AMS had reached $25. 8 bn – 35% above the allowed total AMS – and $31. 4 bn in 2005, 64. 6% beyond it!
 is") The US offer to cut by 53% its all trade-distorting domestic support (TDS) is even less feasible For the 1995 -00 period, the allowed TDS was of $42. 9 bn but fall at $19. 5 bn at the end of the implementation period. As the applied TDS in the period was $24. 2 bn, even $33. 9 bn in 2000, they would have to be reduced by 19% and 42. 4%! For the 2000 -05 period, the allowed TDS was of $43. 8 bn but fall at $20. 0 bn at the end of the implementation period. As the applied TDS in the period was $25. 8 bn and even $31. 4 bn in 2005, they should be reduced by 29% and 57%! Conclusion: the demand by other WTO Members that the US reduce its allowed TDS to at least $15 billion (EU and India) or even $12 -13 billion (Brazil) is totally unfounded.
The US offer to cut by 53% its all trade-distorting domestic support (TDS) is even less feasible For the 1995 -00 period, the allowed TDS was of $42. 9 bn but fall at $19. 5 bn at the end of the implementation period. As the applied TDS in the period was $24. 2 bn, even $33. 9 bn in 2000, they would have to be reduced by 19% and 42. 4%! For the 2000 -05 period, the allowed TDS was of $43. 8 bn but fall at $20. 0 bn at the end of the implementation period. As the applied TDS in the period was $25. 8 bn and even $31. 4 bn in 2005, they should be reduced by 29% and 57%! Conclusion: the demand by other WTO Members that the US reduce its allowed TDS to at least $15 billion (EU and India) or even $12 -13 billion (Brazil) is totally unfounded.
 The empty EU offer of 10 October 2005 to cut its trade-distorting domestic supports The 28 October the EU has offered to cut by 70% its allowed total AMS and TDS, by 80% the allowed de minimis (from twice 5% of the VAP to twice 1%) but to maintain the allowed BB at 5% of the VAP. But these offers are empty if they were to comply with the Ao. A rules as already shown partially for the 1995 -00 period: - € 10. 789 bn in feedstuffs subsidies (slides 71 -73), of which € 9. 743 bn notified in the BB, have conferred € 11. 913 bn in PS AMS to animal products, pulses and oilseeds, raising the applied total AMS from € 48. 242 bn to € 60. 155 bn. - € 11. 145 bn of the remaining blue box (slides 84 -89). - € 9. 538 bn of under-notified subsidies in the NPS AMS, which raises it at € 10. 066 bn. - € 5. 638 bn subsidies to investments of farmers, agro-industries and marketing, put in the green box (slide 77).
 EU actual non-product-specific AMS: 1995 -2001
 On an average value") The EU cheatings on its productspecific de minimis support (PSdm) On an average value of agricultural production (VAP) of € 222. 6 bn the value of products without PS AMS was of € 99. 7 bn and the allowed PSdm of € 5 bn. Given € 78. 4 bn in the production value of animal products with PS AMS linked to feedstuffs subsidies, the value of products without PS AMS falls at € 21. 3 bn and the PSdm at € 1. 1 bn against € 10. 6 bn for the NPSdm. And the PS AMS have jumped from the notified € 48. 2 bn to € 61. 9 bn given the € 11. 9 bn in feedstuffs subsidies plus € 1. 7 bn in other PS subsidies: to butter and liquid skimmed milk for agri-food industries and to stockholdings.
The EU cheatings on its productspecific de minimis support (PSdm) On an average value of agricultural production (VAP) of € 222. 6 bn the value of products without PS AMS was of € 99. 7 bn and the allowed PSdm of € 5 bn. Given € 78. 4 bn in the production value of animal products with PS AMS linked to feedstuffs subsidies, the value of products without PS AMS falls at € 21. 3 bn and the PSdm at € 1. 1 bn against € 10. 6 bn for the NPSdm. And the PS AMS have jumped from the notified € 48. 2 bn to € 61. 9 bn given the € 11. 9 bn in feedstuffs subsidies plus € 1. 7 bn in other PS subsidies: to butter and liquid skimmed milk for agri-food industries and to stockholdings.
 In fact the total") The EU cheatings on its productspecific de minimis support (PSdm) In fact the total AMS has risen on average from $61. 9 bn to $63. 6 bn from 1995 to 2000 because the applied NPS AMS of 1995 -96, having exceeded the allowed NPS AMS, has been transferred to the total AMS of that year, which has increased the average total AMS for the period.
The EU cheatings on its productspecific de minimis support (PSdm) In fact the total AMS has risen on average from $61. 9 bn to $63. 6 bn from 1995 to 2000 because the applied NPS AMS of 1995 -96, having exceeded the allowed NPS AMS, has been transferred to the total AMS of that year, which has increased the average total AMS for the period.
 The EU is very far from being able to cut its total allowed AMS by 70% All this has raised the applied total AMS at € 98. 2 bn or € 84. 8 bn whether we include or not the remaining green box. Thus, not only it cannot cut at all its allowed € 67. 159 bn AMS but must reduce its applied AMS by € 31. 054 bn or € 19. 909 bn! EU excess total applied AMS from 1995 to 2001
 The EU is very far from being able to cut its all trade-distorting support (TSD) by 70% The average allowed TDS from 1995 to 2000 has been of € 90. 5 bn: € 67. 2 bn in FBTA + € 11. 1 bn in NPSdm + € 1. 1 bn in PSdm + € 11. 1 bn in BB. To cut it by 70% at the end of the implementation period would drop it at € 27. 1 bn. However the applied TDS reached € 83. 0 bn: € 63. 6 bn in total AMS (without incorporating the remaining green box) + € 8. 2 bn in NPSdm + € 35 million in PSdm + € 11. 1 bn in BB. With the green box, the applied TDS reached € 96. 4 bn since total AMS reaches € 77. 0 bn If the applied TDS would stay the same in the implementation period, the reduction margin would be of € 7. 5 bn, i. e. of 8. 3% instead of the offered 70%, without green box. With it, the applied TDS would exceed the allowed TDS by 6. 5%!
 The decision to eliminate export subsidies the 31 -12 -2013 in the HK Declaration would not end EU & US dumping As long as domestic subsidies benefiting, directly and indirectly (including upstream on inputs and investments) and downstream (on processing and marketing), to the exported products are not taken into account, the EU and US dumping will continue and might even increase if their green box rises. Therefore time is up to impose this comprehensive definition of dumping which is the simplementation of the WTO Appellate Body statements in the Dairy products of Canada case the 3 December 2001 and 20 December 2002 (slides 49 -50 & 78 -83).
 Proposals to cut developed countries' and DCs' bound agricultural tariffs according to tariff") 3) Proposals to cut developed countries' and DCs' bound agricultural tariffs according to tariff tiers
3) Proposals to cut developed countries' and DCs' bound agricultural tariffs according to tariff tiers
 The EU proposals to lower its agricultural tariffs Two methods of tariff cuts are used: the average cut per tariff line (method used for the UR) and the average of all tariffs before and after all the cuts are implemented. The EU proposals to cut its agricultural tariffs: - Tariffs above 90% would be cut by 60 % - Tariffs between 60% and 90% would be cut by 50% - Tariffs between 30% and 60% would be cut by 45% - Tariffs below 30% would be cut by 35 %. With the first method the average of these cuts gives 39%, a figure judged too low by the US and the G-20. But the EU says it is using the second method which would cut the average tariff by 47%, from 23% to 12%.
 The EU proposals to lower its agricultural tariffs The EU’s present tariff profile is in the upper light blue envelope, sorted by the decreasing AVE of the EU’s tariffs. The middle orange envelope is the EU tariff profile were tariff cuts to be implemented as in the UR (low cuts on high tariffs, high cuts on lower ones) and the lower dark blue envelope represents the EU’s tariff profile if cuts are implemented on the basis of the EU’s proposal for the DDA. Source: EU Commission, Making Hong Kong a success: The EU offer on market access, November 2005
 Selfselection") The EU proposals on sensitive products The Framework Agreement defines 2 principles: 1) Selfselection of a limited number of tariff lines with a lower level of tariff cut; 2) substantial market access would be achieved through an expansion of the TRQ. The EU proposes 8% of ag tariff lines as sensitive (160 lines) but to compensate 80% of the lower tariff cut on them by increased TRQs: TRQ Increase (% of imports) on sensitive products = 80% x (Full Tariff Cut %) - Reduced Tariff Cut %)/(100% + Initial AVE %) Source: EU Commission, Making Hong Kong a success: The EU offer on market access, November 2005
The EU proposals on sensitive products The Framework Agreement defines 2 principles: 1) Selfselection of a limited number of tariff lines with a lower level of tariff cut; 2) substantial market access would be achieved through an expansion of the TRQ. The EU proposes 8% of ag tariff lines as sensitive (160 lines) but to compensate 80% of the lower tariff cut on them by increased TRQs: TRQ Increase (% of imports) on sensitive products = 80% x (Full Tariff Cut %) - Reduced Tariff Cut %)/(100% + Initial AVE %) Source: EU Commission, Making Hong Kong a success: The EU offer on market access, November 2005
 Demanding to cut DCs' ag tariffs ignores the import substitution effect of developed countries' subsidies Paragraph 3 of the Framework Agreement states: "The reforms in all three pillars form an interconnected whole and must be approached in a balanced and equitable manner". Yet the large import substitution effect of domestic subsidies has not been considered in the DR salamied proposals. Yet reducing domestic agricultural prices by 50% has the same impact as an increased duty of 50% if the price elasticity of imports is 1, of 40% if it is 0. 8. The more so as the DR negotiations do not consider the much broader "gold box" subsidies of developed countries. See slides 41 and 55 -69.
 The EU cheatings on import protection rules According to the Ao. A article 4. 2, "Members shall not maintain… any measures of the kind which have been required to be converted into ordinary customs duties… These measures include… variable import levies". However the EU has maintained for fruits & vegetables (F&V) measures equivalent to variable import levies: when the entry price is below a trigger price the importer must pay, besides the ad valorem (AV) duty, a specific duty calculated as the gap entry price-trigger price. Furthermore, when the entry price is lower than 92% of the trigger price the specific duty goes much beyond the gap. E. g. for tomatoes imported from October to March, the AV equivalent goes from 8. 8% to 73. 4% when the entry price is above the trigger price or below 92% of it. Admittedly the EU has notified this way of tariffing F&V which has not yet been challenged at the WTO.
 The actual accomplice behaviour of the Chair of the Special Committee on Agriculture") 4) The actual accomplice behaviour of the Chair of the Special Committee on Agriculture with the EU and US Crawford Falconer, Chair and facilitator of the agriculture negotiating committee since 31 July 2005, one of the few who know perfectly well the massive EU and US cheatings, claims he is not allowed to remind the WTO rules to Members – including the Appellate Body precedents –, which is strange for an institution claiming to be rules-based (see also slide 84). Therefore, the numerous "reference papers" he has been circulating to agricultural negotiators, as those issued by his predecessors Stuart Harbinson and Tim Groser since early 2002, have contributed largely to obscuring the understanding of DCs' negotiators, unaware of the EU-US cheatings and of the non sense of many Ao. A rules such as that on PS AMS linked to administered prices (slides 34 -37).
4) The actual accomplice behaviour of the Chair of the Special Committee on Agriculture with the EU and US Crawford Falconer, Chair and facilitator of the agriculture negotiating committee since 31 July 2005, one of the few who know perfectly well the massive EU and US cheatings, claims he is not allowed to remind the WTO rules to Members – including the Appellate Body precedents –, which is strange for an institution claiming to be rules-based (see also slide 84). Therefore, the numerous "reference papers" he has been circulating to agricultural negotiators, as those issued by his predecessors Stuart Harbinson and Tim Groser since early 2002, have contributed largely to obscuring the understanding of DCs' negotiators, unaware of the EU-US cheatings and of the non sense of many Ao. A rules such as that on PS AMS linked to administered prices (slides 34 -37).
 The 'special products' (SP) and the 'special safeguard mechanism' (SSM) Following the debate") 5) The 'special products' (SP) and the 'special safeguard mechanism' (SSM) Following the debate on the 'Development Box' (slides 104 -105), the SPs concept was introduced in 2002 and the Harbinson's report of 18 March 2003 proposed that the reduction rate of bound tariffs on SPs be limited to 10% on average instead of at least 20% for non LDCs and 40% for developed countries. G-33 and G-90 countries are placing large hopes in the possibility to maintain high protection rates of their domestic market through 'special products' (SPs) and the 'Special safeguard mechanism' (SSM) introduced in the FEMA of 31 July 2004 and confirmed in the Hong Kong Declaration of 18 December 2005, "based on criteria of food security, livelihood security and rural development needs".
5) The 'special products' (SP) and the 'special safeguard mechanism' (SSM) Following the debate on the 'Development Box' (slides 104 -105), the SPs concept was introduced in 2002 and the Harbinson's report of 18 March 2003 proposed that the reduction rate of bound tariffs on SPs be limited to 10% on average instead of at least 20% for non LDCs and 40% for developed countries. G-33 and G-90 countries are placing large hopes in the possibility to maintain high protection rates of their domestic market through 'special products' (SPs) and the 'Special safeguard mechanism' (SSM) introduced in the FEMA of 31 July 2004 and confirmed in the Hong Kong Declaration of 18 December 2005, "based on criteria of food security, livelihood security and rural development needs".
 The 'special products' (SP) and 'special safeguard mechanism' (SSM) The G-33, born from") 5) The 'special products' (SP) and 'special safeguard mechanism' (SSM) The G-33, born from the countries having proposed SPs and SSM, has proposed a self-selection of SPs based on specific indicators. SPs should cover 20% of ag tariff lines and part of them should not be subjected to any reduction. There should not be any compensatory tariff rate quotas (imports at a lower tariff) for SPs. Products whose world market prices are distorted by rich country subsidies should be automatically eligible for SP status. Besides SPs, DCs are also entitled to 'sensitive products' with lower than average reduction rates. The SSM should be opened to all DCs for all agricultural products and be automatically triggered by import surges or prices falls. DCs' de minimis support should not be cut
5) The 'special products' (SP) and 'special safeguard mechanism' (SSM) The G-33, born from the countries having proposed SPs and SSM, has proposed a self-selection of SPs based on specific indicators. SPs should cover 20% of ag tariff lines and part of them should not be subjected to any reduction. There should not be any compensatory tariff rate quotas (imports at a lower tariff) for SPs. Products whose world market prices are distorted by rich country subsidies should be automatically eligible for SP status. Besides SPs, DCs are also entitled to 'sensitive products' with lower than average reduction rates. The SSM should be opened to all DCs for all agricultural products and be automatically triggered by import surges or prices falls. DCs' de minimis support should not be cut
 The 'special products' (SP) and 'special safeguard mechanism' (SSM) Caught in the crossfire") 5) The 'special products' (SP) and 'special safeguard mechanism' (SSM) Caught in the crossfire of its defensive and offensive interests in the DR, India has refused to host the G-33 ministerial meeting in mid-March 07 and has declared to be more flexible on SPs-SSM than the official G-33 position. On the other hand the Farmers organisations and NGOs have told the G-33 meeting in Jakarta the 20 March 2007: "Merely designating SPs and using SSM is not going to protect peasants and small farmers…We therefore call on the G 33 Ministers to…fight for food sovereignty… It is better to let the Doha Round die". On the opposite front, the World Bank has always criticized SPs and SSM which "could undermine food supply to the world's poor" as they will raise agricultural prices. The G-33 has reacted strongly against this statement.
5) The 'special products' (SP) and 'special safeguard mechanism' (SSM) Caught in the crossfire of its defensive and offensive interests in the DR, India has refused to host the G-33 ministerial meeting in mid-March 07 and has declared to be more flexible on SPs-SSM than the official G-33 position. On the other hand the Farmers organisations and NGOs have told the G-33 meeting in Jakarta the 20 March 2007: "Merely designating SPs and using SSM is not going to protect peasants and small farmers…We therefore call on the G 33 Ministers to…fight for food sovereignty… It is better to let the Doha Round die". On the opposite front, the World Bank has always criticized SPs and SSM which "could undermine food supply to the world's poor" as they will raise agricultural prices. The G-33 has reacted strongly against this statement.
 V – The mechanisms at work beyond Northern subsidies: the role of prices and supply management Why the world prices of agri-food products have no economic meaning What are the main forces driving down the world prices: Western subsidies or lack of supply management?
 Why the world prices of agri-food products have no economic meaning The world prices cover only a tiny share of world production The world price of agricultural products does not exist World agricultural prices are highly volatile within a declining trend Futures markets cannot put the prices right beyond few months and at a high cost Projections of higher agricultural prices in the mid run are constantly contradicted by facts The world agricultural prices are manipulated by oligopolies and the States The world agricultural prices claim to be the "true prices"
 The tiny share of the basic staples exported on the world markets from 2000 to 2003
 The world price of agricultural products does not exist: it is often that of the so-called most competitive country. Taking the New-Zealand price of dairy products as the world price is absurd: 1) it produces only 2% of the world milk; 2) is is 'price taker', fixed below the highly dumped EU's price, the EU being the 1 st exporter.
 The world agricultural prices are highly volatile within a declining trend The following charts show the long term declining trend of most agricultural products at constant prices and often also at current prices although a recovery has occurred since 2002, followed by a new slump in grains prices in 2005 and then by a sharp rise since 2006 owing to the ethanol boom. However cotton prices are still lagging.
") Source : d'après Banque mondiale (http: //www. worldbank. org/data/wdi 2001/pdfs/tab 6_4. pdf)
Source : d'après Banque mondiale (http: //www. worldbank. org/data/wdi 2001/pdfs/tab 6_4. pdf)
 The rise in Commodities Prices since 2002
 The recent surge in sugar price is still a long way below the 1974 and 1981 levels
 Wheat price in Chicago: US cents per bushel
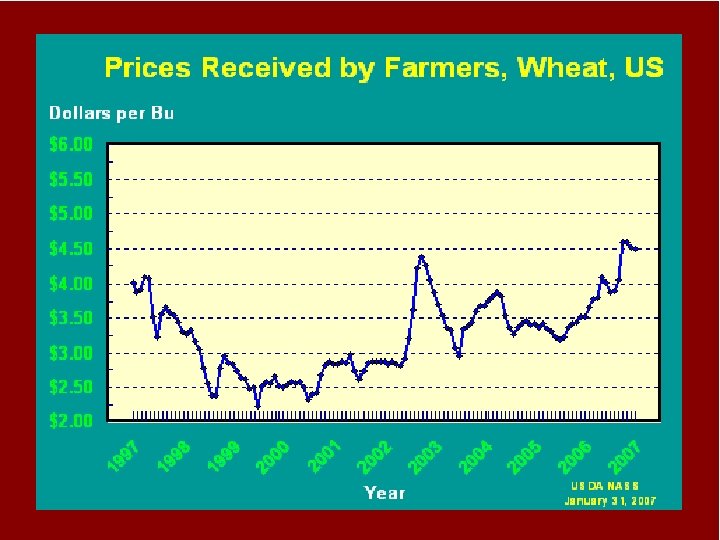
 Wheat price in Paris, in euros per tonne
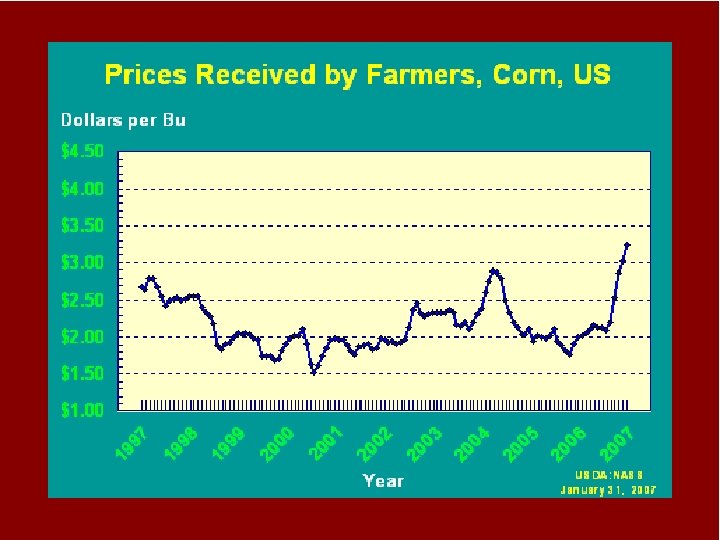
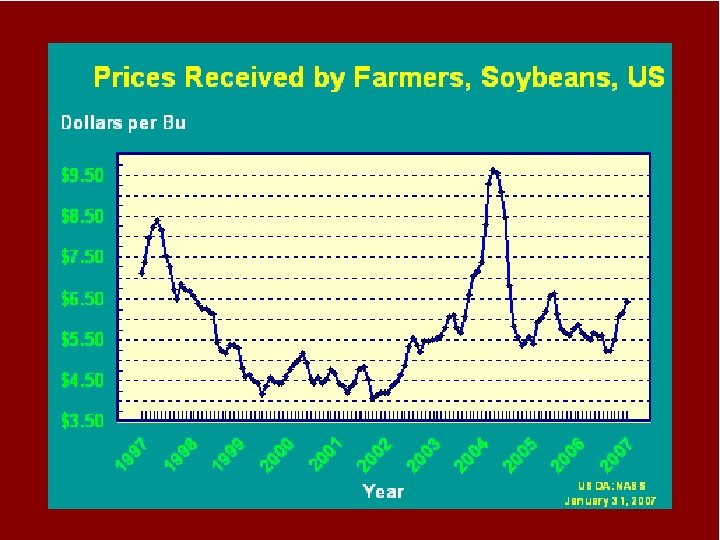
 Source : d'après les données Banque mondiale et Organisation internationale du café
 Whereas the price") Source : Banque mondiale (http: //www. worldbank. org/data/wdi 2001/pdfs/tab 6_4. pdf) Whereas the price in current dollar for 1961 (558 $/t) was below its 2000 level (940 $/t) by 41%, it was three times higher in constant dollars!
Source : Banque mondiale (http: //www. worldbank. org/data/wdi 2001/pdfs/tab 6_4. pdf) Whereas the price in current dollar for 1961 (558 $/t) was below its 2000 level (940 $/t) by 41%, it was three times higher in constant dollars!
 Coffee price in London, in $ per tonne
 Cotton price in New-York, in cents per pound
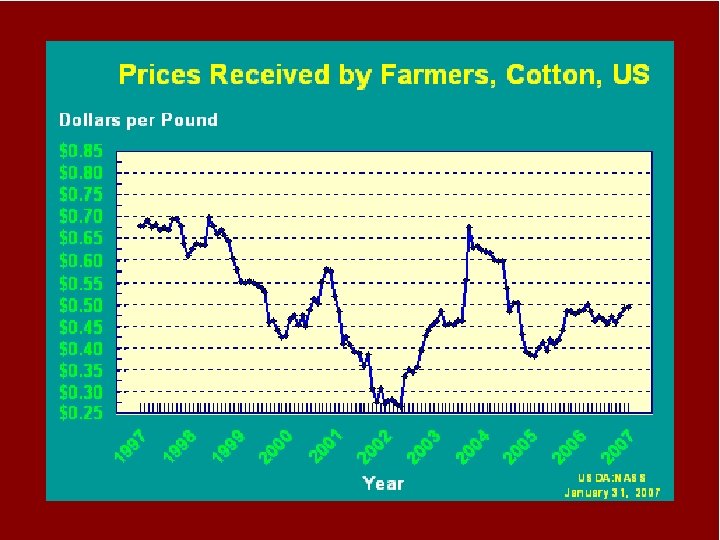
 Source: http: //www. tradingreview. com/cotton-commodity-chart.") Evolution of cotton price from 1960 to 2006 (cts/lb) Source: http: //www. tradingreview. com/cotton-commodity-chart. html
Evolution of cotton price from 1960 to 2006 (cts/lb) Source: http: //www. tradingreview. com/cotton-commodity-chart. html
 Futures markets cannot put the prices right beyond few months and at a high cost Above all, interventions on futures markets are incompatible with any policy aiming at price regulation since the necessary speculators on those markets are only interested to intervene if there is a high price volatility.
 Wheat prices CIF Rotterdam: 1984 -2000 Monthly variations of Nasdaq: 1984 -2000 Source : Tancrède Voituriez & Françoise Gérard (CIRAD, 2001)
 Projections of higher agricultural prices in the mid run are constantly contradicted by facts But these positive prospects play an obvious political role to induce price drops, by letting producers expect prices increases to induce them to raise production.
 Most agricultural prices are highly dumped prices Western basic agri-food products are exported at highly dumped prices (slides 49 -50, 78 -83 , 91, 131). Beyond the identifiable subsidies, most Western agricultural products incorporate an imprecise and broad array of "non-specific" or "gold box" subsidies.
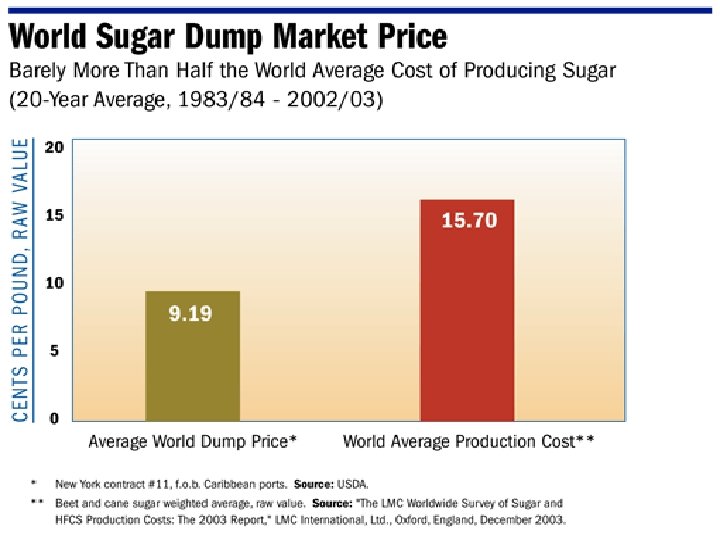
 The world agricultural prices are manipulated by oligopolies and the States The world agricultural prices are manipulated by more and more consolidated agri-food oligopolies at the processing and distribution levels. They are also manipulated by State monopolies and even by the EU and US which differentiate greatly their export subsidies (EU) or credit guarantees (US) according to the importing countries. Thus the EU is proud to claim that it is granting higher export subsidies on exports to ACPs.
 The world agricultural prices claim to be the "true prices" They are considered as the true prices since they maximise economic welfare: actually the consumers' surplus does not exist since lower farm prices are not transmitted to them. They pretend to be the true prices since they mirror the comparative advantage of countries. But what could be the comparative advantage of a Sahelian farmer growing 1 tonne of millet vis-à -vis his French colleague producing 1000 tonnes of wheat, and which gets besides about € 57, 000 in authorised blue or green subsidies?
 The world agricultural prices are presented as the "true prices" They are presented as the true prices since nominated in hard currencies, mostly in dollars, an argument put forward mainly for DCs, whose currency is not convertible. They cannot be the "true prices" as they do not incorporate ("internalise") market failures in the areas of social, environment, food security and food safety issues.
 The main forces driving down the world prices: Western subsidies or lack of supply management? To what extent Western agricultural subsidies are they responsible of the low world prices? Increased productivity and decline in the prices of temperate products The US is price maker of the world prices of grains The specific price inelasticity of the supply and demand of agri-food products How the US farms would adapt to reduced prices and subsidies The same farms concentration may occur in the EU Yet US and EU agricultural subsidies are the source of a massive dumping of their agri-food products
 To what extent Western agricultural subsidies are they responsible of the low world prices? DCs and some NGOs charge the large Western agricultural subsidies as the only reason for the collapse of world agricultural prices and demand their phasing out, without distinguishing between products exported or only consumed domestically. Yet the collapse of tropical products prices since 1997 (with a recovery since 2004) shows that other mechanisms than Northern subsidies are at work since the North does not grow these products.
 Increased productivity and decline in the prices of temperate products The long run declining trend of agricultural prices can be partly explained by increases in labour productivity and yields, at least for temperate products (cereals, meats, milk), infinitely less for tropical products (coffee, cocoa, etc. ).
 The US is price maker of the world prices of grains Daryll Ray & Daniel de la Torre Ugarte (University of Tennessee) have shown that: 1) The US prices of grains (cereals, rice, oil 2) seeds, pulses, cotton) make the world prices. 3) 2) The US subsidies are not the cause of the 4) slump in the world prices of grains since their 5) elimination would not raise them signifi 6) cantly: less than 1% for wheat and soybean, 7) 2 -3% for maize, 7 -12% for cotton.
 The specific price inelasticity of the supply and demand of agri-food products This results from the specificity of agri-food markets: low reaction ('elasticity') of demand supply to lower prices. Consumers do not eat more and producers do not reduce their production when the price drops or the subsidies disappear. Even if many family farmers go bankrupt, their lands will be taken over by more efficient farmers or the product mix will change but the lands will go on producing.
 How the US farms would adapt to reduced prices and subsidies A sharp drop in prices and subsidies would generate a sharp drop in the price of land, accounting for 40% of the production cost of grains, thus fostering a concentration of lands in larger farms which would make economies of scale, particularly in mechanization. The US agriculture would reproduce the model of the huge farms of Brazil-Argentine with which they could compete, but at high social and environmental costs.
 The same farms concentration may occur in the EU A 2000 University of Bonn report contemplates the same for the EU: "Only those farms, which reach a minimum degree of international competitiveness, will survive as commercial full time farms in liberalised markets in the longterm… A key task of the CAP should be to contribute to international competitiveness of the core of commercial farms on suitable locations in Europe. This is also a precondition to attain frequently stated income goals in a liberalised world" (http: //europa. eu. int/comm/agriculture/publi/archive/index_en. htm)
 The EU is co-responsible of the slump in world agricultural prices The EU has also contributed highly to the slump in the world prices of barley, rye and dairy products of which it is the 1 st exporter, and to those of sugar and wheat of which it is the 2 nd exporter, without forgetting meats whose exports are also made at prices much below their average production cost.
 Yet US and EU agricultural subsidies are the source of a massive dumping of their agricultural products Hence we could agree that the large increase in Northern subsidies has been the result and not the cause of the slump in world prices, rooted in the dismantling of supply management measures since the 1996 US Farm Bill and, to a lesser extent, since the CAP reforms of 1992 to 2003. Yet, it is not because the elimination of US and EU agricultural subsidies would not have a large impact on the recovery of world prices in the medium to long run that they are not a fundamental condition of the dumping of their agri-food products in the short run.
 Yet US and EU agricultural subsidies are the source of a massive dumping of their agri-food products Indeed they have been the political condition having allowed the reduction of the US and EU agricultural prices below production costs, fostered by the agri-food corporations, without challenging radically the predominance of family farms, which would not have accepted a drastic reduction of their income without these compensatory subsidies. However, as this compensation has not been total, this has accelerated the elimination of small farms.
 For more detailed informations, consult Solidarité's website: http: //solidarite. asso. fr/home/Agriculture 06. php or send an e-mail to Jacques Berthelot: berthelot@ensat. fr Consult also the file "Sub-Saharan and West African agricultural trade and the Economic Partnership Agreements with the EU" with 4 chapters and 150 slides: I – The impact of agricultural liberalisation in Sub-Saharan Africa II – How domestic subsidies to US cotton farmers are making a fool of the C 4's initiative on cotton III – The EPAs between the EU and ACP countries are criminal and their negotiation should be stopped IV – Strategy to rebuild agricultural policies in West Africa and the Ao. A on food sovereignty