

caa2716c10880b47617f4de67fa9d5f7.ppt
- Количество слайдов: 17
 Unintentional injuries in adults of working age: Who’s injured is no accident. Dr Andrew Gamble, Health Intelligence Officer, PHA Unintentional injuries – definition The term ‘unintentional injury’ replaces that of ‘accidental injury’ in recognition of the fact that – ‘most injuries and their precipitating events are predictable and preventable’ Davis R, Pless B (2001) BMJ bans ‘accident’. BMJ 322: 1320 -1
 The scale of UI in Northern Ireland – all ages
 by Cause of Death (18 -64 yrs)") PYLL(75) by Cause of Death (18 -64 yrs)
PYLL(75) by Cause of Death (18 -64 yrs)
 Trend in UI deaths by age-group
 UI deaths as a proportion of total deaths by age-group and gender in Northern Ireland
 Key facts 20 -39 yrs 40 -64 yrs 1, 139 1, 486 Deaths (2001 -2013*) Unintentional injury (V 01 -X 59; Y 85 -Y 86) Trends 2001 -2013 Fluctuating: high of 121 deaths in 2005, low of Fluctuating: low of 63 in 2001 to high of 145 in 51 in 2012, 57 in 2013* 2008; 135 deaths in 2011, 113 in 2013* Proportion of total deaths (2001 -2013) in age-group Top 3 causes of unintentional injury death (2001 -2013) 1, 139/4, 963 = 22. 9% 1) 2) 3) ‘Transport’, n=700 Accidental poisoning n=187 Falls n=79 1, 486/30, 007 = 5. 0% 1) 2) 3) Falls, n=441 ‘Transport’ n=396 Accidental poisoning n=269 Hospital admissions: Unintentional injury – cause code ICD-10 V 01 – X 59. 34, 061 admissions in people aged 37, 642 admissions in people aged 20 -39 yrs (2003 -2012). 40 -64 yrs (2003 -2012). (DHSSPS 2003 -2012) ( ~ 70 admissions per week) ( ~ 72 admissions per week) Top 4 causes of hospital admissions 1) ‘Fall’ n=11, 369 2) ‘Transport-related’ n=6, 989 (2003 -2012) 3) Inanimate forces n= 6, 221 4) X 59†, n=4, 709 Road traffic deaths (PSNI, 2013) Road traffic ‘Seriously injured’ (PSNI, 2013) 1) ‘Fall’ n=20, 736 2) Inanimate forces n= 4, 681 3) ‘Transport-related’ n=4, 529 4) X 59†, n=3, 715 26 10 267 208 *Note: Year refers to calendar year in which death was registered and not the actual year of death. † ICD-10 code X 59 = ‘Accidental exposure to unspecified factor’; this is a general coding term used to describe accidental events were the actual circumstances are unclear.
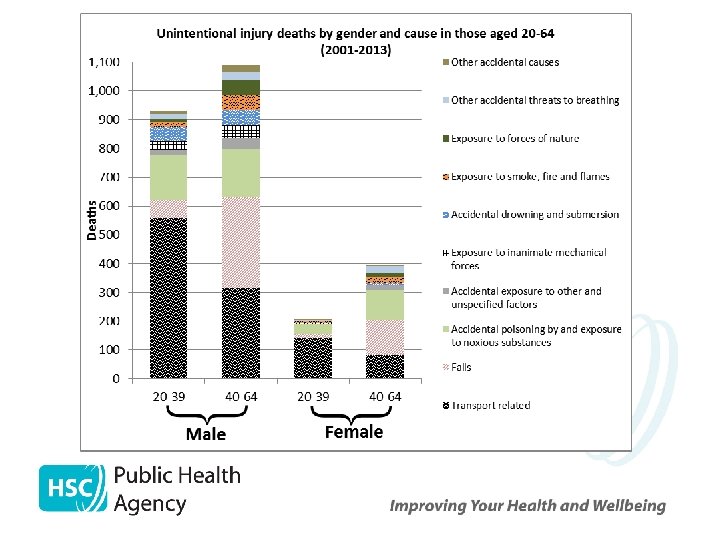
 by major cause") UI deaths (20 -64 yrs) by major cause
UI deaths (20 -64 yrs) by major cause
 by deprivation quintile") UI deaths (20 -64 yrs) by deprivation quintile
UI deaths (20 -64 yrs) by deprivation quintile
 Work-related fatalities Work related fatalities by sector: Northern Ireland 2009/10 to 2013/14:
 Hospital admissions due to UI 2003 -2012
 Ambulance call-outs – rates per 100, 000 in those 20 -39 yrs by LGD Average call-out rate = 2, 723 per 100, 000; Total call-outs 13, 404 ≡ 462 per month
 Ambulance call-outs – rates per 100, 000 in those 40 -64 yrs by LGD Average call-out rate = 3, 156 per 100, 000; Total call-outs 18, 439 ≡ 636 per month
 Accidental poisoning deaths
 Accidental poisoning – a summary of statistics § § § Accidental poisoning deaths most common in those aged 20 -64 yrs, and predominantly in males ‘Drugs & Alcohol’ are the cause of the vast majority of these deaths ‘Home/Other House’ is main place of death (71% in those 40 -64 yrs) § Hospital admission rates rose for all age-groups 2010 to 2012 – highest for those aged under 10 and those 75+ (both 57. 5 per 100, 000 in 2012). Next highest rate was for those aged 20 -39 yrs (41. 3 per 100, 000) § 44. 5% of ambulance call-outs due to poisoning were to those aged 20 -39 yrs - approximately 200 call-outs per month April 2012 to August 2014 for this age group.
 Acknowledgements Thanks to GRO/NISRA for the provision of the deaths data, DHSSPS for providing hospital admissions data and to NIAS for supplying statistics on ambulance call-outs.
 PHA Health Intelligence briefings are available on a range of topics Email: andrew. gamble@hscni. net