

659787f41f34c32b1b769416a9d9c682.ppt
- Количество слайдов: 108
 Understanding Genetics For Use In Goat Production Dr. Dennis Onks Director Middle TN Research Center University of Tennessee
 PHENOTYPE AN ANIMAL’S VISUAL EXPRESSION OR PERFORMANCE IN ANY TRAIT The Phenotype is the outcome of Genetic Transfer as developed in a production Environment
 PHENOTYPE Defined as the sum of the genetic and environmental variation The Genetic variation accounts for 25% of The Phenotype while the Environment Accounts for 75%!
 Sound Breeding Program Maximum Genetic Improvement occurs In a Herd Environment that allows the Improved Genetics to be Expressed
 Sources of Environmental Variation 1. Weather 2. Land Topography 3. Structural Resources 4. Forages and Feeding 5. Health and Sanitation
 Genetic Variation is the study of How Traits are Inherited • All body cells contain “Blueprints” with instructions as to how an animal will look or act etc. • DNA or Deoxyribonucleic Acid contains the genes of traits in the double helix ribbons located in every cell
 GENE The combination of genes are attached to chromosomes which guide the animal to express A trait or response http: //library. thinkquest. org
 Species differ in chromosomes Humans 23 pairs of chromosomes Cattle 30 pairs of chromosomes Sheep 27 pairs of chromosomes Swine 19 pairs of chromosomes Chicken 39 pairs of chromosomes Goat 30 pairs of chromosomes Horse 16 pairs of chromosomes
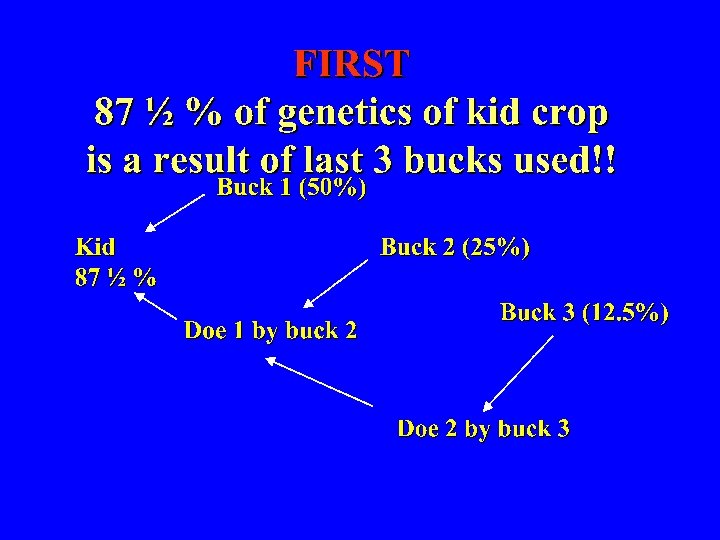
 How Traits are Inherited The science of ½’s since each living animal receives a Sample ½ of its genetics from its father and a sample ½ of its genetics from its mother. The process of halving is done by Meiosis
 (allele We’re") Gene Dominance One Gene overshadows The expression of its other pair (allele) (allele We’re heterozygous (different) WW and Ww = White
Gene Dominance One Gene overshadows The expression of its other pair (allele) (allele We’re heterozygous (different) WW and Ww = White
 • The gene that is overshadowed by a") Recessive Genes We’re Homozygous (the same) • The gene that is overshadowed by a dominant gene. Recessive genes can only be expressed when they both are present RED COAT COLOR = ww
Recessive Genes We’re Homozygous (the same) • The gene that is overshadowed by a dominant gene. Recessive genes can only be expressed when they both are present RED COAT COLOR = ww
 QUALITATIVE TRAITS THAT ARE AFFECTED BY A SINGLE OR A FEW PAIR OF GENES COAT COLOR TEETH HORNS
 QUANTITATIVE TRAITS AFFECTED BY NUMEROUS PAIRS OF GENES The thousands of genes present make countless combinations possible in an animal. Since genes are too small to identify individually, they express their presence by such outward effects as differences in growth, carcass or reproduction traits
 Growth traits Birth weight Weaning weight Yearling weight Growth rate (ADG)") Quantitative Traits (cont’d) Growth traits Birth weight Weaning weight Yearling weight Growth rate (ADG) Frame size Carcass traits Rib eye area Fat thickness Marbling Reproduction traits fertility/adaptability
Quantitative Traits (cont’d) Growth traits Birth weight Weaning weight Yearling weight Growth rate (ADG) Frame size Carcass traits Rib eye area Fat thickness Marbling Reproduction traits fertility/adaptability
 Which buck has the best genetics for growth? Is the buck on the left bigger because he had better genetics for growth or because he was provided a better environment?
 IMPROVEMENT OF ANY TRAIT DEPENDS: MEASURING DIFFERENCES IN A TRAIT ACCURATELY IDENTIFYING SUPERIOR INDIVIDUALS IN THE TRAIT USING SUPERIOR INDIVIDUALS AS PARENTS HOW HERITABLE THE TRAIT IS (heritability)
 What is Selection? • Choosing animals to be parents for the next generation to produce certain characteristics • Low Birth weight • Heavier Weaning Weight • Gaining Fast • Horned or Polled • Temperament • Better Eating Quality
 Percentage of the differences (measured or observed) in a trait between animals") Heritability(h 2) Percentage of the differences (measured or observed) in a trait between animals that are transmitted to the offspring. Reproduction Low fertility, etc. Production Moderate growth Product High carcass (Heritability is a measure of how a trait will respond to selection)
Heritability(h 2) Percentage of the differences (measured or observed) in a trait between animals that are transmitted to the offspring. Reproduction Low fertility, etc. Production Moderate growth Product High carcass (Heritability is a measure of how a trait will respond to selection)
 Low Heritable Traits • • • Birth Interval Number Born Rear Legs Udder Support Reproduction 5 -10% 15% 20% 15%
 Moderately Heritable Traits • • Birth Weight Weaning Weight Yearling Weight Feed Conversion Quality Grade Ribeye Area Muscling 30 -40% 20 -30% 40% 40 -45%
 Highly Heritable Traits • • • Mature Weight Milk Fat Stature, Frame Carcass Weight Scrotal Circumference 65% 55% 45 -50% 50%
 Between Traits • Genetic Correlation") Selection for traits is Impacted by the Correlation(r 2) Between Traits • Genetic Correlation measures the genetic association between traits • Phenotypic Correlation measures the local or environmental association between traits • Correlation ranges in value of +1. 0 to – 1. 0 (indicates the direction of association)
Selection for traits is Impacted by the Correlation(r 2) Between Traits • Genetic Correlation measures the genetic association between traits • Phenotypic Correlation measures the local or environmental association between traits • Correlation ranges in value of +1. 0 to – 1. 0 (indicates the direction of association)
 Phenotypic Correlations Body WT Kidding -. 50 Difficulty Length Heart Girth Backfat Loin Area +. 92 Heart Girth +. 97 +. 87 +. 60 +. 45 +. 51 Loin Area +. 90 Scrotal +. 86 Circumference +. 74 +. 89 +. 79 +. 87 +. 77 +. 51 Backfat +. 67
 Use of Heritability and Correlations • Selection for Weight makes moderate progress (h 2=40 -65%) • Positive Correlation (r 2=+. 50) between birth, weaning and carcass traits means Selection will result in increases in all three traits.
 Use of Heritability and Correlations • Selection for Weight makes moderate progress (h 2=40 -65%) • Negative Correlation (r 2=-. 50) between Weight and Kidding Difficulty means Selection will result with increased Kidding Difficulty and birth, weaning and carcass weight.
 Selection for the Industry • • • Consumer Packer Feeder Commercial producer Purebred Breeder • Each section may have differing trait criteria
 CONSUMER • Price/ Value • Consistency • Holidays • Taste/ Flavor • Safety/ Health
 PACKER • Dressing Percent • Quality Grade • Yield Grade
 FEEDER • Health • Gain • Feed Efficiency
 Commercial or Purebred Producer • Reproduction • Maintenance Cost • Growth – Weaning – Yearling
 ECONOMIC IMPORTANCE TRAIT RELATIVE IMPORTANCE REPRODUCTION 2 PRODUCTION 1 PRODUCT 1
 Reproduction") Heritability (Heritability is a measure of how a trait will respond to selection) Reproduction Product Low Moderate High “or how well the offspring resemble their parents phenotype”
Heritability (Heritability is a measure of how a trait will respond to selection) Reproduction Product Low Moderate High “or how well the offspring resemble their parents phenotype”
 • GENETIC EFFECTS – ½ GENETICS FROM BUCK – ½ GENETICS") MEASURABLE TRAIT (Phenotype) • GENETIC EFFECTS – ½ GENETICS FROM BUCK – ½ GENETICS FROM DOE • ENVIRONMENTAL EFFECTS – WEATHER – NUTRITION – HEALTH – Etc.
MEASURABLE TRAIT (Phenotype) • GENETIC EFFECTS – ½ GENETICS FROM BUCK – ½ GENETICS FROM DOE • ENVIRONMENTAL EFFECTS – WEATHER – NUTRITION – HEALTH – Etc.
 Measures of Phenotype P = G + E Birth weights Weaning weights Yearling weights Carcass Traits Reproductive traits Adaptability
 Measures of Phenotype P = G + E Requires: 1. Identification of animals 2. Equipment to record trait measure 3. Record Keeping System 4. Computer with Spreadsheet is economical and recommended
 Genetic Evaluations Phenotypes and Pedigrees Objective: convert data into genetic information for the purpose of selection Separate genetic portion of phenotype from environment.
 41 lbs • • 90 DAYS OLD ON FARM “A” BUCK 2 YR DOE 38 lbs • • 105 DAYS OLD ON FARM “A” BUCK 4 YR DOE WHAT ARE THE KNOWN ENVIRONMENTAL EFFECTS?
 Known Environmental Effects 650 680 AGE - 15 DAYS + 15 DAYS AGE OF DOE 2 YR OLD 4 YEAR OLD FARM SAME
 X 90 + doe") Adjusted 90 day wt. formula (Actual Wt - Birth wt) X 90 + doe age adj. + birth wt Age in days Breed associations are calculating adjustments as they accumulate data from the breeders
Adjusted 90 day wt. formula (Actual Wt - Birth wt) X 90 + doe age adj. + birth wt Age in days Breed associations are calculating adjustments as they accumulate data from the breeders
 90 days X 90 + 5 +") Adjusted 90 day wt. (41 – 8) 90 days X 90 + 5 + 8 = 45. 999 Lbs. (42 – 7) X 90 + 7 105 days = 36. 999 Lbs.
Adjusted 90 day wt. (41 – 8) 90 days X 90 + 5 + 8 = 45. 999 Lbs. (42 – 7) X 90 + 7 105 days = 36. 999 Lbs.
 Contemporary Group Ratios adj. 90 day wt 39 Buck A adj. 90 day wt 37 Buck B Herd Avg. = 36 Ratio = 39/36 Ratio = 37/36 108 102. 8 Useful for within herd selections but not between herds
 We must expect differences between animals across different environments
 Future Genetic Evaluations Source of data Ancestors Collateral relatives Descendents Own performance Correlated traits
-Expected Progeny Difference • A prediction of the genetics a goat will pass on") (EPD)-Expected Progeny Difference • A prediction of the genetics a goat will pass on to his kids, when compared to other goats within the breed • Takes into account the actual measurements, all ancestral measurements and environment • Not a perfect science, so use as a risk management tool
(EPD)-Expected Progeny Difference • A prediction of the genetics a goat will pass on to his kids, when compared to other goats within the breed • Takes into account the actual measurements, all ancestral measurements and environment • Not a perfect science, so use as a risk management tool
 College Football BCS Purpose is to identify best college football teams Source of Data : AP ranking USA Ranking Record Strength of schedule etc. Ranking changes as more games are played
 National Goat Evaluation Breed Specific Breed summaries report EPDs. Expected Progeny Difference And Breeding Values The American Boer Goat Association, American Dairy Goat Association, National DHI Program
 Interpreting EPDs Provide a prediction of future progeny performance of one individual compared to future progeny of another individual within a breed for a specific trait. Allow one to compare or rank the genetic superiority of individual animals within a breed for a specific Trait. EPDs are reported in the actual unit that the trait is Measured (Lbs. for growth traits). They can be positive or negative numbers
 High SC bucks sire does with earlier") Effective EPDs: Examples • Scrotal Circumference (SC) High SC bucks sire does with earlier Puberty • Birth Weight (BW) Low BW bucks have more live kids • Average Daily Gain (ADG) Allows choice for replacements or sale of weanlings • Carcass Merit (CM) Allows choice for direct or wholesale Marketing
Effective EPDs: Examples • Scrotal Circumference (SC) High SC bucks sire does with earlier Puberty • Birth Weight (BW) Low BW bucks have more live kids • Average Daily Gain (ADG) Allows choice for replacements or sale of weanlings • Carcass Merit (CM) Allows choice for direct or wholesale Marketing
, adjusted trait performance") Avg. Avg Array of genetic value of an individual (EPD), adjusted trait performance
Avg. Avg Array of genetic value of an individual (EPD), adjusted trait performance
 Difference in Array for two Bucks Full Brothers have a sample 1/2 genetics of buck & of the doe but Not necessarily the exact same genetics
 HOW ABOUT a BREAK?
 How do you use genetic tools in a selection program ? Start by using available information Evaluate Goat Breed Characteristics that Appear to fit your marketing plan
 Average Breeding Values of Six Dairy Goat Breeds Breed Milk Fat Protein Alpine 0 0. 0 La. Mancha -114 -0. 7 -1. 3 Nubian -531 4. 4 -1. 9 Oberhasli -476 -15. 7 -14. 3 Saanen 60 0. 8 1. 9 -6. 4 -. 35 Toggenburg -18
 Alpine La. Mancha Nubian You would expect 114 and 531 pounds less milk From La. Mancha and Nubian as compared to Alpine
 Oberhasli Saanen Toggenburg When compared to Alpine, you would expect 60 lbs more Milk for Saanen, 476 lbs less milk from Oberhasli and 18 lbs less milk from Toggenburg
 Infant Meat Goat Industry • Breed Associations are growing • Members are sending data through membership • Information is increasing • Most selections must come from individual and herd data
, Boer,") Infant Meat Goat Industry • Majority of information reports data on Spanish (brush), Boer, Kiko, San Clemente, Myotonic (fainting) and crossbreds • This data provides ranges for comparison • Emerging breed associations will help supply needed breeding values
Infant Meat Goat Industry • Majority of information reports data on Spanish (brush), Boer, Kiko, San Clemente, Myotonic (fainting) and crossbreds • This data provides ranges for comparison • Emerging breed associations will help supply needed breeding values
 KIKO Spanish Common Meat Goat Breeds BOER San Clemente
 Total Gain") Boer Buck Performance Test (Langston Univ. & Okla. State Univ. , 2004) Total Gain (lbs) 53. 1 27. 5 -68. 2 Average Daily Gain (lbs per day) 0. 63 0. 33 -0. 81 Feed Efficiency (lbs of feed per lb of gain) 6. 8 5. 1 -9. 3 Loin eye area (square inches) 1. 95 1. 29 -2. 54
Boer Buck Performance Test (Langston Univ. & Okla. State Univ. , 2004) Total Gain (lbs) 53. 1 27. 5 -68. 2 Average Daily Gain (lbs per day) 0. 63 0. 33 -0. 81 Feed Efficiency (lbs of feed per lb of gain) 6. 8 5. 1 -9. 3 Loin eye area (square inches) 1. 95 1. 29 -2. 54
 DM intake (lb/day) Avg Daily Gain (lb) Feed") Growth Performance (Langston Univ. , 2003) DM intake (lb/day) Avg Daily Gain (lb) Feed Efficiency (adg/dm feed) Alpine 1. 56 0. 13 0. 339 Angora 1. 05 0. 13 0. 61 Boer 1. 53 0. 19 0. 559 Spanish 1. 13 0. 08 0. 32
Growth Performance (Langston Univ. , 2003) DM intake (lb/day) Avg Daily Gain (lb) Feed Efficiency (adg/dm feed) Alpine 1. 56 0. 13 0. 339 Angora 1. 05 0. 13 0. 61 Boer 1. 53 0. 19 0. 559 Spanish 1. 13 0. 08 0. 32
 Feedlot Range Live Wt 83. 97 45. 12") Carcass Performance (Texas A&M Univ, 1999) Feedlot Range Live Wt 83. 97 45. 12 73. 74 40. 52 Carcass Wt 47. 78 22. 0 42. 33 19. 25 Back Fat . 047 . 012 . 028 . 012 Type 11. 42 3. 25 8. 33 1. 83 Marbling 3. 35 1. 70 3. 06 1. 80
Carcass Performance (Texas A&M Univ, 1999) Feedlot Range Live Wt 83. 97 45. 12 73. 74 40. 52 Carcass Wt 47. 78 22. 0 42. 33 19. 25 Back Fat . 047 . 012 . 028 . 012 Type 11. 42 3. 25 8. 33 1. 83 Marbling 3. 35 1. 70 3. 06 1. 80
 Angora Cashmere Common Fibre Goat Breeds
 Mohair Production & Value Year 2003 Goats Production Price per Value of Clipped Unit Production (1000 hd) (1000 lbs) (US $) (1000 $) 283 2, 174 1. 58 3, 435 2002 283 2, 174 1. 58 3, 432 2001 402 2, 628 4. 00 10, 609 2000 444 2, 896 3. 00 10, 016 1999 700 5, 045 2. 00 12, 562 1998 931 6, 814 2. 00 15, 341
 Putting it Together at this Point • • • Develop Marketing Plan Use Breed Characteristics Evaluate Breeding Values Gather herd performance data Compare Animal Performance Develop Record System
 Genetic Selection or Breeding Plans Interpreting Adjusted Performance Traits These tools predict the average value of genetic ability offered by an animal.
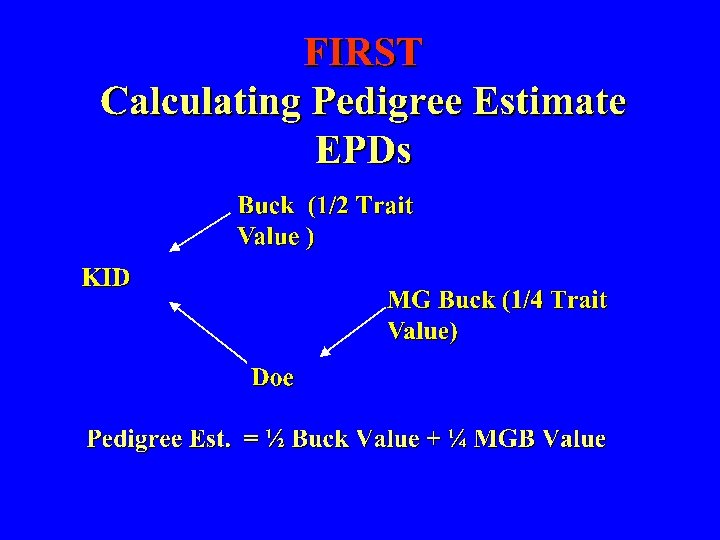
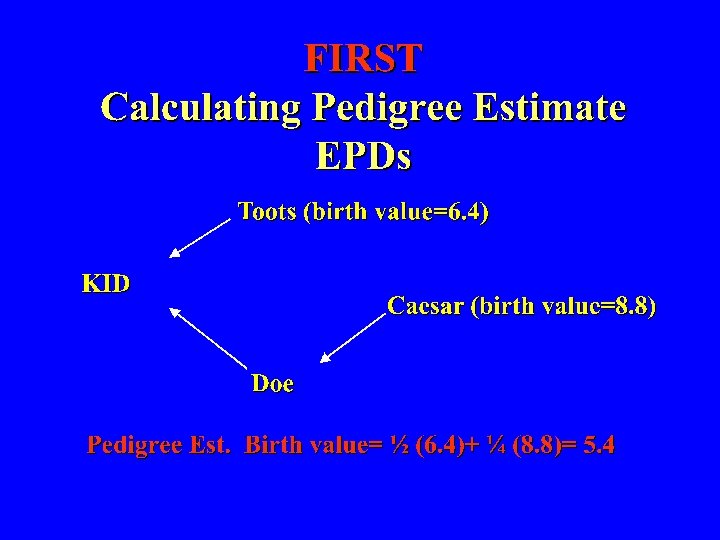
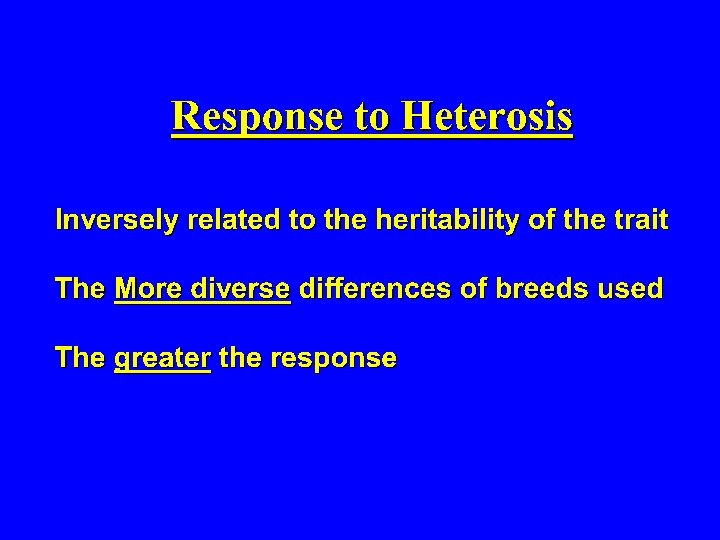
 Available Breeding Tools • First: Pedigree Evaluations • Second: Use of Heterosis • Third: Trait Calculation & Indexes


 100 Different Breeds of Goats Worldwide

 Use Genetic Tools and Breeding Values or EPDs When Available Identify bucks that will contribute to Improvement in economically important traits
") PERFORMANCE BENCHMARKS What is the current level of herd performance? What direction (if any) should the herd move?
PERFORMANCE BENCHMARKS What is the current level of herd performance? What direction (if any) should the herd move?
 Single Most Important Trait In The Goat Industry ? ?
 REPRODUCTION
 THIRD Measure of Production/ Reproduction Lbs kid weaned / doe exposed = % kid crop weaned X avg. wn. Wt. Prorates total lbs. kid weaned across all does maintained Best measure of productivity
 THIRD Lbs. Kid Weaned / Doe Exposed % kid crop Avg. W. W. Lbs. / doe 120 39 46. 8 105 39 40. 9 95 85 39 39 37. 1 33. 2
 Where Can I Find Quality Data ? Individual herd Owners Breed Associations National Dairy Program
 BW=") Establish Benchmark of Production Determine which traits need improvement Select for that trait(s) BW= birth weight WW= weaning weight SC= scrotal circumference Adaptability
Establish Benchmark of Production Determine which traits need improvement Select for that trait(s) BW= birth weight WW= weaning weight SC= scrotal circumference Adaptability
 Identify How to Use Different Bucks for Different Purposes Produce Replacement Does Terminal Cross Bucks Kidding Ease Bucks Carcass Merit Bucks
 §Milk production, Growth rate (size) § vs. Fertility § vs.") Remember Genetic Correlations (Antagonisms) §Milk production, Growth rate (size) § vs. Fertility § vs. Maintenance requirements §Quality vs. Red Meat Yield §Growth rate and Calving ease §Birth weight vs. Yearling weight
Remember Genetic Correlations (Antagonisms) §Milk production, Growth rate (size) § vs. Fertility § vs. Maintenance requirements §Quality vs. Red Meat Yield §Growth rate and Calving ease §Birth weight vs. Yearling weight
 LOW HIGH Production (growth) MODERATE Product (carcass)") Use Trait Qualities Heritability Heterosis Reproduction (fertility) LOW HIGH Production (growth) MODERATE Product (carcass) HIGH LOW
Use Trait Qualities Heritability Heterosis Reproduction (fertility) LOW HIGH Production (growth) MODERATE Product (carcass) HIGH LOW
 A B C D -1. 1 22 18 43. 48 Which is the “BEST Buck”?
 Pick Your Buck B A B=10, W=35, S=39, M=130 B=12, W=42, S=40, M=155 C 5. 7 47 11 90. 09 D -1. 1 22 18 43. 48 B=11, W=38, S=33, M=160 B=15, W=45, S=41, M=170 Brth Ww SC Breed Avg. 11. 5 42 33 M 150
 GOOD BUCK? Don’t Buy a “Billy in a Cart” USE A Source of Quality Information
 Preliminary Selection on Performance Then FOCUS on: -Structural Soundness -Temperament -Scrotal Circumference -ect
 STRUCTURAL SOUNDNESS Skeletal design & how well the bones support the animal’s body Related to Longevity And Adaptability FEET LEGS
 Correct Structures Angle of Pastern is usually the same as Angle of Shoulder
 Breeding Systems § Develop your Marketing Plan § Choose your breeds: Breeding Values and Characteristics In a crossbreeding system, balance the characteristics of the breeds used. § Choose Bucks with performance data. Use EPDs when available. §
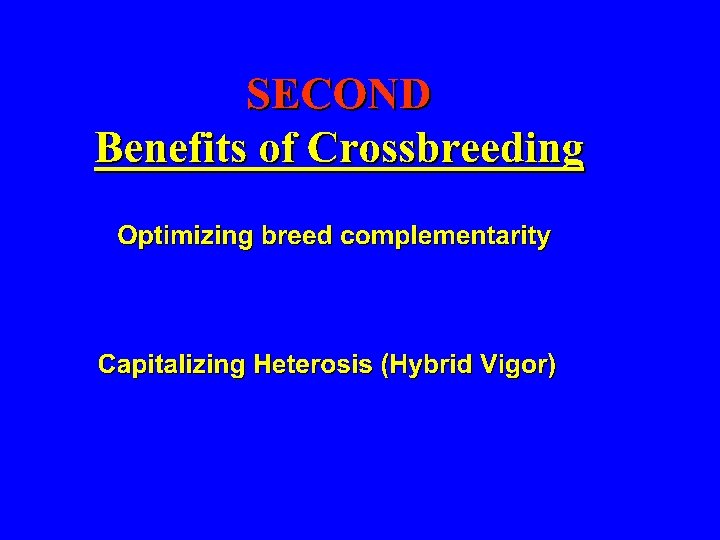
 Crossbreeding Considerations • Systematic crossbreeding has benefits. –Heterosis; Complementarity • Planning is critical. –Use EPDs when available. • Crossbreeding is NOT a substitute for poor management.
 Action Plan Selection Considerations §Use Breeding Values as a selection tool when available. §Target kidding difficulty, growth and doe size genetics to match environment. §Know your market --- what your herd will “produce” Know your market --§Adopt a “consumer-focused” mindset towards carcass “consumer-focused” merit (avoid misfits). §Characterize strengths and weaknesses.
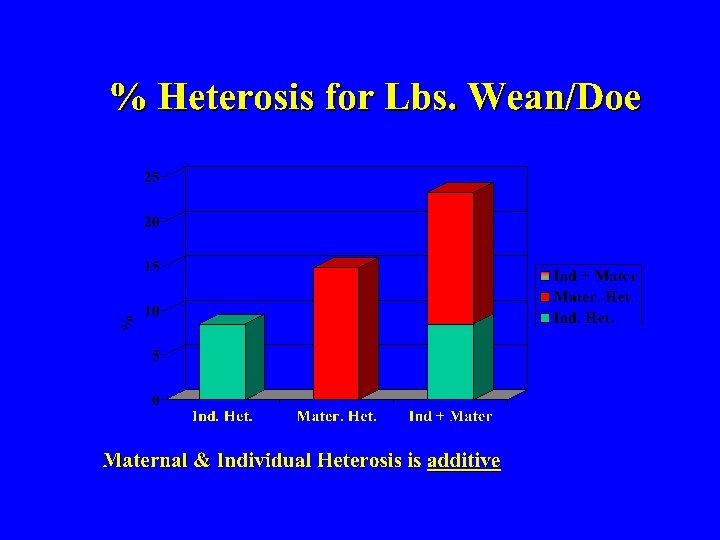
 Consumers will shape our future and set the Pace!