

a3f2c5390ded696cf03a9acd440fd025.ppt
- Количество слайдов: 119
 U. S. Consumer Staple Market Presenters Industry: Target: Wal-Mart: Costco: Jim Shi Chris Yoo Doug Huxter Wendy Choi
 Consumer Staples u Definition: – Include any company that manufactures and sells food/beverages, tobacco, prescription drugs and household products – Includes following industry u Food & Drug Retailing u Food & Beverage & Tobacco u Household & Personal Products – E. g. Proctor & Gamble, Coca Cola, Wal-mart
 Types of Retailers u Department stores – Wide variety of products – Ex. Sears u Demographics – Stores aimed at certain segment – Ex. Gap u Discounters – Membership club or low priced variety store – Ex. Costco Wal-mart
 Porter’s 5 Forces u Low Threat of new entrants: – Large concentration of retail chain stores – Decreasing number of independent retailers – Barriers to entry u Favorable supply contract: centralized buying power u Favorable lease contract u Requires large amounts of capital
 u Suppliers’ power: limited power to negotiate relatively to large") Porter’s 5 Forces (cont’) u Suppliers’ power: limited power to negotiate relatively to large retail chain stores u Buyers’ power: – Individuals with limited purchasing power – collectively, customers can demand high quality products at a bargain price;
Porter’s 5 Forces (cont’) u Suppliers’ power: limited power to negotiate relatively to large retail chain stores u Buyers’ power: – Individuals with limited purchasing power – collectively, customers can demand high quality products at a bargain price;
 u u Substitute threat: high, products offered in one retail") Porter’s 5 Forces (cont’) u u Substitute threat: high, products offered in one retail chain are available in others Rivalry: slow market growth leads to fierce price competition
Porter’s 5 Forces (cont’) u u Substitute threat: high, products offered in one retail chain are available in others Rivalry: slow market growth leads to fierce price competition
 Historical Trend
 Chart Made Based on Data Collected from: Title: Retail and Food Services Series ID: RSAFSNA Source: U. S. Department of Commerce : Census Bureau Release: Advance Monthly Sales for Retail and Food Services Seasonal Adjustment: Not Seasonally adjuted Frequency: Monthly Units: Millions of Dollars Retrieved on Nov. 15/2006 at: http: //www. forecasts. org/data/data/RSAFSNA. htm
 Seasonal Cycle
 Company Size by Revenues
 Retail Metrics u Revenues, net income and profit margins u Number of stores u Same store sales u Sales per square foot u Target market
 Driving Force Overview u Low priced goods u Location u Product line u Market cycle (economy), Employment u Consumer confidence level u Natural disaster
 Low-priced Goods u Efficient distribution network u Constant search for low-cost goods – Import goods from countries with low cost labour u Large volume discount u Strategically located stores u Flexible workforce – Part-time – Non-unionized vs. unionized
 Location u Store density u Urban vs. Suburban u Land value of location
 Product Line u Price vs. quality – High-end: Urban Fare, Nordstroms – Mixed: the Bay, Target – Low-end: Wal-Mart u Variety of goods sold – Primarily grocery store (Top Food, Safeway) – Primarily hard products (Best Buy, Home Depot) – Primarily soft products (the Bay, the Brick)
") US Economy u Indicator slowing economy – Cooling housing market slowing economy (housing starts) – High energy price – Stabilized interest rates – Household income
US Economy u Indicator slowing economy – Cooling housing market slowing economy (housing starts) – High energy price – Stabilized interest rates – Household income
 Housing Starts
 Increasing Oil Price
 Interest Rates
 Industry Returns and Interest Rate u 1 yr gain after the Fed stop raising rates Financials 24. 7% Health Care 23. 4% Consumer staples 17. 6% S&P 500 9. 9% Source: Citigroup NOTE: Based on average change in the 12 months after final rate increase, 19832000
 Personal Income
 Unemployment Rate
 Consumer Expenditure
 Composition of Consumer Expenditure
 Consumer Confidence Index:
 Natural Disaster u Hurricanes – Ex. 2005 August Hurricane Katrina u Earthquake u Rain – Ex. Rains increase the amount of turbidity level of tap water
 Target® Expect More. Pay Less. ®
 Company Overview • Listed on New York Stock Exchange • Part of the S&P 100, 500, and 1500 Super Comp. Russell 1000. • Market Cap: 50. 01 B • Stock Price 52 week range for 2006: 44. 70 -60. 34 • Shares Outstanding: 874, 040, 000 • Dividend Yield: 0. 48 (0. 80%) • Price Earning Ratios: 19. 51 • EPS: 2. 98
 Stock Price History
 Stock Price in 06
 Company M & A’s • From 1960 -80’s – Lechmere, J. L. Hudson Company, Mervyn’s, Ayr-Way, Fed Mart, Gemco, • From 1990 -00’s – Marshall Field’s, Fedco, • Most recently: – June 9, 2004 • Announced sale of Marshall Field’s Chain, and several Mervyn’s stores
 Company Profile • Large-format general merchandise discount stores in the United States – Target & Super. Target stores. • Assortment of general merchandise and limited assortment of food items. – Target-general merchandise – Super. Target-a line of food items along with general merchandise. • The credit card operation represents an integral component of its core retail business. • The company also operates Target. com, an online business.
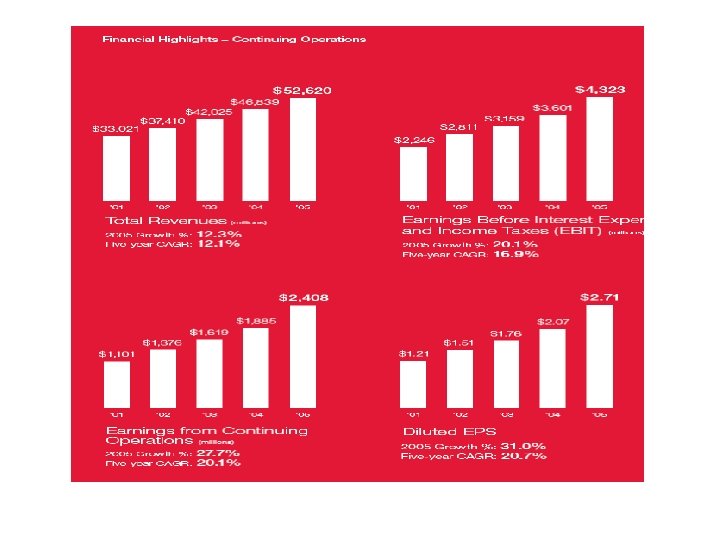
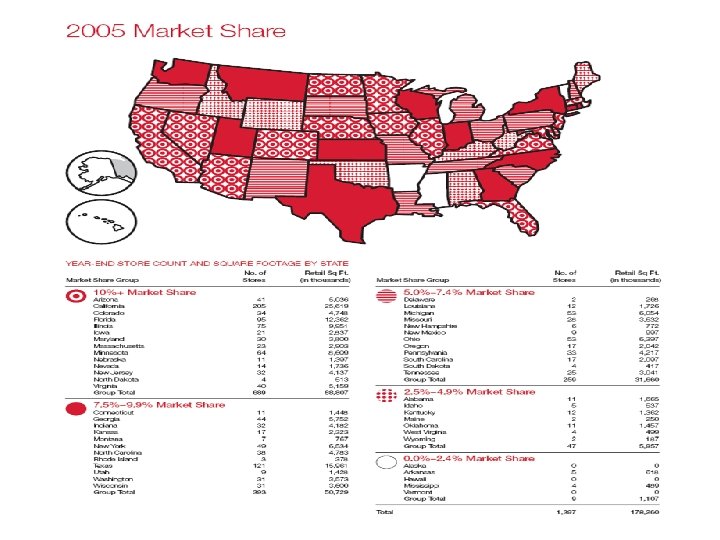
 Company Profile • The company now has more than 1, 440 stores in 47 states, and employs more than 300, 000 employees. • Year ending 2005, Target reaches an important milestone; 50 billion dollars in sales in a single year. • Target’s Customers – – Median age of 41 Median household income of approx. $58 k Approx. 43% have children at home About 43% have completed college
 Management • Robert J. Ulrich – University of Minnesota, BA, 1967 – Chairman and C. E. O for 12 years – With the company for 35 years – Held various positions – Annual compensation $10. 1 million • Gregg W. Steinhafel – President for 7 years – Annual compensation $2. 7 million
 Sales per Square Foot Inventory") Key Figures • • • Same-Store Sales Growth (“Comps”) Sales per Square Foot Inventory Turnover Gross Profit Margin Debt/Equity Ratio
Key Figures • • • Same-Store Sales Growth (“Comps”) Sales per Square Foot Inventory Turnover Gross Profit Margin Debt/Equity Ratio
 Same-Store Sales Growth
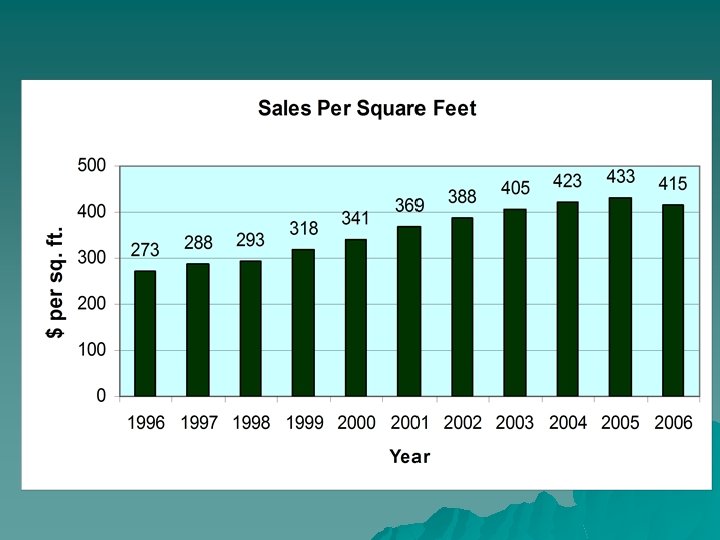
 Sales per Square Foot
 Inventory Turnover
 Gross Profit Margin
 Debt/Equity Ratio
 Driving Factors of Staple Industry • Low COGS achieved through distribution and supply chain • Image • Location • Product line
 Low COGS achieved through distribution and supply chain • Significant investments in supply chain and in leading-edge technologies. • Current distribution network includes 23 regional distribution centers and 3 import warehouses. – Plans to add 2 distribution centers and 3 import warehouses in the next 2 years • Derive operating efficiencies through 6 Sigma@Target and outsourcing a variety of business functions.
 Image • Target’s store are: – Inviting and easy-to-shop, – Clean, bright, safe and accessible, and – Elaborately designed to excite their guests • Corporate Responsibility
 Location • Currently not pursuing international expansion, still considers potential continued growth in the U. S. • By 2010, plans to reach approx. 2000 stores. • Concentrate store growth in major metropolitan areas.
 Product line • Assortment of general merchandise • Exclusive brands that make Target a destination for highquality • Offers pharmaceutical products
 Firm Strategy • Store Growth Nationally; complemented by innovative design and support • Increase the mix of competitively priced consumables and commodities • Expand food offerings in general merchandise stores • Innovation is key to expansion and growth
 Store Growth Pattern • In 2006, as of Oct 28 they built 75 more Target General Merchandise stores, and 19 more Super. Target stores, totaling 1494 stores.
 Recent Selling of Shares From Within In 2006: • Oct 9 th Gregg W. Steinhafel (President) sells shares totaling $6. 2 million. • Oct 17 & 18 th Robert Ulrich Jr. (C. E. O) sells approx 700, 000 shares totaling $32. 1 million. • Nov 15 th Douglas A. Scovanner (Executive Vice President & C. F. O. ) sells shares totaling $2. 7 million.
 Recent Selling of Shares from Outsiders • Buffett’s Berkshire Hathaway Inc. owns 745, 700 shares of Target, compared with 5. 5 million shares in June.
 Recommendation
 BUILDING SMILES
 WAL-MART OVERVIEW u u u u Listed on the NYSE Part of the Dow Jones Indust. Ticker: WMT Market Cap: $200 Billion Stock Price: $47. 50 Dividend yield: 1. 4% Shares Outstanding: 4. 17 Billion P/E ratio: 18. 17
 5 Yr. Wal-Mart Price
 WAL-MART vs. S&P
 Number of Shares
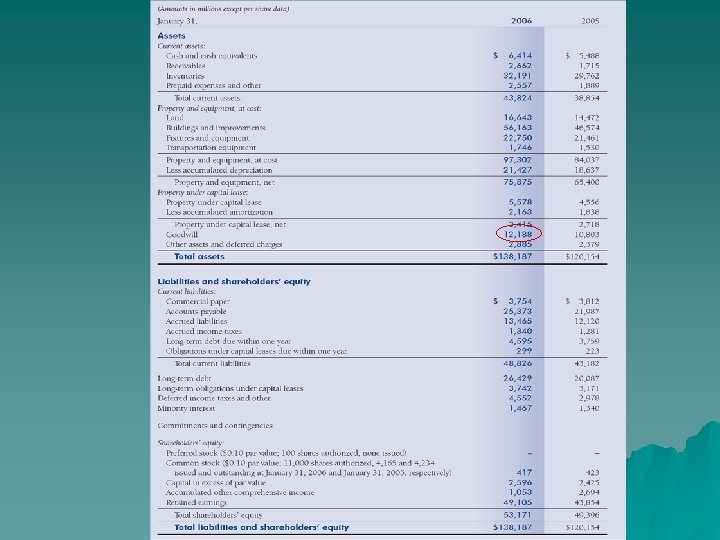
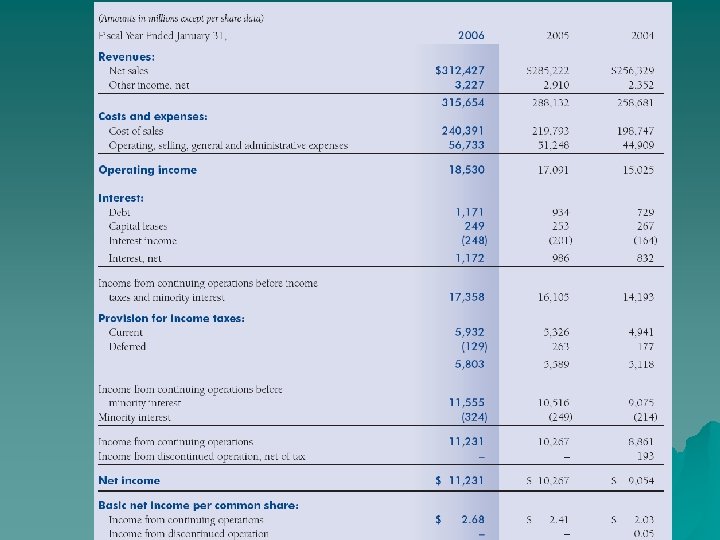
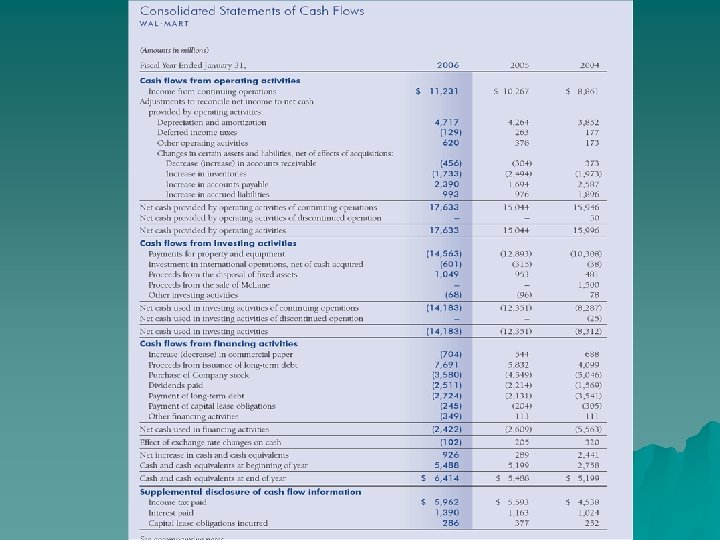
 Company Overview u Largest Company in the world u Employs over 1. 8 million associate u Sales of $312 billion in 2005 176 Million Shoppers visit Wal-Mart Every week u
 WAL-MART History Founded in 1962 in Arkansas by Sam Walton u Wal-Mart went public in 1970 u u u By the end of the 1980’s WAL-MART had over 2, 200 locations. Today WAL-MART has over 6100 stores – 3856 In the USA – 2290 International stores
 Lee Scott u Became CEO in 2000 u u u Has been with Wal-Mart since 1978 Serves on the board of directors Compensation $5 million in cash and $5 million in stock options Degree in Business from Pittsburg university Share value has dropped 22% since he has been running the company
 Chairman of the board u u u Robert Walton Chairman of the board Son of the founder Only Walton family member still on the board of directors Owns over 2 million shares in the company Walton Family still has large stake in the company
 WAL-MARTS STRATEGY u Improve company image – Improve relationship with associates and surrounding communities – Become a leading company in sustainability – Provide a diverse variety of products at a great price
 Improving Company Image u u Pays below average wages but creates over 250, 000 new jobs a year Low cost health care coverage of $3 per month Created an employment advisory council to improve standards for minority groups Created job & opportunity zones where the company provides local business with additional training
 WAL-MART staying ahead of the curve u u u To Be Supplied 100% By Renewable Energy To Create Zero Waste To Sell Products That Sustain Our Resources & Environment
 Product Line u Mainly a general merchandise chain – Including electronics, clothing, auto parts, food, gift cards, financial services, pharmaceutical products u Moving into food products within North America – Through Super. Centers and Neighborhood Markets
 WAL-MART’S growth Strategy u Continue to diversify the product line offered at domestic locations
 Wal-Mart’s Divisions u Discount centers – Sales general merchandise and food products u Sam’s Club – A business to business operation u International operations – Focuses is on South America and Asia
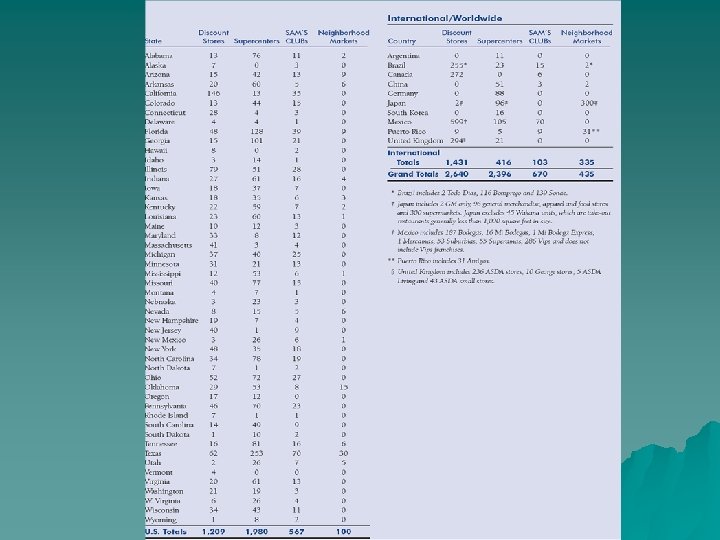
 WAL-MART Domestic Market u Four Major Store types 1. Discount stores -1, 209 – Sq. ft. 102, 000 2. Supercenters – 1980 – Sq. ft. 187, 000 3. Sam’s Club – 567 – 4. Sq. ft. 129, 000 Neighborhood Markets – 100 sq. ft. 42, 000
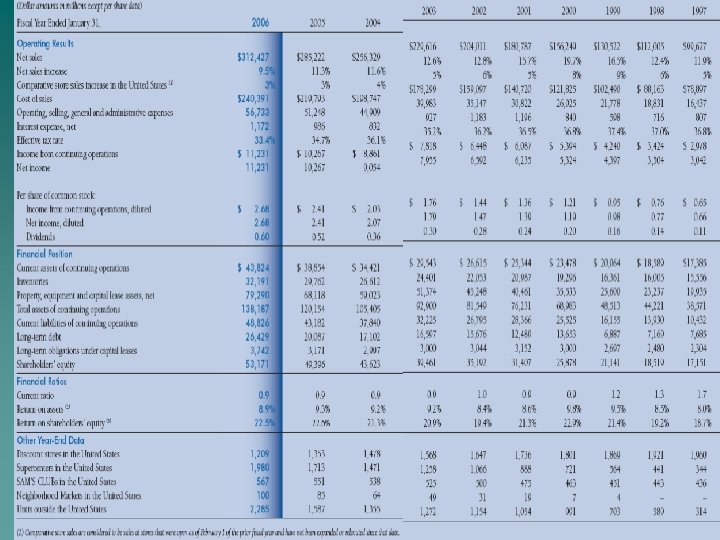
 SALES BREAKDOWN 2006 Net Sales 2005 Percent of total Percent Increase 67% 9% $191, 826 7% 37, 119 Net Sales Wal-Mart Stores $ 209, 910 Sam's Club 39, 7 98 International 62, 7 19 20% 11% 56, 277 Total $ 312, 427 100% 10% $285, 222 13% 2004 Percent of total Percent Increase Net Sales Percent of total 67% 10% $174, 220 68% 8% 34, 53 7 14% 20% 18% 47, 57 2 19% 100% 11% $256, 329 100% 13%
 Wal-Mart’s sales
 Same Store Sales
 Key Ratio
 Key Ratios
 Key Ratios
 WAL-MART
 WAL-MART International expansion u. Has had trouble In the process of selling off store in Germany – Selling operations in Korea –
 WAL-MART International expansion 2006 u Has been very aggressive in South America & Asia – – – In 2004 Acquired Supermercados in Brazil adding another 118 stores Bought a controlling share of Sonae in Brazil adding another 139 locations Seiyu in Japan added 398 new locations
 WAL-MART Domestic Locations Traditionally located in small towns and in suburban areas u Now trying to move into more urban areas and creating larger stores with a greater selection of products u Experimenting with food only locations u
 WAL-MART Supply Chain u Over 60, 000 suppliers u Shares vital information with suppliers u Owns the worlds largest privately held satellite system used to track inventory and store sales Most advanced distribution centers u
 WAL-MART Supply Chain Highlights u One of America’s Largest truck Fleet
 Suggestion Hold for long-term slow growth Reasons: Solid fundamentals Understands what needs to be changed Planning for the future by becoming more sustainable
 Company Overview u Listed on Nasdaq u Part of the S&P 500, Russell 1000 u Ticker Symbol: COST u Industry: Discount Variety Store
 Company Overview Stock Price: $53. 40 u Day High: $53. 62 u Day Low: $52. 88 u 52 Week High: $57. 94 u 52 Week Low: $46 u u *as of November 17 th, 2006 EPS: 2. 30 u P/E: 23. 25 u Market Cap: 24. 99 B u Dividend Yield: 1% u Shares Outstanding: 467. 97 M u
 Stock Price History
 Costco Stock Price vs S&P 500
 Company Overview u No. 28 in Fortune 500 u 4 th largest retailer in USA u 7 th largest in the world u 82 fewer stores than Sam’s Club but generate $20 B more in sales
 Company History u 1948: Sol Price opened Fed Mart u 1976: Opened first store as Price Club in San Diego u 1983: Founders James Sinegal and Jeffrey Brotman opened first warehouse in Seattle u 1993: Costco and Price Club merged to Price. Costco u 1994: Founders of Price Club left Costco u 1997: Company name was changed to Costco Wholesaler
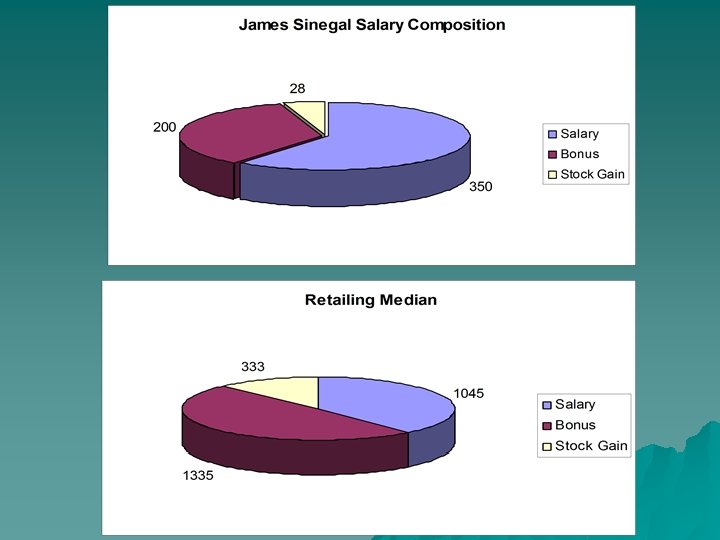
 James Sinegal, CEO & co-founder u u u CEO from start of the company Earned $583, 000 in salary and bonuses Business Administration graduate of San Diego State University Leads low-cost lifestyle Named one of 100 most influential people in Time Magazine
 Jeffrey Brotman co-founder & chairman u u u Undergraduate degree in Political Science and law degree from University of Washington 3 rd generation of family participating in wholesaling and retail merchandising Former director of Starbucks and Sweet Factory
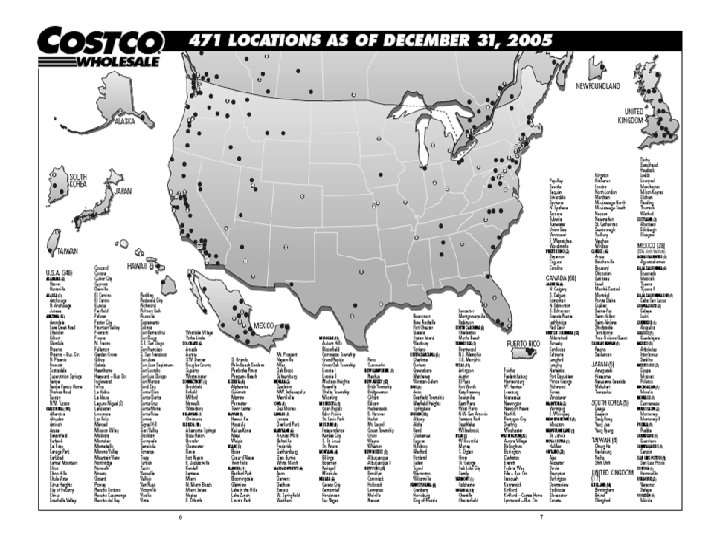
 Costco Today u Aug 2006: 451 locations in North America u Several locations in South Korea, Japan, Taiwan, UK u Employs approximately 118, 000 fulltime and part-time staff
 Net Sales by Category
 Average P/E Ratio
 Company Target $307 Nordstrom $369 Home Depot $377 Wal-Mart*") Sales per square foot (Annual) Company Target $307 Nordstrom $369 Home Depot $377 Wal-Mart* $438 BJ's $445 Sam's Club* $552 Costco $918 Best Buy $941
Sales per square foot (Annual) Company Target $307 Nordstrom $369 Home Depot $377 Wal-Mart* $438 BJ's $445 Sam's Club* $552 Costco $918 Best Buy $941
 Inventory Turnover
 Dividend Yield Per Share
 Debt to Equity Ratio
 Gross Profit Margin
 Low cost of goods achieved through distribution and supply chain 2)") Driving factors 1) Low cost of goods achieved through distribution and supply chain 2) Image 3) Location 4) Product line
Driving factors 1) Low cost of goods achieved through distribution and supply chain 2) Image 3) Location 4) Product line
 Low cost of goods achieved through distribution and supply chain u Volume purchasing u Purchasing directly from manufacturers u Pre-paying vendors to receive payment discounts u Minimizing stocking fees
 Location No elaborate facilities and rent is lower since it is not in a prime location u No lights on most days to save electricity. u
 Image u Known as the big box retailer that treats employees well u Return policy – No deadlines
 Product line u Limiting products to fast selling models, sizes and colours – Carry only 4000 items u Rapid inventory turnover u No-name products can be marked by more than 14%; private items 15%
 Employment u Average pay is $17 per hour – 42% higher than rivals – 3 rd lowest turnover rate in retail industry u 92% of health care costs covered
 u Entrances and Exits are controlled") Low Shrinkage u (under 0. 20% for 2005) u Entrances and Exits are controlled u Membership format limits theft u Good relations among employees limits internal theft
Low Shrinkage u (under 0. 20% for 2005) u Entrances and Exits are controlled u Membership format limits theft u Good relations among employees limits internal theft
 Cost Minimizing Strategy u Minimal advertising expenses • Reduces costs by 2% per year • Limited to advertising new warehouse openings • direct mail marketing to prospective new members • direct marketing programs to existing members promoting selected merchandise
 Cost Minimizing Strategy u No Frills – No signs saying what's in what aisle. – No bags. – No Visas or Master. Cards are accepted (avoiding service charges)
 Plans for the Future u Opening 25 -30 more stores across the USA in fiscal 2006 u Opening 7 more stores in England Mexico u Expanding to several hundred more Kirkland Signature items in the next 5 years to include diapers, cosmetics, etc. u Open Costco Home stores
 Current News u Glass Ceiling for Women? – Suit filed in 2004 claims discrimination against women – Company discourages women from applying for mgmt positions and are not considered for promotion – Nov 15, 2006: class action suit filed to represent 700 women.
 Recommendation Hold u u large amounts of cash on hand Paying off a large portion of debt Dividends being paid out Shares being repurchased