

a615d5796e2cf051d77ced1a36de717f.ppt
- Количество слайдов: 51
 Two Models of Medical Error Reduction Programs in Radiation Oncology by Ed Kline Rad. Physics Services LLC Albuquerque, NM © RPS
 Introduction • Patient safety – Freedom from accidental injury due to medical care, or absence of medical errors 1, 2 or – Absence of misuse of services 3, 4 • In radiation oncology, variety of injuries and errors can occur in the diagnostic imaging or therapeutic treatment delivery processes 1 Hurtado M, Swift E, Corrigan JM, eds. Envisioning the National Health Care Quality Report. Washington, DC: National Academy of Sciences; 2001. 2 Mc. Nutt R, Abrams R, Arons D. Patient Safety Efforts Should Focus on Medical Errors. JAMA. 2002; 287(15): 1997 -2001. 3 Department of Health and Human Services. The Challenge and Potential for Assuring Quality of Health Care for the 21 st Century. Washington, DC: Department of Health and Human Services; 2000. 4 The President's Advisory Commission on Consumer Protection and Quality in the Health Care Industry. Quality First: Better Health Care for All Americans; 1998.
 Introduction • This presentation describes the design, implementation, and results of two QA/medical error reduction programs • Both programs are designed for – Reducing preventable systems-related medical errors (i. e. , sentinel events, “near misses”) – Preventing violations of regulatory requirements (i. e. , State/NRC) – Ensuring compliance with recommended standards (i. e. , JCAHO, ACRO, etc. )
 report 5 – Focused a great deal of") History • Institute of Medicine (IOM) report 5 – Focused a great deal of attention on the issue of medical errors and patient safety – 44, 000 to 98, 000 deaths per year in U. S. hospitals each year as the result of medical errors – 10, 000 deaths per year in Canadian hospitals – Exceeds annual death rates from road accidents, breast cancer, and AIDS combined in U. S. 5 To Err is Human: Building a Safer Health System. Institute of Medicine (IOM). The National Academies (11/29/99).
History • Institute of Medicine (IOM) report 5 – Focused a great deal of attention on the issue of medical errors and patient safety – 44, 000 to 98, 000 deaths per year in U. S. hospitals each year as the result of medical errors – 10, 000 deaths per year in Canadian hospitals – Exceeds annual death rates from road accidents, breast cancer, and AIDS combined in U. S. 5 To Err is Human: Building a Safer Health System. Institute of Medicine (IOM). The National Academies (11/29/99).
 History • IOM Costs 6 – Approximately $37. 6 billion per year – About $17 billion are associated with preventable errors – Of that $17 billion, about $8 to $9 billion are for direct health care costs 6 To Err is Human: Building a Safer Health System. Institute of Medicine (IOM). National Academies (11/29/99).
 History • Federal initiatives 7 taken by former President Clinton on 2/22/00 based on IOM recommendations 8 – Comprehensive strategy for health providers to reduce medical errors – Creation of external reporting systems to identify and learn from errors so as to prevent future occurrences – Creation of national patient safety center to set goals – At least 50% reduction of errors over 5 years 7 Announced by President Clinton and senior administration officials in James S. Brady Press Briefing Room on February 2, 2000. 8 Recommendations issued in report entitled To Err is Human: Building a Safer Health System by the Institute of Medicine (IOM) of the National Academies (11/29/99).
 History • Key legislation – Patient Safety Quality Improvement Act 9 • Certifies patient safety organizations in each State to collect data and report on medical errors – State Patient Safety Centers • In past 5 years, 6 states have enacted legislation supporting creation of state patient safety centers • 5 of the 6 states now operate patient safety centers • Separate mandatory reporting systems for serious adverse events • Centers are housed within state regulatory agencies 9 Reducing Medical Errors, Issue Module, Kaiser EDU. org, Accessed through www. kaiseredu. org.
 History • Patient safety centers include 10 – The Florida Patient Safety Corporation – The Maryland Patient Safety Center – The Betsy Lehman Center for Patient Safety and Medical Error Reduction (Massachusetts) – The New York Center for Patient Safety – The Oregon Patient Safety Commission – The Pennsylvania Patient Safety Authority 10 State Patient Safety Centers: A New Approach to Promote Patient Safety, The Flood Tide Forum, National Academy for State Health Policy, 10/04, Accessed through www. nashp. org.
 History • State reporting: mandatory vs voluntary 11 – Mandatory reporting: Colorado, Florida, Kansas, Nebraska, New York, Ohio, Pennsylvania, Rhode Island, South Carolina, South Dakota, Tennessee, Texas, Washington – Voluntary reporting: District of Columbia, Georgia, New Mexico, North Carolina, Oregon, Wyoming – Considering new legislation: Arizona, California, Maine – Mandatory reporting but considering new legislation: Massachusetts, New Jersey 11 National Conference of State Legislatures, National Academy for State Health Policy, 12/03, Accessed through www. nashp. org.
 History • JCAHO revises standards – Patient safety standards effective 7/1/01 – Requires all JCAHO hospitals (5, 000) to implement ongoing medical error reduction programs – Almost 50 percent of JCAHO standards are directly related to safety 12 Patient Safety - Essentials for Health Care, 2 nd edition, Joint Commission on Accreditation of Healthcare Organizations. Oakbrooke Terrace, IL: Department of Publications, 2004.
 History • JCAHO’s sentinel event policy 13 – – – – Implemented in 1996 Identify sentinel events Take action to prevent their recurrence Complete a thorough and credible root cause analysis Implement improvements to reduce risk Monitor the effectiveness of those improvements Root cause analysis must focus on process and system factors Improvements must include documentation of a risk-reduction strategy and internal corrective action plan – Action plan must include measurements of the effectiveness of process and system improvements to reduce risk 13 Sentinel Event Policies and Procedures - Revised: July 2002, Joint Commission on Accreditation of Healthcare Organizations, Accessed through www. jcaho. org/accredited+organizations/long+term+care/sentinel+events/index. htm.
 History • JCAHO’s Office of Quality Monitoring – Receives, evaluates and tracks complaints and reports of concerns about health care organizations relating to quality of care issues – Conducts unannounced on-site evaluations • JCAHO and CMS agreement 14 – Effective 9/16/04 – Working together to align Hospital Quality Measures (JC’s ORYX Core Measures and CMS’ 7 th Scope of Work Quality of Core Measures) 14 Joint Commission, CMS to Make Common Performance Measures, Joint Commission on Accreditation of Healthcare Organizations, Accessed through www. jcaho. org/accredited+organizations/long+term+care/sentinel+events.
 • Contracted by") History • CMS quality incentives 15 – Quality Improvement Organizations (QIOs) • Contracted by CMS to operate in every State • 67% of QIOs perform independent quality audits – Premier Hospital Quality Initiative • 3 -year demonstration project recognizes and provides financial reward • CMS partnership with Premier Inc. , nationwide purchasing alliance • Hospitals in top 20% of quality for specific diagnosis get financial reward – Top decile gets 2% Diagnosis Related Group (DRG) bonus – 2 nd decile get 1% DRG bonus • Hospitals performing below 9 th and 10 th decile baseline levels, DRG payments reduced 1% and 2%, respectively 15 Medicare Looks for Ways to Boost Quality Care Comments Sought on New Plan for Quality Improvement Organizations, Centers for Medicare & Medicare Services (CMS), Accessed through www. cms. hhs. gov.
History • CMS quality incentives 15 – Quality Improvement Organizations (QIOs) • Contracted by CMS to operate in every State • 67% of QIOs perform independent quality audits – Premier Hospital Quality Initiative • 3 -year demonstration project recognizes and provides financial reward • CMS partnership with Premier Inc. , nationwide purchasing alliance • Hospitals in top 20% of quality for specific diagnosis get financial reward – Top decile gets 2% Diagnosis Related Group (DRG) bonus – 2 nd decile get 1% DRG bonus • Hospitals performing below 9 th and 10 th decile baseline levels, DRG payments reduced 1% and 2%, respectively 15 Medicare Looks for Ways to Boost Quality Care Comments Sought on New Plan for Quality Improvement Organizations, Centers for Medicare & Medicare Services (CMS), Accessed through www. cms. hhs. gov.
 History • CMS quality incentives – CMS consumer website • Beginning in 4/05, hospital quality data available at www. Hospital. Compare. hhs. gov or 1 -800 -MEDICARE – Data indicators 16 • In 2006, hospitals reporting quality data to Medicare receive 3. 7% increase in inpatient payments • Non-reporters receive 3. 3% increase • Data covers 10 quality indicators for cardiology • Plans are to expand into other disciplines 16 Medicare to Pay Hospitals for Reporting Quality Data, Modernhealthcare, accessed through www. modernhealthcare. com.
 History • CMS quality incentives – Physician Voluntary Reporting Program 17 • Beginning in 1/06 • Physicians voluntarily report information to CMS – 36 evidence-based measures – Information collected through Healthcare Common Procedure Coding System (HCPCS) • CMS will provide feedback on physician’s level of performance 17 Medicare Takes Key Step Toward Voluntary Quality Reporting for Physicians, Centers for Medicare & Medicare Services (CMS), Accessed through www. cms. hhs. gov.
 Radiation Oncology Errors • Not well established • No comprehensive numbers available for number of errors resulting in death 18 • Reported error rates range 0. 1% to 0. 2% of fields treated 17 • Studies not relying on self-reporting show actual rates of up to 3%17 18 French, J, Treatment Errors in Radiation Therapy. Radiation Therapist, Fall 2002, Vol. 11, No. 2; 2002.
 Significant Medical Events in Radiation Oncology Incidents Author Time Interval Event Total Patients Panama Vatnisky S, et al. , Radiother Oncol. , 2001 Overdose 23 UK Mc. Kenzie AL, British Institute of Radiology, 1996 1988 Overdose (+25%) 207 Teletherapy activity calculation error UK Mc. Kenzie AL, British Institute of Radiology, 1996 1982 -1991 Underdose (-25%) 1, 045 Misunderstanding of algorithm in Tx planning computer Overdose (up to 166%) 50 Several - deaths or serious injury Miscalibration of dosimeters; incorrect calc techniques, calibration of Tx machines, and use of Tx machines 1944 -1999 Overdose 13 - Deaths Incorrect calibrations, incorrect computer programming, equipment maintenance/repair negligence World IAEA, 2000 Ricks CR, REAC/TS Radiation Incident Registry, 1999 8 - Deaths 15 - Severe late complications Wide US Outcome (OH - 10, PA - 1, TX - 2 ) 1 – Serious Injury (WA) Direct Causes Incorrect entry of shielding blocks in Tx planning computer
 Medical Error Rates in Radiation Oncology – Table 1 Study Author Time Interval Crse of Tx Total Tx Fx’s Total Tx Fields UK Sutherland WH, Topical Reviews in Radiother and Oncol, 1980 US US Tx Over 6 years between 1970 -1980 Swann-D'Emilia B, Med Dosime, 1990 1988 -1989 87 misadministrations <0. 1%: based on no. of fields Tx’ed Muller-Runkel R, et al. , 1991 1987 -1990 - Before R&V: 39 major, 25 minor errors 90% overall reduction Error Specifics - Potential mistakes (found in checks) 4, 122 Error Rate 2. 1% - 4% per year - Potential error of 5% from Rx dose 742 - After R&V: 4 major, 5 minor errors Leunens G, et al. , Radiother Oncol, 1992 9 months Data transfer errors: 139 Affected 26% of of 24, 128 overall treatments Sig. potential 5% Italy Calandrino R, et al. , Radiother Oncol, 1993 9/91 -6/92 Out of 890 calculations: - 33 total errors 3. 7%: total error rate - 17 serious errors Italy Valli MC, et al. , Radiother Oncol, 1994 10. 5%: incorrect or missing data
 Medical Error Rates in Radiation Oncology – Table 2 Study Author Time Interval Crse of Tx Total Tx Fx’s Total Tx Fields Tx Field Errors Noel A, et al. , Radiother Oncol, 1995 5 years Error Specifics Of 7519 treatments: 79 total errors Error Rate 1. 05%: errors per treatment - Of 79, 78 are human origin - Of 78, 39 would have > 10% dose Δ US Kartha PKI, Int J Radiat Oncol Biol Phys, 1997 US Macklis RM, et al. , J Clin Oncol, 1998 1 year 1, 925 93, 332 168 US Fraas BA, et al. , Int J Radiat Oncol Biol Phys, 1998 7/969/97 ~34, 000 ~114, 000 Belgium Barthelemy. Brichant N, et al. , Radiother Oncol, 1999 Canada Yeung TK, Abstract. NEORCC, 1996 Error rates per patient setup 1. 4%: linear accelerators 3%: cobalt units 15%: causally related 0. 18%: reported to R&V error rate/year 0. 44%: Tx fractions 0. 13%: Tx fields 6 months 3. 22%: of all delivered Tx fields had at least 1 error 1994 3. 3%
 Medical Error Rates in Radiation Oncology – Table 3 Study Author Time Interval Crse of Tx Total Tx Fx’s Total Tx Fields Tx Field Errors Error Specifics Error Rate Canada Pegler R, et al. , Abstract-Clin Invest Med, 1999 2 years 0. 12 - 0. 06% US Pao WJ, et al. , Abstract-ACSO, 2001 6 years 17, 479 avg. /yr. 0. 17% avg. /year per patient Canada French J, Radiat Ther, 2002 1/1/969/31/01 11, 355 195, 100 483, 741 631 177 total incidents -20: correctable 0. 13%: overall (fields tx’ed incorrect/ total no. fields tx’ed) - 129: noncorrectable and clinically sig. 0. 32%: errors/fraction - 28: noncorrectable and potentially clinically sig. 0. 037%: errors/field 555 total errors 1. 97%: error rate per patient Canada US Grace H, et al. , Int J Radiat Oncol Biol Phys 1/1/9712/31/02 28, 136 Klein E, et al. , J of Appl Clin Med Phys, 2005 30 months 3, 964 - 87 (15. 6%): incorrect programming in R&V 0. 48 to <0. 1%: for diff methods of detection w/R&V
 Objective of a “QA/Medical Error Reduction Program” Objective was to provide a unified, total quality management and continuous improvement program for minimizing the occurrence of errors identified in the patient treatment process and regulatory arena. The program was designed for 17 geographically dispersed radiation oncology clinics located in 9 states of varying regulatory oversight and enforcement philosophy.
 Design of QA/Medical Error Reduction Program • Established a consistent set of of QA procedures for the 17 facilities following the strictest state requirements in which each facility resides. • Analyzed the process of delivering radiation therapy to identify the steps used in all aspects of this modality. • Developed a reporting codification system for errors detected, and the appropriate forms and procedures for reporting these errors. This includes a staging system for classifying the importance of an error.
 Design of QA/Medical Error Reduction Program • Provided an internal feed-back mechanism of corrective action to close the loop – Independent review/recommendations for corrective action regarding all self-identified significant errors/violations • Produced a quarterly report summarizing errors/violations – Perform trend analysis of reported errors at center and company levels – Recommended company wide corrective actions based on results of trend analysis

 Unintended Deviation Reporting Process
 The Unintended Deviation System • The name was selected to convey an unintentional error discovered either by the one having committed the error or by another physician/staff member. • Management emphasizes that self-identification and reporting of errors will not result in disciplinary action. • Provides for identification, evaluation, and documentation of all errors within the process of radiation therapy delivery. • Suggests possible causes and solutions for correction of individual errors as well as programmatic errors
 Definition - Unintended Deviation • An unintended deviation is any error in the planned patient simulation, setup, treatment, or data entry in these processes. • Any deviation from the planned course of treatment • Any error in calculation • Any missing or incomplete information • Any failure to perform or follow required quality assurance and radiation safety policies or procedures • Unintended deviations can be classified as: – Pre or post-tx error – A minor unintended deviation (Level 3 -5) – A significant unintended deviation (Level 1 -2) • A Recordable Event • A Misadministration


 . Minor Unintended Deviations: 3 rd Qtr. 1996 Data Entry: Daily Tx Record 4% 4% 4% Process: Simulation Films 1% 0% 0% Process: Patient Simulation 4% Data Entry: ACCESS - Tx Field Def 39% 4% 5% Tx of Patient: Port Films Data Entry: Tx Chart - Rx Data Entry: Tx Field Info Process: Block Fabrication Tx of Patient: Patient Beam Modifiers Process: Dose Calculation 5% Data Entry: Patient Setup Doc QA: Missing or Late 6% 7% 8% 9% Radiation Safety: Missing or Late Tx of Patient: Patient ID Tx of Patient: Patient Setup
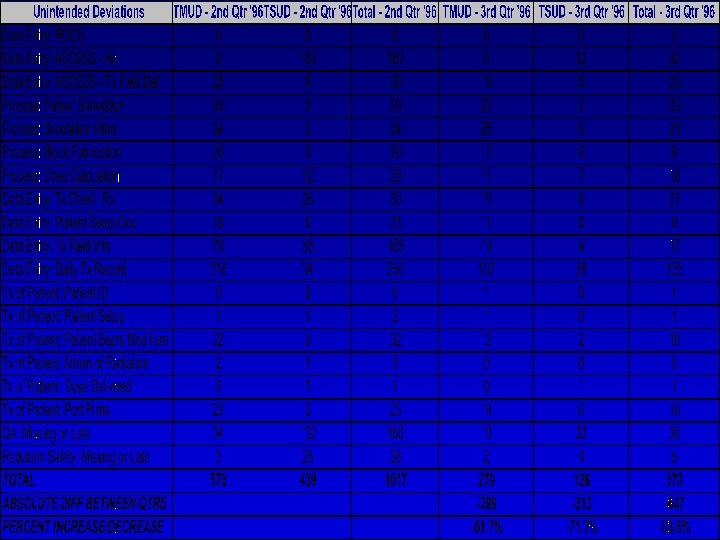
 Significant Unintended Deviations: 2 nd & 3 rd Qtr. 1996 180 160 140 120 100 80 60 40 20 0 TSUD - 3 rd Qtr '96 TSUD - 2 nd Qtr '96


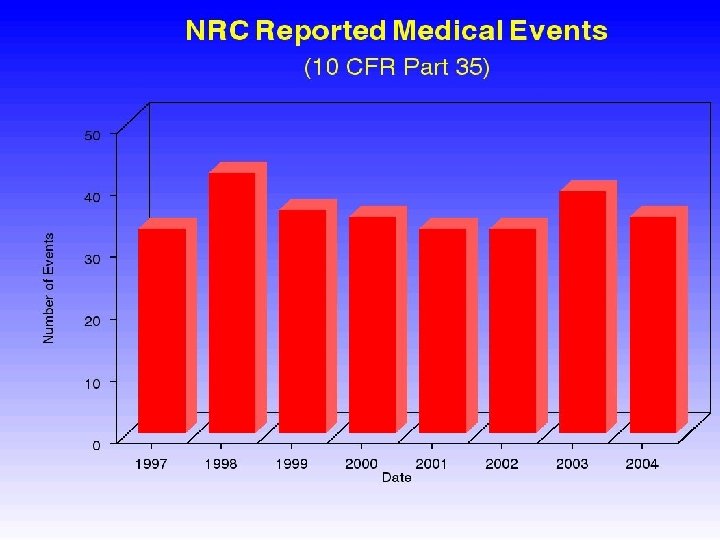
 Reported Misadministration Rate In Radiation Oncology • Published rates 19 for reported misadministrations in therapeutic radiation oncology is 0. 004 percent (4/100, 000 administrations) based upon 20 treatments/patient for NRC regulated states only. Based upon internal NRC documents, it is speculated that the rate may be as high as 0. 04 percent. NRC memorandum dated March 8, 1993: Data based on information obtained from the American College of Radiology (Manpower Committee, Patterns of Care Study, and Commission of Human Resources). Additional reference from Institute of Medicine (Radiation 19
 Calculated Error Rates Paper-Based Model • Based upon the total number of treatment fields delivered as recorded by R&V at 17 radiation oncology centers and the total number of unintended deviations self-reported by the system, excluding the initial two quarters for the “learning curve effect”, the overall average error rate for both minor and significant unintended deviations within the system was approximately 0. 052% (5. 2 in 10, 000 patient treatments). • The minor unintended deviation reporting rate for the same period was approximately 0. 034%.
 Measured vs Published Misadministration Rate Radiation Oncology • The significant unintended deviation reporting rate that could lead to a misadministration was calculated to be approximately 0. 018% (1. 8 in 10, 000 patient treatments). 20 • Based upon the model’s experience of one reported misadministration (having no deterministic or measurable effect) over 2 years, the measured misadministration rate was 0. 017%. 20 Reporting rate is based on the number of significant interactions occurring in the treatment delivery process that could lead to a misadministration (criteria based on 10 CFR Part 35) vs the total number of treatment fields administered for 17 centers.
 Measured vs Published Misadministration Rate Radiation Oncology • When compared to what the NRC speculates is the actual misadministration rate of 0. 04 (4 in 10, 000), this rate is a factor of 2. 35 lower. • Though this program helped in minimizing the occurrence of misadministrations, the overall focus was to reduce the number and nature of all errors in therapy process.
 Cost Benefit Analysis • After implementation of the QA/Medical Error Reduction Program, the 17 radiation oncology centers experienced a reduction of 326% in error rate from 3/96 to 12/97 (not including the “learning curve effect”): – Direct cost savings of approximately $450, 000 – Direct & indirect cost savings of approximately $600, 000
 Cost Benefit Analysis • Experience with the one reported misadministration that occurred at a center in Florida between 3/96 and 12/97 (with no measurable effect) resulted in a total direct cost (man-hours, travel, etc. ) of approximately $25, 000. • Physician malpractice insurance premiums for the 17 oncology centers were reduced by 10%.
 Summary of Results Paper-Based Model • Overall average error rate was 0. 052% (SL 1 – 5) • Calculated misadministration rate 21 was 0. 018% • Actual misadministration rate was 0. 017% • NRC misadministration rate was 0. 04% (a factor of 2. 35 higher than actual misadministration rate) • Reduced overall error rate by 326% over 21 months • Direct cost savings of $450, 000 • Direct & indirect cost savings of $600, 000 • Other significant incidents averted by using program 21 Misadministration criteria based on definitions found in NRC 10 CFR 35. 2, rev. 1996.
 Other Center Studies Paper-Based Model Summary of Results - 1998 Oncology Company With 10 Freestanding Centers – Three significant radiation treatment errors, that if left undetected would have required reporting to the State and notifying the referring physician and patient, were caught. – A misadministration at one center, involving possible civil penalties and sanctions, was mitigated by the State by demonstrating that the error leading to the misadministration was isolated based on empirical data.
 Other Center Studies Paper-Based Model Summary of Results - Calendar Year 2002 Cancer Center #1 • • • Aside from the 1 st quarter “learning curve”, total errors decreased by 70. 5% (334 vs 99) between the 2 nd and 3 rd quarters. Total errors decreased by 27. 3% (99 vs 72) between the 3 rd and 4 th quarters. The total decrease in errors between the 2 nd and 4 th quarters was 78. 4% (334 vs 72). Cancer Center #2 • • • Aside from the 1 st quarter “learning curve”, total errors decreased by 66. 4% (113 vs 38) between the 2 nd and 3 rd quarters. Total errors decreased by 18. 4% (38 vs 31 between the 3 rd and 4 th quarters The total decrease in errors between the 2 nd and 4 th quarters was 72. 6% (113 vs 31).
 Lessons Learned With Paper-Based Model • Limitations – – Inefficient Time intensive Intrusive Complex industrial engineering model – Requires paper trail • Weaknesses – Learning error codification system – Triggering required regulatory actions – Faxing of errors – Tracking UDs – Management review – Trending and analysis – Report generation – Timely action – Credible root cause analysis
 Design of Software-Based Model • What is needed? – Automated tracking of errors – Non-intrusive data gathering – Preset standardized gathering – Immediate analysis of errors – Short and long-term corrective actions – Tracking and trending of errors – Automated regulatory report launching
 Design of Software-Based Model MERP Program Features – Monitored Areas • Clinical • QA • Radiation Safety – Identification and Tacking of Errors • Preset standardized error codes • Classification of pre and posttreatment errors • Assignment of severity levels (I - V) • Designation of clinical significance • Designation of significant unintended deviation • "Near Miss" categorization • Sentinel events (internal and JCAHO reportable) • Instant analysis of patterns and trends – Identification and Tacking of Violations • Preset standardized unintended deviation codes • Assignment of severity levels (I - V) • Recordable events • Misadministrations (medical events) • Regulatory violations • Possible regulatory violations • Instant analysis of patterns and trends
 Design of Software-Based Model MERP Program Features – Step-By-Step Root Cause Analysis • Determination of credible root cause analysis • Identification of causal factors • Identification of opportunities for improvement – Action Plan Road Map • Risk-reduction strategy • Short-term corrective action • Long-term corrective action • Assignment of responsible individuals – Patient Dose Error Calculation Wizard • Calculates % error in daily, weekly & total doses – Patient Dose Error Calculation Wizard (cont. ) • Automatically triggers levels for report generation – JCAHO root cause analysis and action plans – State regulatory notifications – Review and Approval • Queue action plan(s) for review and approval • Accept or reject routine corrective action(s)
 Design of Software-Based Model MERP Program Features – Reports and Chart Generation • Generate reports showing characterization of errors and corrective actions • Show charts stratifying error types and severity levels • Select time intervals for charting of data – Audit Compliance Tool • Use MERP to inspect regulatory performance – Complies with State radiation safety requirement for annual review – Meets State QMP rule for annual review
 Design of Software-Based Model MERP Program Features – Customization Features • Customize and create data collection areas for performance improvement priorities – Categories – Subcategories – Attributes • Designate who reviews/approvals routine errors and corrective actions • Assign which errors violate State requirements • Designate severity levels, clinically significant, and significant unintended deviations – Standards/Requirements Referenced by Code • JCAHO 2005 patient safety standards show basis for question • ACR and ACRO standards demonstrate benchmark for measuring performance • CRCPD (Agreement State) recommended regulations (as of 9/04) show legal text
 Conclusion • Based on the experience gained from the clinical application of the paper-based model at over 42 centers throughout the country (29 described in this presentation), a software-based medical error reduction program (MERP) was developed. • MERP provides a non-intrusive and efficient means to address medical error reduction in a systematic manner. Through implementation of MERP, errors that affect patient safety and/or result in regulatory violations can be minimized and often prevented for recurring. • The initial results from the clinical application of MERP appear very promising. • MERP ver. 2. 3 will now be demonstrated.