30c9874309ff75e391c2cfc7c46c2121.ppt
- Количество слайдов: 27
 Tropical Atmospheric Research in Singapore Asst. Prof. Tieh-Yong Koh 许 智扬 Nanyang Technological University (NTU) 南洋理 大学 19 Mar 2007 Acknowledgements: • Naval Research Laboratory, USA • Meteorological Service Division, National Environment Agency, Singapore • Centre for Remote Imaging, Sensing and Processing, National University of Singapore
 Malay Peninsula Typhoon Vamei Sumatra Island Borneo Island Singapore Equator Satellite picture taken by MODIS-TERRA at 11: 33 am on 27 Dec 2001 Singapore Time. With courtesy from Centre for Remote Imaging, Sensing and Processing, National University of Singapore (CRISP/NUS)
 Severe Weather e. g. Typhoon Vamei, 27 Dec 2001 • In Singapore, 28 flights were diverted and 22 flights were delayed at Changi International Airport. • In hardest hit Johor and southern Pahang in Malaysia, the storm took away 5 lives and forced the evacuation of 7000 people.
 Atmospheric Pollution ~1. 4 km away • Smoke-haze pollution from forest fires 15 Oct 2002, 9: 25 am 26 9: 38 PSI 24 h=92, highmoderate =64, low moderate
 Channel News. Asia International Online report on 15 May 2006 • Volcanic eruptions e. g. Merapi in Aug 2003, May 2005… Merapi Volcano, Central Java, 24 Aug 2003
 Climate Change Larsen B ice shelf and parts of Antarctic Peninsula Global warming from increased CO 2 levels, leading to: • increase in sea level; • redistribution of temperature, humidity & rainfall; • changes in storm frequency, duration and intensity.
 COAMPS Real-Time Forecast System A project of Tropical Weather Group, TL@NTU Team Members Tieh-Yong KOH Lan YI Chee-Kiat TEO
 COAMPS Real Time Forecast • Model Description • System Features • Process Flow • Web Display • Verification: case study
 Objective To create a automated system capable of timely delivery of reliable 24 h-forecasts for the SE Asia region • The Tropical Weather group acquired the • COAMPS model from Naval Research Laboratory, USA, for research purposes from Feb 2002 and has been running and testing the model ever since. Development work is still on-going. A trial version of the automated Real Time Forecast System is currently run at TL@NTU since July 2006. This version is being presented to you now.
 Model Description • COAMPS stands for Coupled Ocean/Atmosphere • • Mesoscale Prediction System. It is a mesoscale numerical weather prediction (NWP) model for regional weather forecast. The current version is implemented on a 64 -cpu Linux PC cluster. It has customizable vertical and horizontal grid resolutions and is capable of horizontal nesting. It uses up-to-date numerical methods and has a suite of complex physical parameterizations.
 • 3 D non-hydrostatic compressible equations • 11 prognostic variables: u, v, w, θ, , q, qc, qi, qr, qs , e • • • Terrain-following σz-coordinates Limited-area model with grid-nesting option Mercator projection used for the tropics • Initial and boundary conditions from NOGAPS (Navy Operational Global Atmospheric Prediction System) • Data analysis by Multi-Variate Optimal Interpolation
 – cumulus") • Physics modules: – radiative transfer (Harshvardhan et al. , 1987) – cumulus convection (Kain & Fritsch, 1993) – cloud microphysics (Rutledge & Hobbs, 1983) – boundary-layer turbulence (Mellor & Yamada, 1982) – surface sub-layer physics (Louis, 1979) – simple land surface model (Deardorff, 1978) – coupled ocean data assimilation scheme (CODA) – time-dependent lateral boundaries (Davies, 1976) • Finite-difference method on staggered Arakawa C-grid • Split-time integration
• Physics modules: – radiative transfer (Harshvardhan et al. , 1987) – cumulus convection (Kain & Fritsch, 1993) – cloud microphysics (Rutledge & Hobbs, 1983) – boundary-layer turbulence (Mellor & Yamada, 1982) – surface sub-layer physics (Louis, 1979) – simple land surface model (Deardorff, 1978) – coupled ocean data assimilation scheme (CODA) – time-dependent lateral boundaries (Davies, 1976) • Finite-difference method on staggered Arakawa C-grid • Split-time integration
 System Features The COAMPS Real Time Forecast System is developed inhouse at TL@NTU, based on the model and postprocessing source codes provided by NRL. The following are the features of the system: • Automated routine forecasts – DATA DOWNLOAD: wget from data server, convert GRIB format to IEEE flat files readable by COAMPS analysis module – ASSIMILATION & FORECAST: supply model date time group and previous date time group with consistency – GRAPHICAL INTERFACE: post processing forecast outputs and visualize the results using batch Gr. ADS scripts – WEB DISPLAY: sftp to web server, and update the time stamp on the webpage
 • Smart troubleshooting that detects and solve ad-hoc problems automatically: – when wget is interrupted, missing files are identified and wget is attempted until the dataset is complete. (*There are 852 NOGAPS files + 7 ADP & OCN files) – computer nodes that are down are detected and the model domain decomposition is adjusted for MPI-processing. – aborted forecast jobs are detected and post-processing is performed as long as >24 hr forecast has been accomplished. • Twice daily data assimilation and forecast at 00 Z and 12 Z. Forecast products are available by 08 Z and 20 Z. (Future plans: 00 Z, 06 Z, 12 Z and 18 Z) • 3 -level nesting with 9 km-resolution in the innermost domain for mesoscale predictions. (Future plans: up to 5 -level nesting with resolutions at 3 km, 1 km)
 NOGAPS forecast (2) APD data (3) OCN data 10 min Preprocessing") Start WGET: (1) NOGAPS forecast (2) APD data (3) OCN data 10 min Preprocessing downloaded data: • Format change • Directory Change 1 – 2 hr Execute COAMPS (1) Analysis (2) Forecast (3) Post processing Im pro ve me nt Process Flow 20 min – 1 hr SGT on ati ific r Ve World-wide Observations Investigation 20 min SFTP results to Web Server Forecast results available on the web by 4 am & 4 pm SGT (08 & 20 UTC)
Start WGET: (1) NOGAPS forecast (2) APD data (3) OCN data 10 min Preprocessing downloaded data: • Format change • Directory Change 1 – 2 hr Execute COAMPS (1) Analysis (2) Forecast (3) Post processing Im pro ve me nt Process Flow 20 min – 1 hr SGT on ati ific r Ve World-wide Observations Investigation 20 min SFTP results to Web Server Forecast results available on the web by 4 am & 4 pm SGT (08 & 20 UTC)
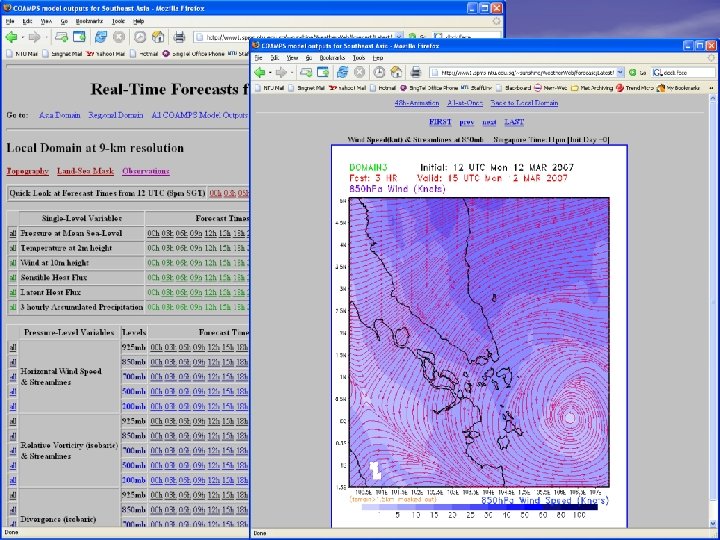
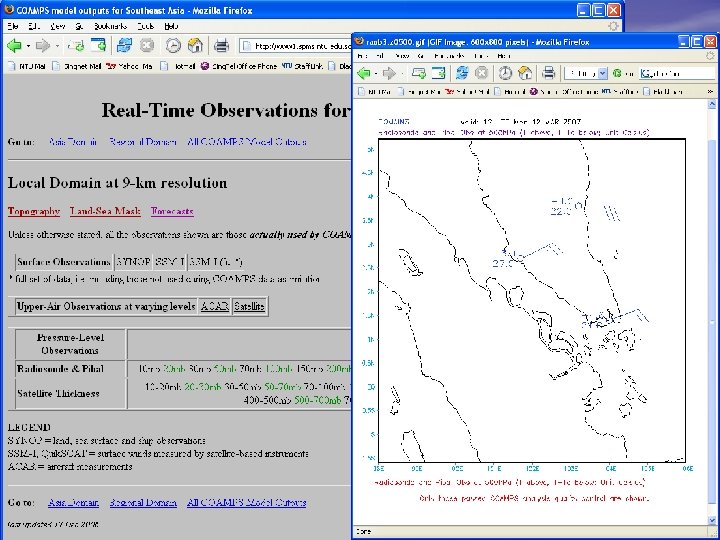
 Web Display • The web display was developed in consultation with • Meteorological Services Division, National Environment Agency, Singapore to ensure its utility and friendliness to operational forecasters. Putting COAMPS forecast products online – ensures easy accessibility of from anywhere with internet connectivity. – facilitates communication with forecasters, model developers and research scientists. • Features of the web portal: – – – http: //www 1. spms. ntu. edu. sg/~sunshine/ Quick-look displays of a subset of meteorological variables of interest to forecasters; Animated, frame-by-frame and all-at-once displays of time evolution of a particular variable Latest and next older forecasts are available.
 Verification: case study Thunderstorms in Singapore and Southern Malay Peninsula 17 th-20 th Dec 2006 * Start: Morning, Sunday 17 Dec * Peak: Tuesday 19 Dec * Movement northwards: Wednesday 20 Dec * Reduction: after 20 Dec
 SINGAPORE From the article “Singapore Swimming” on TODAYonline • Rainfall recorded from 12 am to 8 pm, 19 Dec 2006 was 345 mm (cf. climatological average for the whole month of December is only 284 mm); • Highest 24 h-rainfall recorded in Singapore was 512 mm in 1978; • Second highest was 467 mm in 1969. Mudslide at Little Guilin Tree uprooted at Hillview Wall caved-in at Mohd Sultan Johor-Singapore rail service disrupted Floods in Thomson & Mandai
 PENINSULA MALAYSIA “…what we saw in Johor was not even recorded in the last 100 years. ” -- Director-general Datuk Keizrul Abdullah, Drainage and Irrigation Department (DID), Malaysia 104, 000 people evacuated!
 Forecast of the Onset on 17 Dec COAMPS 48 h-forecast initialized from 8 pm (00 UTC) 15 Dec 2006 Radar observations (courtesy of Malaysian Met Dept) 8 am (00 UTC) 17 Dec 2006 Forecasted ONSET: 2 -5 am 17 Dec ? 8 pm (12 UTC) 17 Dec 2006
 Enhancement of Rain on 19 Dec COAMPS 36 h-forecast valid at 8 pm 19 Dec 2006 Radar Observations at 8 pm 19 Dec 2006 (Courtesy of Malaysian Met Dept)
") Northward Migration of Rain Centre on 20 Dec (a recess of rain in Singapore) COAMPS 12 h-forecast valid at 8 am 20 Dec 2006 ? Radar Observations at 8 am 20 Dec 2006 (Courtesy of Malaysian Met Dept)
Northward Migration of Rain Centre on 20 Dec (a recess of rain in Singapore) COAMPS 12 h-forecast valid at 8 am 20 Dec 2006 ? Radar Observations at 8 am 20 Dec 2006 (Courtesy of Malaysian Met Dept)
 COAMPS Performance • COAMPS captured the beginning of the heavy rain episode. • Forecast made on 8 pm Friday 15 Dec predicted the onset of continuous precipitation in Singapore from 2 -5 am Sunday 17 Dec 2006 (i. e. > 1 day in advance). But the agreement on detailed rainfall distribution varies inconsistently from good to below average… Expected from a 48 h-forecast at mesoscales (~10 km)? • COAMPS captured the enhancement of rainfall in Singapore on Tuesday 19 Dec 2006. • COAMPS captured the northward migration of the heavy rain patch from 19 Dec to 20 Dec 2006 but locations differ.
 • Doppler") On-going work • 2 -month statistical verification over SCSMEX period (May-June 1998) • Doppler Radar Data Assimilation • Satellite Data Retrieval
On-going work • 2 -month statistical verification over SCSMEX period (May-June 1998) • Doppler Radar Data Assimilation • Satellite Data Retrieval