bfa536d2759e20a4cb797314e90890fa.ppt
- Количество слайдов: 66


Transcript analysis and reconstruction Brazil 2001

Genes Why are there only a few tens of thousands of genes in the human genome? How do genes express themselves to manufacture the proteome? How can available sequence information be processed in order to deliver understanding of gene expression?

Genomic expression Within eukaryotes, genes have shared basic characteristics. They have single or multiple exons and introns distributed along the gene in coding and non-coding regions with 5’ Flanking region with transcription regulation signals Transcription initiation start site (5’) Initiation codon for protein coding sequence Exon-intron boundaries with splice site signals at the boundaries Termination codon for protein coding sequence 3’ signals for regulation and polyadenylation

Transcription Initiation Site TATA CAAT GC box

Transcription Initiation Site Initiation Codon Intron 1 Exon 1 GT Intron 2 AG Exon 2 GT

Transcription Initiation CAAT GC box Initiation Codon Intron 1 TATA GC box Pre-m. RNA Mature m. RNA Stop Codon Exon 1 GT AG Poly (A) addition site 5’ Flanking region Intron 2 Exon 2 GT AG Exon 3 AATAA
 Exon")
Gene Expression Transcription products can vary. Transcription initiation at the start site (TSS) Exon length Exon prescence/absence in the mature transcript Alternate transcription termination and polyadenylation

Examples of alternative splicing Alternative donor and acceptor splice sites Alternative polyadenylation Exon skipping
 addition site (s) 3’")
Transcription Initiation Codon Stop Codon Exon 2 SKIP Poly (A) addition site (s) 3’ Flanking region CAAT GC box TATA GC box Pre-m. RNA Mature m. RNA GT Exon 1 AG Intron 1 Exon 3 AATAA

Capturing expressed transcripts Databases - Sequences db. EST Several collapsed datasets TIGR-THC Unigene STACK Genome Sequence as it appears: Allgenes Body. Map Several more specialised

Expression Capture • Serial Analysis of Gene Expression – DNA fragments that act as unique markers of gene transcripts. – Assay of numbers of each marker in a set of sequence yields a measure of gene expression • Array – Laydown of sequence clones to provide an organised series for hybridisation

Resolution of Captured Expression ESTS Low resolution, broad capture, provides template for SAGE and Array SAGE Medium resolution, need template, noise can be an issue, stoichiometry is revealed but standardisation a problem ARRAY High resolution, need template, noise, stoichiometric resolution highest, standardisation a problem.

What is an EST? AAAAA Partial c. DNA Transcripts 5’ staggered length due to polymerase processitivity 3’ overlapping 5’ 3’ 5’EST Forwards and reverse sequencing primers 3’EST Clone/Seq vector with CLONEID

What potential do ESTs hold? • • Expression counts Consensus sequences Alternate expression-form characterisation Identification of genes expressed in a pilot gene discovery project • Identification of genes specifically expressed in a chosen library or tissue

Use of Transcripts in Completed genomes • Identification of genes – Exon boundaries – Alternate transcripts • Genomic annotation – Expression sites of encoded genes • Comparitive genomics

EST data quality >T 27784 g 609882 | T 27784 CLONE_LIB: Human Endothelial cells. LEN: 337 b. p. FILE gbest 3. seq 5 -PRIME DEFN: EST 16067 Homo sapiens c. DNA 5' end AAGACCCCCGTCTCTTTAAAAATATATTTTAAATATACTTAAATATTTCTAATATCTTTAAAT ATATATTTNAAAGACCAATTTATGGGAGANTTGCACACAGATGTGAAATGTAATCTAATAG ANGCCTAATCAGCCCACCATGTTCTCCACTGAAAAATCCTCTTTGGGGTTTTTCTTTCTTTTT TGATTTTGCACTGGACGGTGACGTCAGCCATGTACAGGATCCACAGGGGTGGTGTCAAATGCTATTGAAAT TNTGTTGAATTGTATACTTTTTCACTTTTTGATAATTAACCATGTAAAAAATG EST is Poor Quality data with contaminants Vector Repeat MASK Individual items are prone to error but an entire collection contains valuable genetic information

Overview of clustering and consensus generation Prepocessing Initial Clustering Assembly Repeats Vector Mask Alignments Consensi Alignment Processing Cluster Joining Output Expressed Forms

Transcript reconstruction

What is an EST cluster?

Loose and stringent clustering • Stringent - greater fidelity, lower coverage – One pass – Shorter consensi – Lower inclusion rate of expression-forms • Loose - lower fidelity, higher coverage – Multi-pass – Longer consensus sequences but paralogs need attention – Comprehensive inclusion of expression-forms

Supervised clustering • ‘Template for hybridisation’ is a transcript composite derived from: – A captured ‘full length’ m. RNA – A composite exon construct from a genomic sequence – An assembled EST cluster consensus

Clean Short and Tight TIGR-THC Uni. Gene STACK Long and Loose

Data apprehension and input format. • • • Sources: In-House, Public, Proprietary ‘Accession’ / Sequence-run ID Location/orientation Source Clone Source library and conditions

Pre-processing • Minimum informative length • Low complexity regions • Removal of common contaminants – – Vector, Repeats, Mitochondrial, Xenocontaminants XBLAST, Repeatmasker, Vec. Base and others BLIND masking • Pre-clustering vs known transcripts (data reduction)

Initial clustering • Stepwise clustering ‘Multistate’. – sequence identity – annotation – verification

Assembly • Including chromatograms - SNPs and Paralogs • PHRAP and CAP series • Multiple assemblies can fragment from one input cluster – fidelity – alt. forms – error

Alignment processing • • Consensus generation Alternate forms Errors Choosing the ‘correct consensus’

Cluster joining • Clone joining – Choosing to accept a clone annotation • 1 clone ID • 2 clone ID’s • Available parents – m. RNA (incomplete/alternate) – Composite(constructed from Genomic) • intronic sequence ~ 2%

Output • Alignment – alternate expression-forms – polymorphisms – error assessment • Cluster – raw cluster membership – contextual links • Formats: FASTA, Gen. Bank, EMBL

Alignment scoring methods: • Correct position of sequence elements against each other maximizes some score • BLAST and FASTA – Heuristic – cutoff and identity – pairwise alignment – ~fast

EST clustering methods • Est sequence is littered with errors, stutters, in-dels and re-arrangements • alignment approach is sensitive to these • 3’ only comparison

Non-alignment based scoring methods: D 2 -cluster • No alignment so a speedup • Sensitivity improved by multiplicity measure • low weight to low complexity • very error tolerant • transitive closure • 96% ID over 100 or 150 bases.
 acggtca")
Word table ( ) acggtca
2= 4 3")
Multiplicity comparison 3 2 (d)2= 4 3

TIGR_ASSEMBLER • THC_BUILD: BLAST-FASTA id all overlaps and are stored. • Tigr-assembler then uses rapid oligo nucleotide comparison and assembles non-repeat overlaps. (95% ID over 40 bp) • matching constraints on sequence ends • minimum sequence id within a sequence group more fragmented as a result • Other TIGR approaches are similar

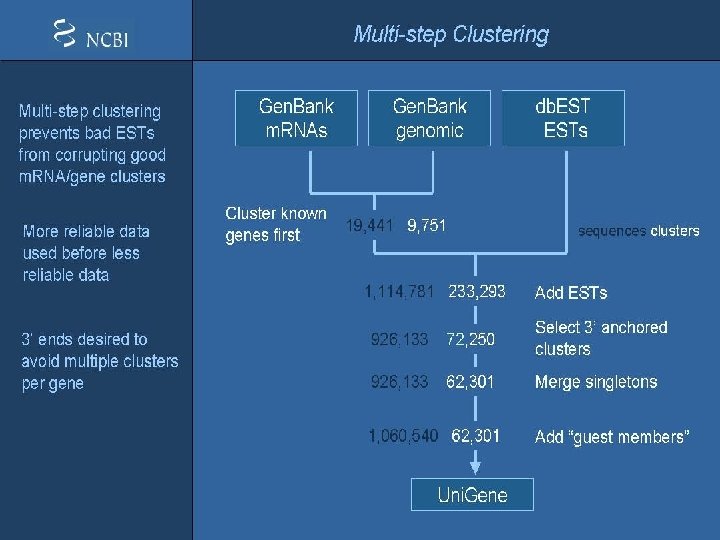
Uni. Gene

Unigene approach • Originally 3’ only + m. RNA common words of length 13 separated by no more than 2 bases. • ID>Annotation>Shared clone ID • Genbank, genomic ad db. EST > DUST > 100 bp min >MEGABLAST

Wagner et al. CSH 1999

Fragmentation Comparison

Alignment Analysis Three subassemblies Potential alternate expression form

Orthologs and Paralogs • Orthologs – Genes that share the same ancestral gene that perform the same biological function in different species but have diverged in sequence makeup due to selective evolution • Paralogs – Genes within the same genome that share an ancestral gene that perform diverse biological functions.

Needs – Functional assignments – Expression states of alternate forms and their sites of expression – Exon level resolution of expression – Representative forms for application to arrays – Physical gene locations – Relationship to disease

Exploration • Availability of genomic sequence and partial transcription products means characterisation of alternate transcription can begin in earnest. • Contribution to variation of expressed products and effects on biology are likely to be significant

How to trap useful genome sequence to manufacture a genome virtually? Gene level approach Trap Expressed Sequence Tags ~1. 8 M tags, ~35 -100 K genes Combine to form virtual genes Annotate and analyse these genes Correlate with phenotype(s) = disease Understand the expression basis of disease

Reconstruction of transcripts Derive understanding of expressed gene products Use of expressed sequence data requires complex processing Processed datasets are badly needed Capture a first glimpse of a genome’s activites Genomic level sequence is the final state, but its products can provide powerful information very early. Characterize underlying gene structure Exon boundaries are difficult to define accurately and consistently Assess effect of an intervention on gene expression products A rough EST profile is a quick identifier of key expression products Associate isoforms with expression states Expression forms vary, how and when? What does a full length c. DNA really mean?

Why is transcript data a problem?

Transcript Data Full length c. DNA Gen. Bank has many entries that confuse ‘full length’ with ‘complete Coding Sequence’ Partial c. DNA Redundant partial c. DNA sequences Exon Composite All confirmed exons combined to form a ‘complete transcript’ Expressed Sequence Tag Single pass sequence Genome Survey Sequence Single pass sequence Small genomes contain more coding sequences in GSS than larger genomes

Genome Sequence: Characterizing underlying gene structure Fanfare fragment First Pass Annotated Exon boundaries Predicted Cross species conservation Transcript confirmation Composite exon transcript How do you define a transcript?

STACKing approach Distill quality from quantity Accurate consensus sequence representation Identify expression variation, both spatial and developmental Facilitate better understanding of gene expression Exon-level gene expression profile Integration of expression with genome sequence Confirm and discover expressed exons Provide gene candidacy delivery Integrate with phenotype

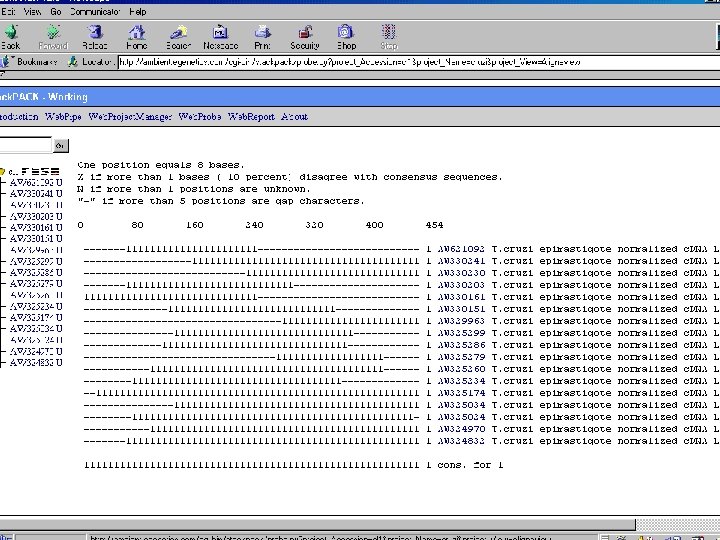
STACKPACK SQL Database Data abstraction User Interface Application management Process Scheduler - C++, My. SQL, HTML, Java

stack. PACK Schema ALL alternate expression forms are saved and accessible.

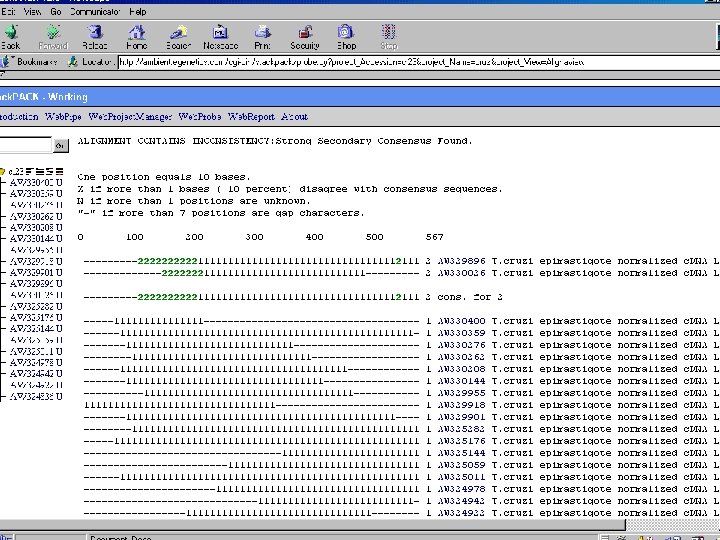
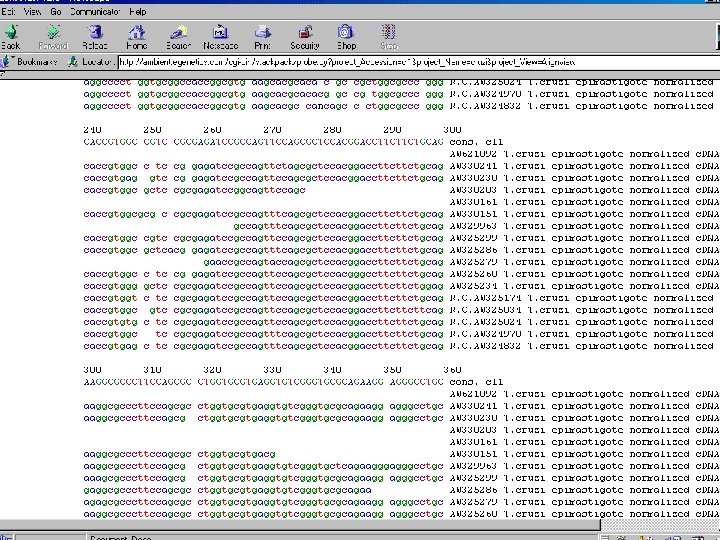
Web. Probe - View by clonelink accession Entering a project name and cluster accession number displays the clonelink Consensus View. Clonelink cluster ID Contig ID Input EST accession numbers In all views, the full cluster ‘family tree’ is shown in the panel on the left. Link to corresponding Uni. Gene entry

Alignment and Analysis • PHRAP Alignment – first alignment created – all ESTs in one alignment • Alignment Analysis – CRAW used to look for subassemblies – Identifies potential alternate expression forms • CRAW Alignment – Final alignment for each subassembly • Consensus Analysis – Statistics used to select best consensus – Notes degree of matching between EST & consensus

The Value of Cluster Data Microarray Studies Clusters represent unique forms associated with a specific state Gene Discovery Unique transcripts revealed in association with expression libraries – especially in little studied organisms Functional Annotation Virtual genes can be searched against the database to provide functional annotation of the products of a genome Expressed Gene Structure Exons boundaries are revealed by transcript confirmation

How to trap useful genome sequence to manufacture a genome virtually? • • • Gene level approach Trap Expressed Sequence Tags Combine to reconstruct virtual genes Maufacture a substrate for microarray studies Annotate and analyse these genes Compare between species – Species-specific characteristics – Reveal genes under selection

Protein Fragments Virtual Protein Sequence and transcript reconstruction predict CDS Joined Consensi Alignments Clusters Raw ESTs NNNNN

Detection of virulence genes in malarial pathogens Rahlston Muller Reconstruction of transcripts from gene expression projects in the USA Collaboration with Jane Carlton at NCBI Delivery of over several previously unknown genes in Plasmodium spp. Discovery of 76 genes that may be involved in virulence and pathogenicity Vaccine and drug candidates

Sequence re-construction and assembly • ESTs re-constructed using stack. Pack • 6, 697 submitted • 860 Multiple Sequence clusters, and • 2, 786 singletons • GSSs assembly using PHRAP • • Clones may contain a higher proportion of CDS 18, 082 submitted 2, 784 contigs 10, 979 singletons • All together now : 17, 409 consensus sequences • Subsequent analysis

Redundancy determination • PF • ESTs 15% • GSSs 14% • PB • ESTs 50%, not normalized • GSSs 24% • PV • Sal I 26% • Belem 25%

Sample Graphical Output of a STACK Eye sequence eye 2 BLASTN search Vs TIGR Tentative Human Consensus Sequences.

Outputs Raw State Expression Representative unique forms associated with a specific state Gene Discovery Unique transcripts revealed in association with expression libs Isoform coupled expression Gene Structure Exons boundaries are revealed by transcript confirmation

Protein prediction, using PHAT • Putative open reading identified, using criteria other than db searches • HMM gene finder for Plasmodium – P. falciparum – P. berghei – P. vivax 56% predicted 60% predicted 84% predicted • 72% (12, 530/17, 408) predicted proteins
bfa536d2759e20a4cb797314e90890fa.ppt