

ff0ce4b139c964aae16ca4af98315446.ppt
- Количество слайдов: 33
 Director -") Traffic Clusters in Networks of Convenience Ron Mc. Leod, Ph. D. (Candidate) Director - Research and Corporate Development Telecom Applications Research Alliance (TARA) Flo. Con 2009
Traffic Clusters in Networks of Convenience Ron Mc. Leod, Ph. D. (Candidate) Director - Research and Corporate Development Telecom Applications Research Alliance (TARA) Flo. Con 2009
 Who is TARA • Private consortium of 35 member companies and research institutions all working in IT/Telecom. • Most active investor in early stage IT companies in Atlantic Canada. • Senior Partners include: – Bell Aliant – Cisco Systems Canada – Nortel Networks • We are actively seeking Research collaborations
 The Project TARA has partnered with a group of companies in a multi year project to analyze the outbound and inbound traffic in Networks of Convenience. The specific companies and specific objectives of The Project remain confidential at this point. However, From an analysis perspective we are first interested in understanding the nature of this traffic. Data sources are real traffic captures from hotels, airports and general hotpots from around the world.
 The Project Networks of convenience are a relatively new and rapidly growing sector of the ISP community. These are networks that serve a transient population. The provider is compensated either by fees charged to end users, or by the hosting organization which absorbs the cost as overhead. The networks may be wired, typically using Ethernet, or wireless (802. 11). Relatively little is known about the ways in which these networks are used.
 The Project We believe that Networks of Convenience may be used by criminals and / or terrorists in attempts to conceal their activities, identities, or both. Networks of convenience are the “payphones” of the twenty-first century. Users of these networks take advantage of the implicit anonymity that comes with their use. We do not know how common other forms of malicious activity may be in these networks
 The Project Network traffic characterization approaches in the past have relied on availability stable data in an environment of perfect information. An analyst could have access to static IP and MAC address databases or DHCP lease logs that could be used to collate traffic to specific origins such as identifiable workstation/user combinations, servers or other network attached devices. In this environment, normal-versus-anomalous behaviour models could be used to profile network and user behaviour to detect misuses or anomalous behaviour such as masquerade attack or worm propagation.
 Data Gathering Since the sources tend to be NAT’ed, we use network taps on the interfaces inside of the edge router. Currently capturing inbound and outbound data separately. Prior to analysis, full packet captures are first converted to primitive flows. Our research is focused on flow level analysis but this conversion also helps to allay provider’s concerns for their customer’s privacy. (i. e. we don’t look at your data only the packet header)
 Observations During Conversion 100 Internal IPs Monitored for 1 month. Of all Packets Read: • Not IPV 4: 1. 7% • Fragmented: 0. 06% • Too Short: 0. 0% • Incomplete (No Ports and or Flags): 0. 0% Overall, traffic is characterised by its non-uniformity.
 TCP=65% UDP=34% Protocol Flows were a Little Unusual Multicast Host management At 0. 18% IPv 6 Encapsulation At 0. 00003% VPN’s smaller than I expected at 0. 09 %
 Outbound Bytes by Host Show Large Variations
 Obvious in a Linear Scale Lets take a closer look at this guy
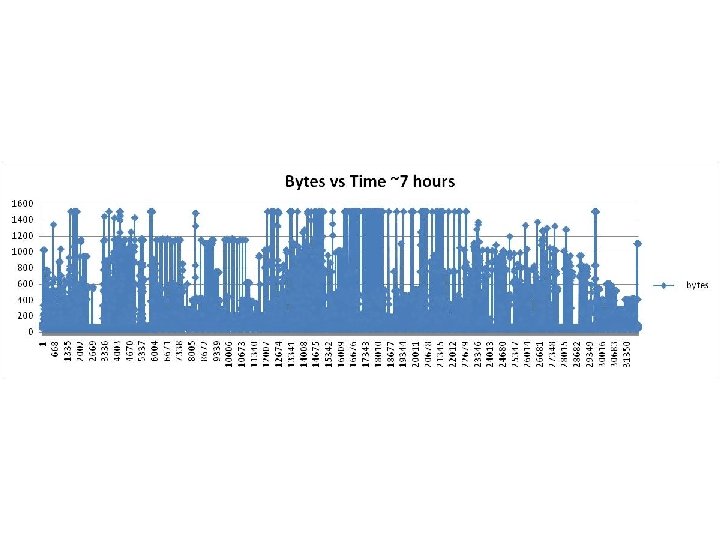
 VRML Multi User 4204
 We expected DPorts 80 and 443 to represent most traffic…. Together they accounted for 41% Note that the DPort 0 data point is ICMP Traffic
 4204 lists as VRML Multi-User almost all from 1 host One host only 25 flows on Bit. Torent Only minute traces of Half Life Gaming Note that the DPort 0 data point is ICMP Traffic
 SSH 10% of all flows 13991 and 44849 Fasttrack 50 hosts 1700 flows 36459 Mac Skype 52523 No 6667 listening?
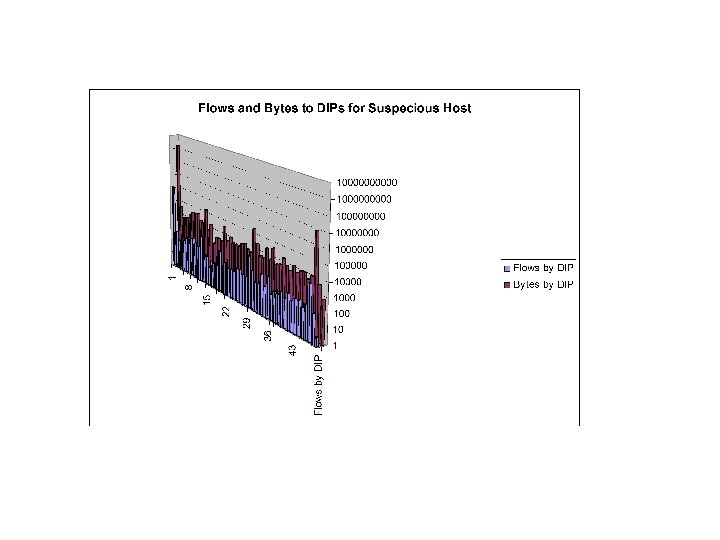
 Number of Destination by Host Shows Substantial Spikes
 Linear Scale Suspicious Host accessed sequential ranges through multiple /16`s Lets look a little closer at his activity
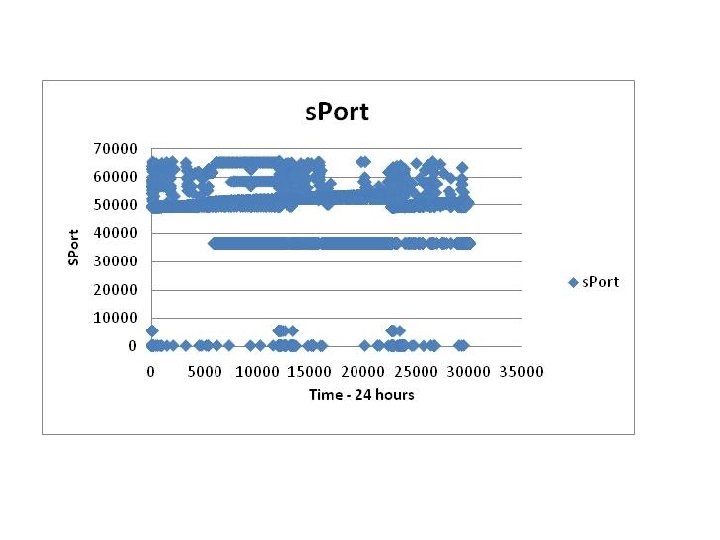
 36459 Dominates the Sports…
 Removing 36459 in a linear scale we get Sport use is near sequential above 49153
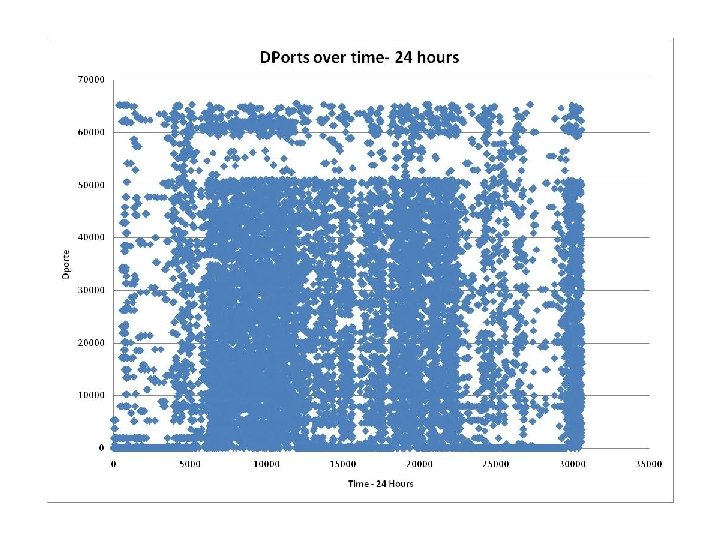
 His DPort values in Log Scale Not quite sequential but most ports above 1024 are accessed. Average is less than 10 flows (packets) per Dport
 Linear version Dports with Port 80 removed
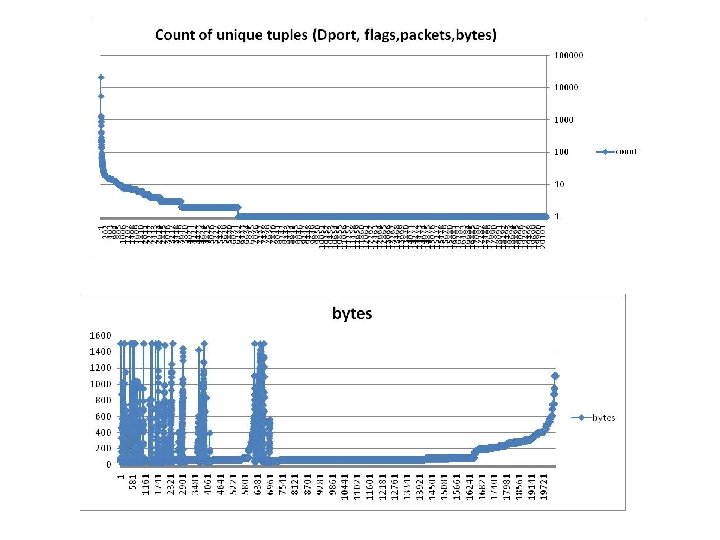
 count 21005 5502 1373 1280 1261 1173 914 866 673 430 pro 6 6 17 6 6 6 d. Port 80 80 443 80 1900 80 80 65209 80 80 flags A A A RA S S R FA A packets 1 1 1 1 1 bytes 40 52 40 40 61 52 48 40 40 60
 Is double the aggregate value") Protocol Distribution for Suspicious Host ICMP ratio (0. 08%) Is double the aggregate value (0. 04%) Multi-Cast Host Management 0. 18% 65 % TCP 34 % UDP Would expect these to be more equal for a peer and vastly skewed for a scanner.
Protocol Distribution for Suspicious Host ICMP ratio (0. 08%) Is double the aggregate value (0. 04%) Multi-Cast Host Management 0. 18% 65 % TCP 34 % UDP Would expect these to be more equal for a peer and vastly skewed for a scanner.
 Massive Source") Tradition Demands that I ask this Question Massive Destination IP`s (sequential /16`s) Massive Source Ports (near sequential) Massive Destination Ports (near sequential) Multi-Cast Host Management Protocol Larger than expected ICMP Ratio Standard TCP/UDP Ratio WHO AM I ?
Tradition Demands that I ask this Question Massive Destination IP`s (sequential /16`s) Massive Source Ports (near sequential) Massive Destination Ports (near sequential) Multi-Cast Host Management Protocol Larger than expected ICMP Ratio Standard TCP/UDP Ratio WHO AM I ?
 Massive Source") Tradition Demands that I ask this Question Massive Destination IP`s (sequential /16`s) Massive Source Ports (near sequential) Massive Destination Ports (near sequential) Multi-Cast Host Management Protocol Larger than expected ICMP WHO AM I ? However, unlike previous years…. .
Tradition Demands that I ask this Question Massive Destination IP`s (sequential /16`s) Massive Source Ports (near sequential) Massive Destination Ports (near sequential) Multi-Cast Host Management Protocol Larger than expected ICMP WHO AM I ? However, unlike previous years…. .
 I HAVE NO IDEA…….
 Summary Some obvious challenges How to tell when host changes? - Will test user-host profiler presented at flocon 2006. - until this is nailed down – assumptions are more like ``let`s pretend``. Some Intriguing Opportunities - Oops – I`m not allowed to talk about those yet.
 Thank You I am seeking help and would welcome any private feedback, discussions or ideas you might have. If you had access to this data – what would you do?