

4b8013dc14d36b72572c414522165e9c.ppt
- Количество слайдов: 42
 Towards a taxonomy of innovation systems Manuel Mira Godinho ISEG/UTLisbon Presentation to the Globelics Phd School 2005 Lisbon 31 May 2005 Based on Godinho, Mendonça and Pereira (2004)
 Structure of the presentation: Part 1 Questions, aim, and conceptual considerations Part 2 STEP 1 (Mapping NISs) 2 exercises Part 3 STEP 2 (Cluster analysis) Part 4 A possible taxonomy + conclusions
 Part 1 Questions • Is it possible to measure the development and maturity of NISs? • What specific technique can be used for that? • Can we apply that technique to both the advanced and the catching up economies?
 Aim 1 st step Mapping NISs 2 nd step With output of step 1: generate a possible taxonomy of NISs
 Outcome: Mapping… … and benchmarking
 (… 1 to 10) Different NIS Concepts • Freeman (1987) organization") Conceptual questions (1) (… 1 to 10) Different NIS Concepts • Freeman (1987) organization of R&D in firms and role of government in Japan • Nelson (1988) high tech sectors and R&D system • Lundvall (1988) Inter-firm and user-producer interactions • Amable, Boyer and Barré (1997) – Human Resources • Aalborg school late 1990 s “Learning economy”
Conceptual questions (1) (… 1 to 10) Different NIS Concepts • Freeman (1987) organization of R&D in firms and role of government in Japan • Nelson (1988) high tech sectors and R&D system • Lundvall (1988) Inter-firm and user-producer interactions • Amable, Boyer and Barré (1997) – Human Resources • Aalborg school late 1990 s “Learning economy”
 “NIS” What is it? A conceptual device that focus on the") Conceptual questions (2) “NIS” What is it? A conceptual device that focus on the conditions that facilitate or hinder the generation and diffusion of innovations in a given economy
Conceptual questions (2) “NIS” What is it? A conceptual device that focus on the conditions that facilitate or hinder the generation and diffusion of innovations in a given economy
 “NIS” is a “system” - Whole: more than the parts -") Conceptual questions (3) “NIS” is a “system” - Whole: more than the parts - Dynamic economies of scale - Agglomeration economies - Network economies - Pure knowledge spillovers Source of increasing returns … … but also of entropy …
Conceptual questions (3) “NIS” is a “system” - Whole: more than the parts - Dynamic economies of scale - Agglomeration economies - Network economies - Pure knowledge spillovers Source of increasing returns … … but also of entropy …
 ‘NIS’ emerged in the literature as a qualitative concept Is quantification") Conceptual questions (4) ‘NIS’ emerged in the literature as a qualitative concept Is quantification possible, acceptable or desirable? Quantification: allows for comparisons But each NIS Idiosyncratic (what in a context can be seen as a weakness in another might be seen as a strength) Quantification: possible, desirable… but… … caution needed in the analysis
Conceptual questions (4) ‘NIS’ emerged in the literature as a qualitative concept Is quantification possible, acceptable or desirable? Quantification: allows for comparisons But each NIS Idiosyncratic (what in a context can be seen as a weakness in another might be seen as a strength) Quantification: possible, desirable… but… … caution needed in the analysis
 NIS purpose -Allocation of resources for innovation and diffusion -Speed up") Conceptual questions (5) NIS purpose -Allocation of resources for innovation and diffusion -Speed up accumulation and distribution of knowledge -Provide a favourable regulatory framework -Expected peformance: capability accumulation, learning… … innovation, diffusion … ( …. growth, development, sustainability…)
Conceptual questions (5) NIS purpose -Allocation of resources for innovation and diffusion -Speed up accumulation and distribution of knowledge -Provide a favourable regulatory framework -Expected peformance: capability accumulation, learning… … innovation, diffusion … ( …. growth, development, sustainability…)
 “Innovation” vs. “Diffusion” in the IS trade-off or complementarity? However in") Conceptual questions (6) “Innovation” vs. “Diffusion” in the IS trade-off or complementarity? However in some NIS “diffusion” more important than “innovation” (in the limit “innovation”=0, but even in this case we can speak of ‘NIS’)
Conceptual questions (6) “Innovation” vs. “Diffusion” in the IS trade-off or complementarity? However in some NIS “diffusion” more important than “innovation” (in the limit “innovation”=0, but even in this case we can speak of ‘NIS’)
 NIS comprehends: -Actors (diversity, roles, behaviours, strategies) -Their interactions (linkages, channels,") Conceptual questions (7) NIS comprehends: -Actors (diversity, roles, behaviours, strategies) -Their interactions (linkages, channels, system density) -Institutions (with given functions, enable or limit innovation and diffusion) - Relevance of “History” (Learning and capability accumulation constrained by previous historical trajectory , path dependency, inertia…)
Conceptual questions (7) NIS comprehends: -Actors (diversity, roles, behaviours, strategies) -Their interactions (linkages, channels, system density) -Institutions (with given functions, enable or limit innovation and diffusion) - Relevance of “History” (Learning and capability accumulation constrained by previous historical trajectory , path dependency, inertia…)
 The actors: Firms Consumers (other firms, final consumers, government, exports) Markets") Conceptual questions (8) The actors: Firms Consumers (other firms, final consumers, government, exports) Markets (products but also finance and labour) Government (procurement, laws, regulations, standards, competition policy, IPR…) Knowledge producers and reproducers (universities and other education entities, training system, public labs…) Entities of transfer, intermediation and support (technology centres, incubators, technology brokers…)
Conceptual questions (8) The actors: Firms Consumers (other firms, final consumers, government, exports) Markets (products but also finance and labour) Government (procurement, laws, regulations, standards, competition policy, IPR…) Knowledge producers and reproducers (universities and other education entities, training system, public labs…) Entities of transfer, intermediation and support (technology centres, incubators, technology brokers…)
 NIS: not a closed system Degree of openess depends on (1)Sophistication/backwardness") Conceptual questions (9) NIS: not a closed system Degree of openess depends on (1)Sophistication/backwardness of the domestic knowledge base (2)Size (3)FDI flows and external trade involvement
Conceptual questions (9) NIS: not a closed system Degree of openess depends on (1)Sophistication/backwardness of the domestic knowledge base (2)Size (3)FDI flows and external trade involvement
 NIS and ‘economic structure’ • Concentration and size distribution in each") Conceptual questions (10) NIS and ‘economic structure’ • Concentration and size distribution in each industry • Relative weight of different sectors • International specialization of the economy
Conceptual questions (10) NIS and ‘economic structure’ • Concentration and size distribution in each industry • Relative weight of different sectors • International specialization of the economy
 Method • Decide what the relevant dimensions are") Part 2 Mapping NIS (“step 1”) Method • Decide what the relevant dimensions are • Decide what variables shall/can be used • All varibales standardized • Aggregate 2 -6 variables into each relevant dimension • Map those dimensions into bi-dimensional space
Part 2 Mapping NIS (“step 1”) Method • Decide what the relevant dimensions are • Decide what variables shall/can be used • All varibales standardized • Aggregate 2 -6 variables into each relevant dimension • Map those dimensions into bi-dimensional space
 Exercise 1 • What relevant dimensions shall be selected to represent a given NIS ?
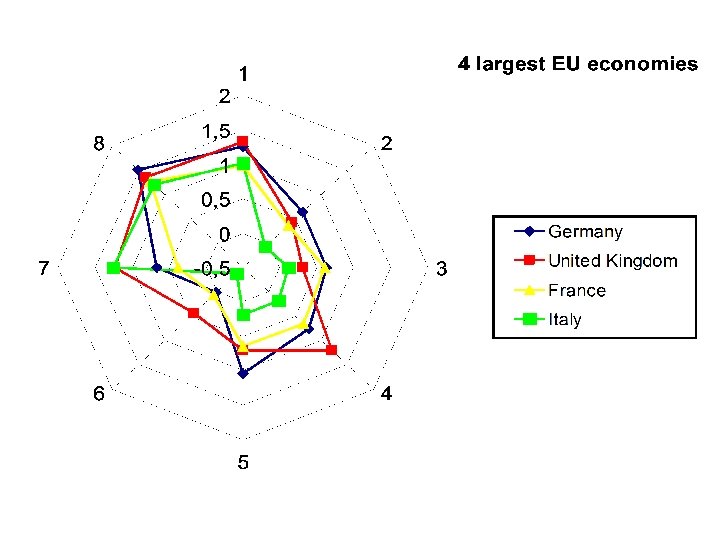
 Step 1. a – Eight NIS dimensions • • market conditions institutional conditions intangible and tangible investments basic and applied knowledge external communication diffusion innovation In order to materialise such 8 NIS dimensions n individual indicators selected Definition of NIS dimensions and indicators’ selection respects theoretical and practical criteria
 Exercise 2 • What indicators shall we select for each of the identified dimensions ?
 Dimension 1 - “Market conditions” -Income per capita -Overall GDP size -Population density Dimension 2 - “Institutional conditions” -GINI index -Youth of population -Life expectancy -Corruption index Dimension 3 - “Intangible and tangible investment” -Education expenditures as a percentage of GDP -Education expenditures per capita -GERD as a percentage of GDP -GERD per capita -Investment rate (GFCF as a percentage of GDP) Dimension 4 - “Knowledge” -Population with 2+3 Education as a percentage of total population -Researchers as a percentage of labour force -Scientific papers per Capita
") Dimension 5 - “Economic structure” -Value Added in High-Tech & Medium High-Tech Activities (%) -High-Tech & Medium High-Tech Exports (%) -Sales of home-based top 500 global R&D companies / Dimension 6 - “External communication” GDP -(Exports + Imports) / GDP -(Inward + Outward stocks of FDI) / GDP -Bandwidth in international connections (bits per Capita) Dimension 7 - “Diffusion” -Personal Computers per capita -Internet Hosts per capita -Internet Users per capita -Cellular Phones per capita -ISO 9000 + ISO 14000 Certificates per capita Dimension 8 - “Innovation” -US Patents per Capita -Trademarks per Capita
Dimension 5 - “Economic structure” -Value Added in High-Tech & Medium High-Tech Activities (%) -High-Tech & Medium High-Tech Exports (%) -Sales of home-based top 500 global R&D companies / Dimension 6 - “External communication” GDP -(Exports + Imports) / GDP -(Inward + Outward stocks of FDI) / GDP -Bandwidth in international connections (bits per Capita) Dimension 7 - “Diffusion” -Personal Computers per capita -Internet Hosts per capita -Internet Users per capita -Cellular Phones per capita -ISO 9000 + ISO 14000 Certificates per capita Dimension 8 - “Innovation” -US Patents per Capita -Trademarks per Capita
 STEP 1. b – Country Selection Countries: developed; emerging; and developing economies • The OECD economies • EU members + candidate countries • “Asian tigers” included (even tough not all of them “nations”) • For the rest, the criterion was to include all countries with at least 20 million inhabitants
 69 Countries • Developed, emerging and developing economies • Countries with > 20 million inhabitants • Overall: 87. 4% of the world population
 STEP 1 Possible outcomes • Mapping • NIS evenness • NIS ranking
 NIS ranking 1. Switzerland 2. Sweden 3. Netherlands 4. Denmark 5. Finland 6. Hong Kong 7. United Kingdom 8. United States 9. Singapore 10. Japan 11. Germany 12. Ireland 13. Korea (R. of) 14. France 15. Taiwan 16. Austria 17. Norway 18. Belgium 19. Spain 20. Canada 21. Italy 22. Austrália 23. Luxembourg 1, 15 1, 13 0, 91 0, 90 0, 88 0, 86 0, 85 0, 81 0, 67 0, 62 0, 60 0, 57 0, 51 0, 50 0, 44 0, 40 0, 38 24. Hungary 25. Czech R. 26. Slovenia 27. New Zealand 28. Portugal 29. Malta 30. Malaysia 31. Slovak R. 32. Greece 33. China 34. Estonia 35. Poland 36. Mexico 37. Cyprus 38. Thailand 39. Brazil 40. Lithuania 41. Chile 42. Russia 43. Latvia 44. Argentina 45. South Africa 46. Philippines 0, 27 0, 23 0, 21 0, 13 0, 05 0, 00 -0, 07 -0, 10 -0, 11 -0, 12 -0, 23 -0, 26 -0, 27 -0, 29 -0, 30 -0, 35 -0, 36 47. India 48. Turkey 49. Ukraine 50. Egypt 51. Romania 52. Venezuela 53. Bulgaria 54. Indonesia 55. Morocco 56. Viet Nam 57. Colombia 58. Algeria 59. Peru 60. Iran (I. R. ) 61. Bangladesh 62. Pakistan 63. Nigeria 64. Kenya 65. Ethiopia 66. Myanmar 67. Tanzania 68. D. R. Congo 69. Sudan -0, 39 -0, 42 -0, 43 -0, 45 -0, 52 -0, 56 -0, 58 -0, 59 -0, 63 -0, 67 -0, 68 -0, 75 -0, 77 -0, 82 -0, 89 -0, 94 -0, 97 -0, 98 -0, 99 -1, 05 -1, 06
 The object of the analysis was a") Part 3 - STEP 2 (Cluster analysis) The object of the analysis was a matrix with 69 countries in the sample as the individual “cases” 8 NIS dimensions as the “variables” to be analysed The interpretation of the results led us to the definition of a three level structure of clusters • 1 st level “Megaclusters” • 2 nd level “Clusters” • 3 rd level “Subclusters”
Part 3 - STEP 2 (Cluster analysis) The object of the analysis was a matrix with 69 countries in the sample as the individual “cases” 8 NIS dimensions as the “variables” to be analysed The interpretation of the results led us to the definition of a three level structure of clusters • 1 st level “Megaclusters” • 2 nd level “Clusters” • 3 rd level “Subclusters”
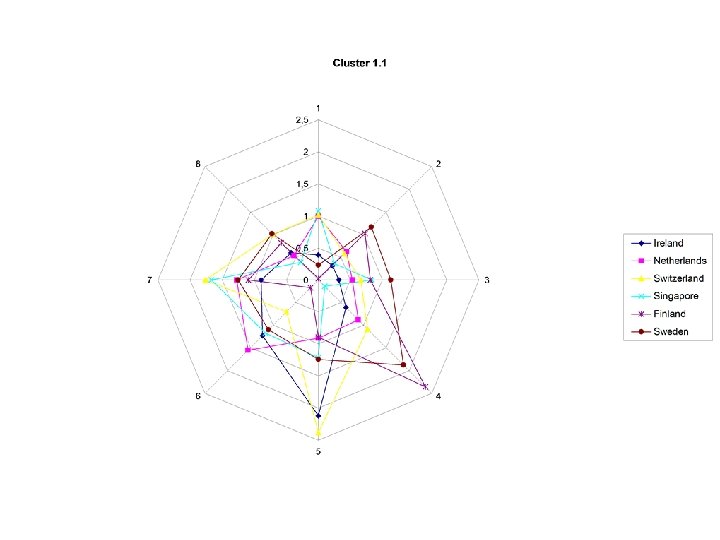
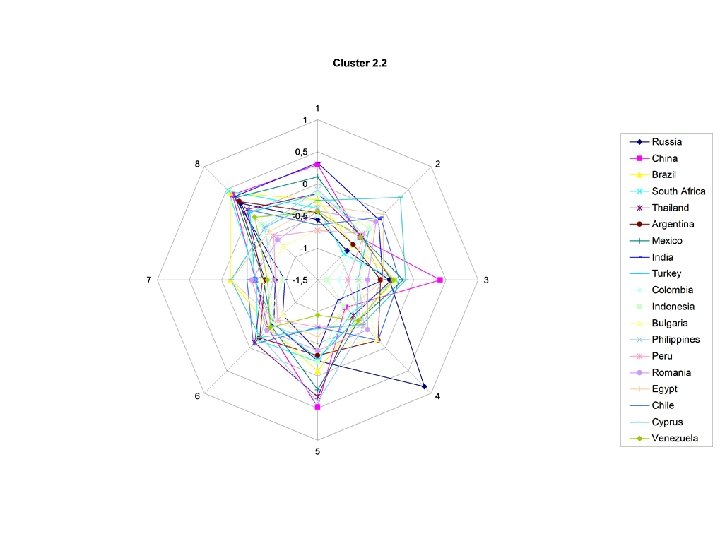
 Possible NISs classification for 1 st and 2 nd level of the 3 -level structure Megacluster 1 – Developed NIS Cluster 1. 1 – Dynamic innovation systems Cluster 1. 2 – Performing innovation systems Cluster 1. 3 – Unevenly developed NISs Megacluster 2 – Developing NIS Cluster 2. 1 – Catching up NISs Cluster 2. 2 – Hesitating NISs Cluster 2. 3 – Unformed NISs
 MEGACLUSTERS SUBCLUSTERS Groups of Countries M. 0.") The cluster structure (Megacluster 2 next slide) MEGACLUSTERS SUBCLUSTERS Groups of Countries M. 0. Hong-Kong C. 0 M. 1. G 1 C. 1. 1 Ireland + Netherlands + G 2 Switzerland + Finland + Singapore + Sweden S. C. 1. 2. 1 Germany + UK G 3 C. 1. 2 + France + Italy + South Korea + Taiwan S. C. 1. 2. 2 U. S. + Japan G 4 S. C. 1. 2. 3 Canada + G 5 Norway + Australia + Austria + New Zealand + Spain C. 1. 3 Denmark +Belgium + Luxembourg G 6
The cluster structure (Megacluster 2 next slide) MEGACLUSTERS SUBCLUSTERS Groups of Countries M. 0. Hong-Kong C. 0 M. 1. G 1 C. 1. 1 Ireland + Netherlands + G 2 Switzerland + Finland + Singapore + Sweden S. C. 1. 2. 1 Germany + UK G 3 C. 1. 2 + France + Italy + South Korea + Taiwan S. C. 1. 2. 2 U. S. + Japan G 4 S. C. 1. 2. 3 Canada + G 5 Norway + Australia + Austria + New Zealand + Spain C. 1. 3 Denmark +Belgium + Luxembourg G 6
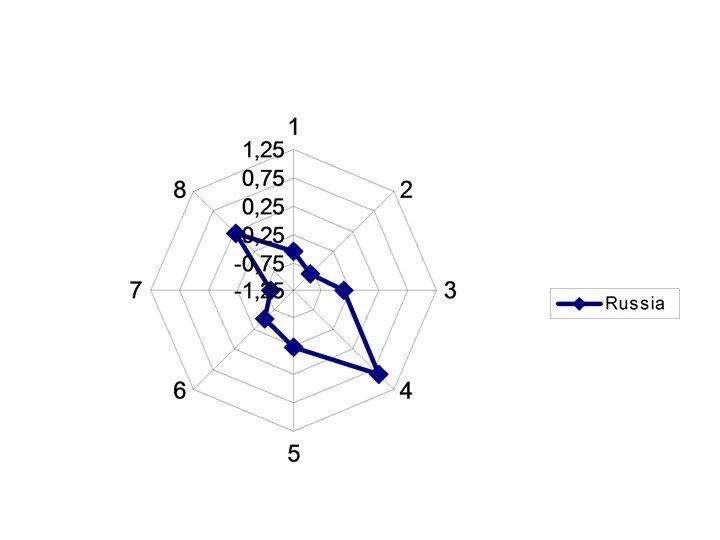
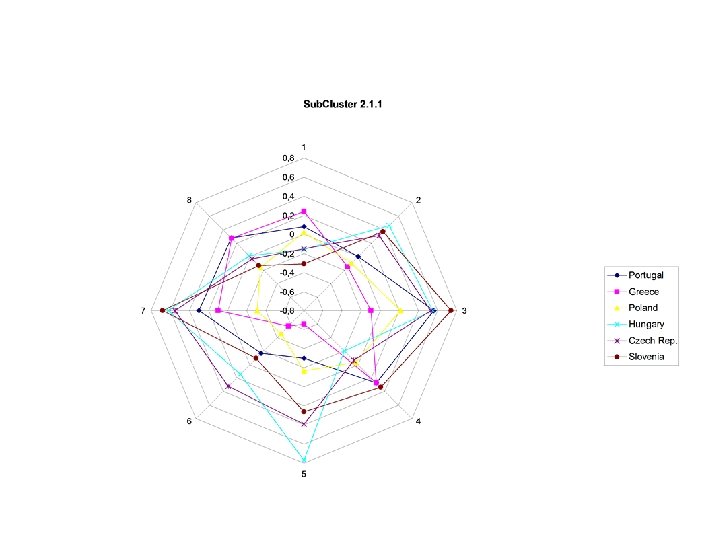
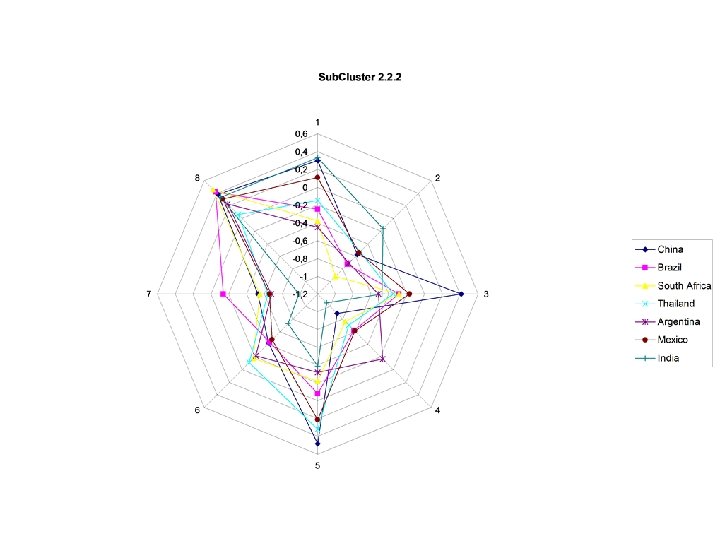
 MEGACLUSTERS M. 2. CLUSTERS C. 2. 1") The cluster structure (only Megacluster 2 here) MEGACLUSTERS M. 2. CLUSTERS C. 2. 1 SUBCLUSTERS Groups of Countries G 7 S. C. 2. 1. 2 Malaysia + Malta G 8 S. C. 2. 1. 3 Latvia + Estonia + Lithuania + Slovak R. + Ukraine C. 2. 2 S. C. 2. 1. 1 Portugal + Greece + Poland + Hungary + Czech R. + Slovenia G 9 G 10 S. C. 2. 2. 1 China + Brazil + South Africa + Thailand + Argentina + India + Mexico G 11 S. C. 2. 2. 3 Turkey + Colombia + Bulgaria + Indonesia + Philippines + Peru + Romania G 12 S. C. 2. 2. 4 Egypt + Cyprus + Chile + Venezuela C. 2. 3 S. C. 2. 2. 1 Russia G 13 S. C. 2. 3. 1 Algeria+Vietnam+Iran+ Morocco+Bangladesh G 14 S. C. 2. 3. 2 Pakistan+Kenya+Ethiopia+ Myanmar+Tanzania+Sudan+ Nigeria+ D. R. Congo G 15
The cluster structure (only Megacluster 2 here) MEGACLUSTERS M. 2. CLUSTERS C. 2. 1 SUBCLUSTERS Groups of Countries G 7 S. C. 2. 1. 2 Malaysia + Malta G 8 S. C. 2. 1. 3 Latvia + Estonia + Lithuania + Slovak R. + Ukraine C. 2. 2 S. C. 2. 1. 1 Portugal + Greece + Poland + Hungary + Czech R. + Slovenia G 9 G 10 S. C. 2. 2. 1 China + Brazil + South Africa + Thailand + Argentina + India + Mexico G 11 S. C. 2. 2. 3 Turkey + Colombia + Bulgaria + Indonesia + Philippines + Peru + Romania G 12 S. C. 2. 2. 4 Egypt + Cyprus + Chile + Venezuela C. 2. 3 S. C. 2. 2. 1 Russia G 13 S. C. 2. 3. 1 Algeria+Vietnam+Iran+ Morocco+Bangladesh G 14 S. C. 2. 3. 2 Pakistan+Kenya+Ethiopia+ Myanmar+Tanzania+Sudan+ Nigeria+ D. R. Congo G 15
") STEP 1 + STEP 2 Mapping NISs (dimensions, size, ranking)
STEP 1 + STEP 2 Mapping NISs (dimensions, size, ranking)
 Part 4 Towards a NISs taxonomy + Further remarks 1 st conclusion What differentiates most the countries in the sample is their performance in three critical dimensions: innovation diffusion and (but to a lesser extent) knowledge • They separate clearly countries in M 1 and M 2 • Further: between clusters (and even between certain subclusters) one can detect strong behavioural differences along the first two dimensions
 2 nd conclusion Another aspect that emerged as important in differentiating clusters (and subclusters as well) is the overall country size (GDP, population) 3 rd conclusion Finally, natural resources (being them minerals, forests, good grazing lands or sun and beaches) seem to be relevant for some NIS’s
") A possible taxonomy of NISs (based on the localisation of countries in “NIS space”) Critical dimensions (Innovation, Diffusion…) Absolute high values Absolute Low values Megaclusters M. 0, M. 1 M. 2 Clusters and subclusters Relatively y High in y Low in Low both High in Innovatio n and Innovatio n and Low in High in n and Low in Diffusion Critic al contin -gency factor Large/ Countr /Very y Size large Small/ /medium Good natural resources C. 1. 2 Relatively Low in Innovation and High in Diffusion Relativel y Low both in Innovatio n and Diffusion C. 2. 1 C. 2. 3 C. 2. 2. C. 1. 1 C. 1. 3 Subclus t. 1. 2. 3 ↑ (Nigeria,
A possible taxonomy of NISs (based on the localisation of countries in “NIS space”) Critical dimensions (Innovation, Diffusion…) Absolute high values Absolute Low values Megaclusters M. 0, M. 1 M. 2 Clusters and subclusters Relatively y High in y Low in Low both High in Innovatio n and Innovatio n and Low in High in n and Low in Diffusion Critic al contin -gency factor Large/ Countr /Very y Size large Small/ /medium Good natural resources C. 1. 2 Relatively Low in Innovation and High in Diffusion Relativel y Low both in Innovatio n and Diffusion C. 2. 1 C. 2. 3 C. 2. 2. C. 1. 1 C. 1. 3 Subclus t. 1. 2. 3 ↑ (Nigeria,
 Further conclusions : methodological Need of appropriate indicators e. g. : on networking, on innovation in low and medium tech sectors, even detailed R&D data lacking
 Further conclusions: policy application Responds to policy demand for guidance • Comparability/benchmarking • Summary measures Scoreboards have been produced • But criticized on grounds of “reductionism”
 Compare different NISs • visualize graphically each NIS relevant") Potential for policy-making purposes (1) Compare different NISs • visualize graphically each NIS relevant dimensions • applicability to both the advanced and the catching up economies (2) NIS auto-diagnosis • observe weaker and stronger dimensions • determine whether NIS is balanced/uneven • assess evolution over time
Potential for policy-making purposes (1) Compare different NISs • visualize graphically each NIS relevant dimensions • applicability to both the advanced and the catching up economies (2) NIS auto-diagnosis • observe weaker and stronger dimensions • determine whether NIS is balanced/uneven • assess evolution over time