

5f8ca20ca66fc14af862da18109d1e99.ppt
- Количество слайдов: 84
 "Tools to Help You Achieve a Higher Say/Do Ratio" Using Dashboards to Measure and Improve Service Levels, Cost per Case, and Supply Expense Metrics 3 rd Party Decision Support to Manage Information on Physician Preference Items to Drive Decisions Alignment with Internal and External Benchmarks to Target and Reduce Costs

 “It is not the strongest of the species that survives, nor the most intelligent, but the one most responsive to change. ” —Charles Darwin
 “Without being disrespectful, I consider the U. S. healthcare delivery There are virtually no performance measurements and no standards. system the largest cottage industry in the world. Trying to measure performance … is the next revolution in healthcare. ” Richard Huber, former CEO, Aetna
 “Some grocery stores have better technology than our hospitals and clinics. ” —Tommy Thompson, former HHS Secretary Source: Special Report on technology in healthcare, U. S. News & World Report
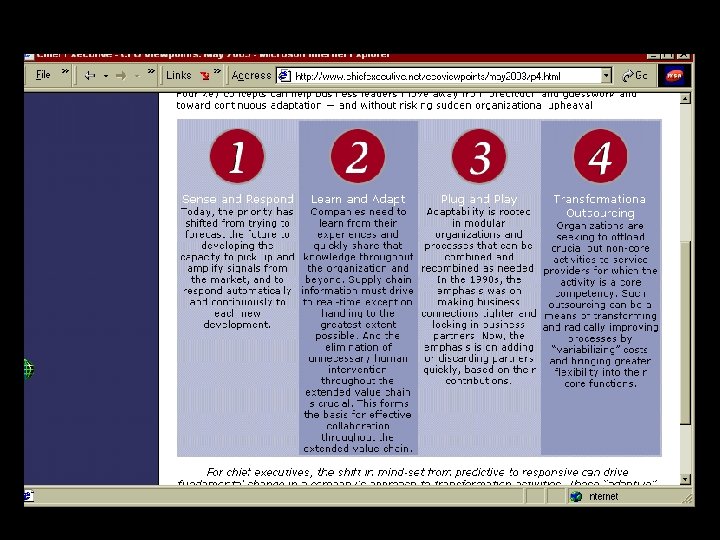
 Adaptation Four key concepts can help business leaders move away from prediction and guesswork and toward continuous adaptation — and without risking sudden organizational upheaval.
 Business Behaviors Need to Change
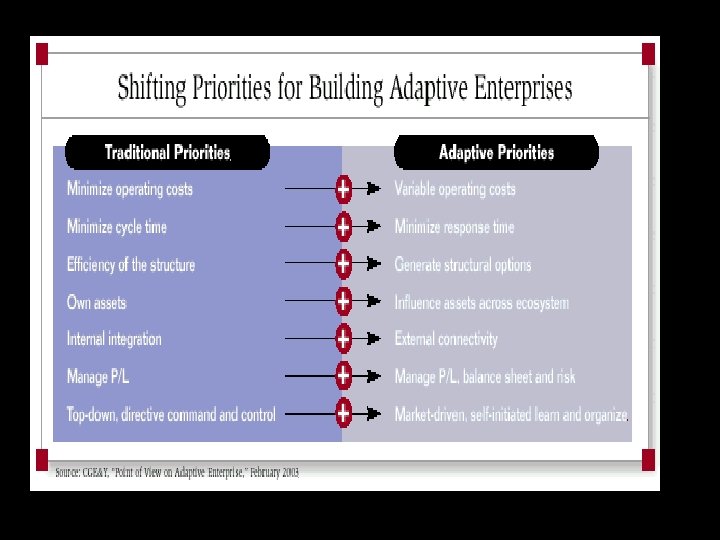
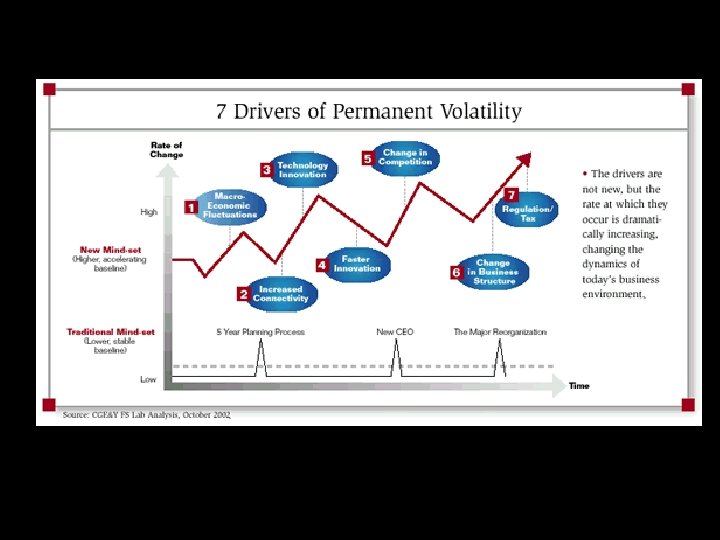
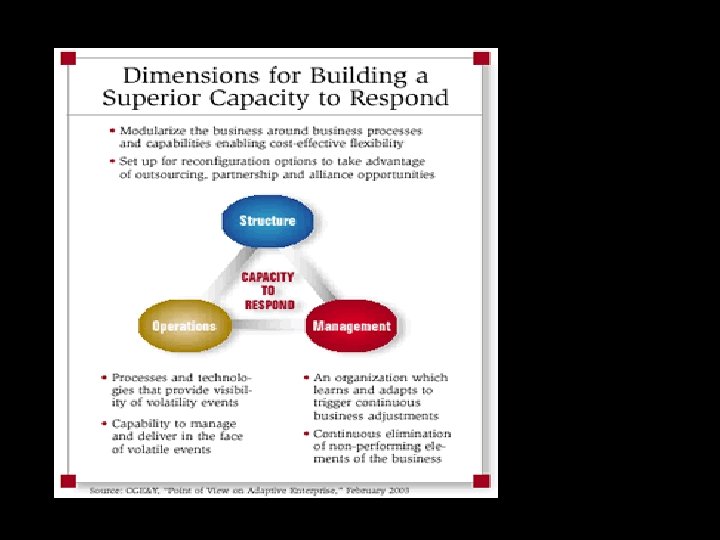
 Our Business Environment Change and Adaptation is Required Even in the face of such volatility, some companies continue to prosper. What’s their secret? Increasingly, they have one characteristic in common: They have developed the capacity to respond to change. In fact, they are systematically adaptive in their infrastructures, processes and mind-sets. Consider these examples:
 Dell Computer leverages an adaptive supply chain to lower fixed costs while responding to and profiting from increases in demand — maintaining its position as a leading PC maker in the process. GE Capital creates or sells off business units based on market conditions, incubating new units until they reach a minimum profit threshold.
 Wal-Mart has built a private exchange for tier-one suppliers to exchange realtime information about sales within each store worldwide, enabling greater transparency and responsiveness. Nokia has created an internal division whose mission is to facilitate business opportunities among company divisions and partners, unlocking value in the extended supply chain.
 Why Measure? To: Not to: • Identify ways to improve • Cause Change • Track performance improvements • Focus efforts on “right things” • Communicate strategies and direction • Recognize/ reward • • Threaten Inhibit change Reduce risk-taking Make comparisons between like units • Protect one’s backside © N³
 Measure the “right things” Traditional Measurements • Focus on costs and control • Top-down driven (nonparticipative • Perpetuates “turfism” Desired Measurements • Effectiveness – Doing the right things – Quit doing wrong things • • Efficiency Support strategic initiatives Simple Involve employees in the development • Reduces “turfism” © N³
 Measurements -#1 Critical Success Factor Ø You can get everything else right, but if you deploy a poor set of measures (or none at all), any positive change accomplished will soon be undermined by ineffectiveness and inefficiencies. Ø There is no more powerful means of communicating that things are going to be different from this point forward than to reshape what is being measured. Ø A goal-focused measurement system is the best vehicle for institutionalizing targeted changes in the management process and galvanizing management action. Excerpts from “Better Change” Price Warehouse © N³
 © N³
© N³
 © N³
© N³
.") “Operations is policy. ” —Fred Malek* *Andy Pearson. Al Mc. Donald. Jack Welch(? ). U. S. Grant. Horatio Nelson.
“Operations is policy. ” —Fred Malek* *Andy Pearson. Al Mc. Donald. Jack Welch(? ). U. S. Grant. Horatio Nelson.
 “Execution is the job of the business leader. ” —Larry Bossidy & Ram Charan/ Execution: The Discipline of Getting Things Done
 “Execution is a systematic process of rigorously discussing hows and whats, tenaciously following through, and ensuring accountability. ” —Larry Bossidy & Ram Charan/ Execution: The Discipline of Getting Things Done
 SUPPLIES EXPENSE INFORMATICS MODEL EDUCATION OF THE BOARD OF TRUSTEES
 Resource Management Update May 24, 2004 1. Recap of June 24, 2002 Presentation 2. Where we are NOW 3. What are we doing about it
 June 24, 2002 Top Level Supply Chain Performance Indicators Aggregate Nw. H performance against the better performing hospitals for Total Supply Expense as a % of Net Patient Revenue : FY 03 Requested $$ NWH performance is projected at 14. 55%, versus the Better Performing Hospital’s 14% The potential annualized savings yield should be $. 879 million. Aggregate Nw. H performance against better performing hospitals for Supply Expense per Adjusted Discharge (CMI Adjusted, including drugs) SEADC: FY 03 Requested $$ NWH performance is projected at $787 versus the Better Performing Hospitals $750 per SEADC. The potential annualized savings yield should be $. 95 million.
 June 24, 2002 NWH Performance to Benchmarks We are good, but we can improve
 What Do We Need to Do UPDATE 5. 24. 04 Use existing and new reporting tools for targeting and trending Expanded Access/Training to Meditech Materials Management COMPLETED Supplies expense by product by EOC trending Identify highest use/highest cost supplies determine if opportunities for cost reduction exist COMPLETED Review, track and report on existing and new cost reduction programs for expected performance IMPLEMENTED Embrace and report on Partners Contracting IMPLEMENTED Value Analysis progresses to Supplies Formulary Process NOT IMPLEMENTED
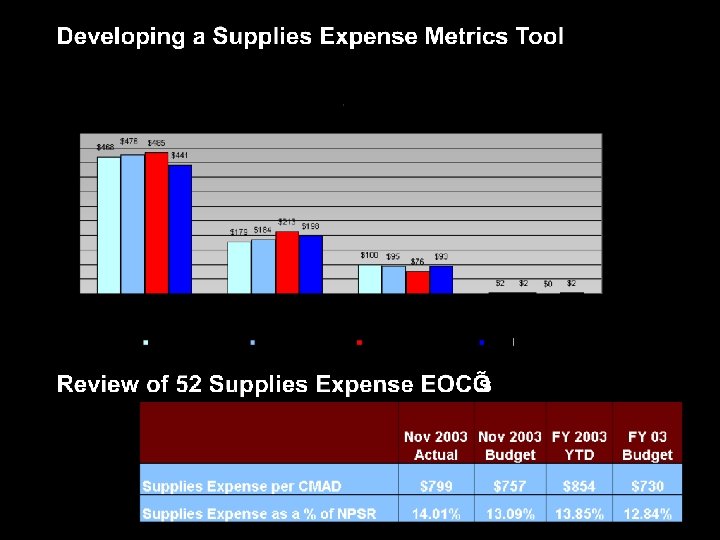
 May 24, 2004 NWH Performance to Benchmarks Actual Performance, New Tools in Place Source:
 Supplies Expense as a % NPSR
 Supplies Expense per Adjusted CMAD
 May 24, 2004 NWH Performance to Benchmarks OKAY, but A lot of Pick and Shovel Work Required NEED TO KEEP DIGGING Source
 Major Expense Drivers Variance Analysis
 FY 04 YTD Top 99 Items for Perioperative Services 35 pacemakers not planned 21% growth in ortho implants
 April 2004 Top 99 Items for Perioperative Services No apparent dissonance on supplies consumption Trend seems in line with activity
 TSI puts OR supplies expense variance in perspective
 Sustain the Gain (continuous measurement) Focus on effective") Resource Management Progressive Processes (manage concurrently) Sustain the Gain (continuous measurement) Focus on effective process and product selection & utilization will generate the most sustainable opportunities for resource management. Improve/Maintain Optimum Product Pricing thru Contracting with PHS Effective Product and Process Standardization PHS/NWH (where applicable) and NWH 21
Resource Management Progressive Processes (manage concurrently) Sustain the Gain (continuous measurement) Focus on effective process and product selection & utilization will generate the most sustainable opportunities for resource management. Improve/Maintain Optimum Product Pricing thru Contracting with PHS Effective Product and Process Standardization PHS/NWH (where applicable) and NWH 21
 Technology Arms Race 2004 The Arms Race 1950’s and 1960’s
 NUTS AND BOLTS
 Supplies Expense Focus 85% of Non Salary Expense for a Nursing Unit is Supplies Expense Add a graph
 Breakout of Costs
 Department Review of Trended Supply $$ Activity
 Department Specific Trend Activity
 Used My Supply Lines to Confirm Trend Across
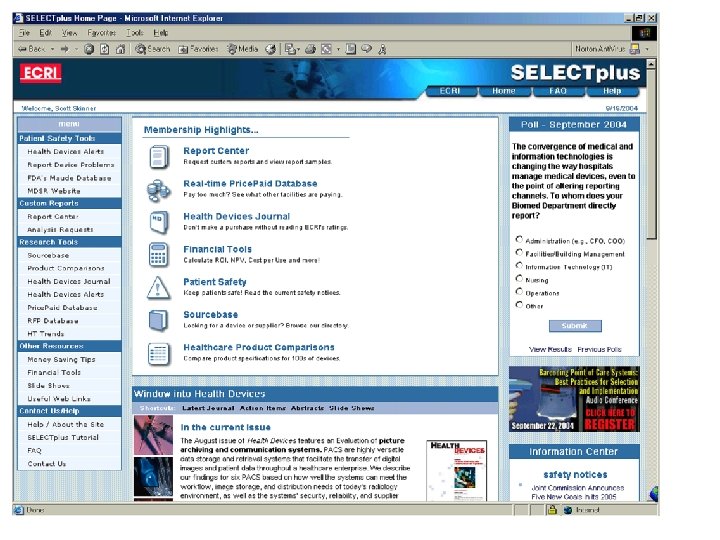
 THIRD PARTY DECISION SUPPORT CONSULTANTS DATA MANAGERS NOT FOR PROFIT FIRMS
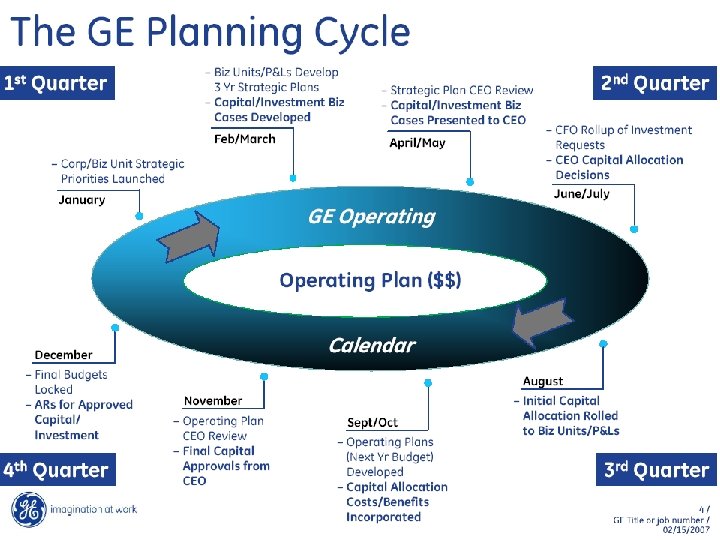
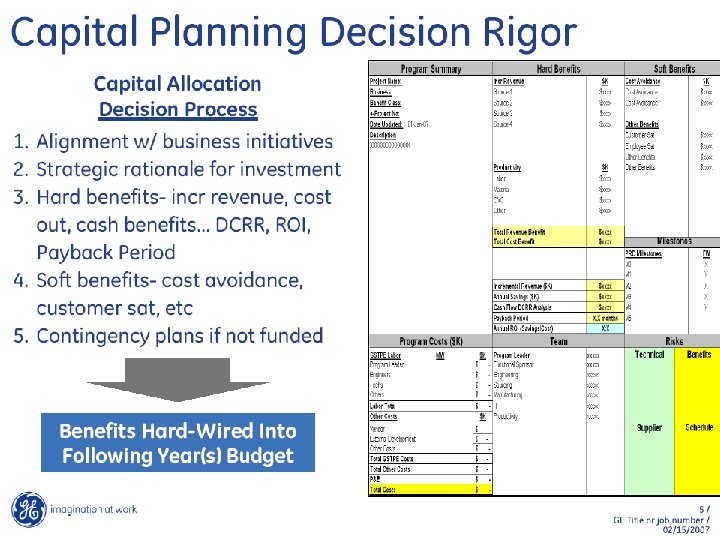
 Capital Equipment Planning Requires Attention To Multiple Processes Forecasting Time People Process Research Utilization Best Pricing New Technology “Actual Need versus Want” Scope Technology Resources Equipment Management Long Range Planning Built on Productivity versus Reactive Fact Based Forecasting Transformation Continuum Accenture Value: IT • End-to-End Product Knowledge • Clinical Background & Experience • Relevant Peer Insights • Structured Approach • Credibility and National Perspective • Current Benchmarking for Equipment Cash Flow Pricing and Trends Improvement Integration Interfaces Upgrades Accurate Budgets Information Flow Appropriate Selection Anticipated Repairs and Replacements Acquisition Assistance Revenue Enhancement

 50
50
 Graphs of Quoted Prices and Discounts of comparable purchases. 51
 National Analysis by Category 52
 Savings by Supplier 53
 PERFORMANCE REPORTING THE GROUND TRUTH
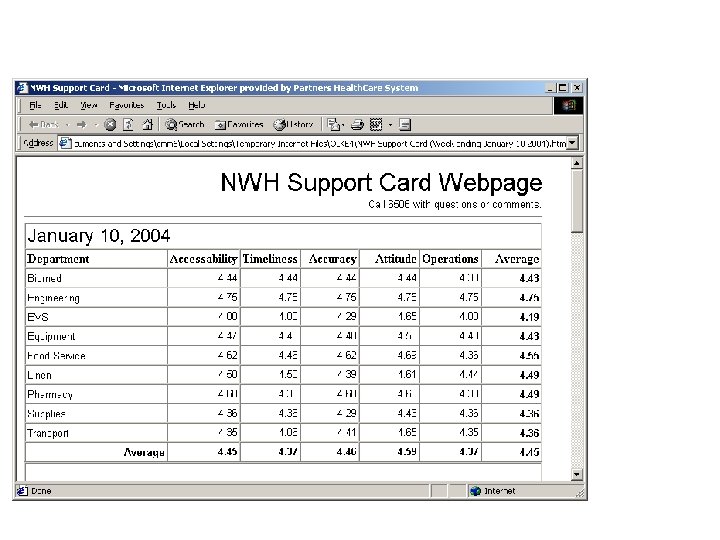
 Dashboard monitored daily; big leap above 50 th percentile in courtesy of staff cleaning
 November 2003 thru Dec 2003 performance on cleanliness has improved from the 23 rd percentile to projected 40 th percentile December 2003 performance surpassed MA peer group mean in almost all categories; 1 st time in Calendar 2003 standard room score was greater than the mean score. 31 st percentile to >50 th percentile movement
 Transport Stats thru April 2004
 Efficiency Model for Staffing Determination Model assumes 465 k cleanable square feet 1, 000 sq feet cleaned per productive hour for clinical space and 1, 400 sq feet cleaned per productive hour for office space 62. 62 Productive FTE’s Required (does not include 2. 8 FTE’s for SSA) Using an 11% PET backfill calculation, FTE requirement is 69. 51 + 2. 8 for SSA, this totals
 ABC Model Activity based model for staffing developed based on detailed analysis and requirements to establish and maintain a clean environment SSA workload included Productive FTE’s required total 72. 53; Using an 11% PET backfill calculation, the total FTE requirement is 80. 5
 Summary of ABC Model by Position
 Bed Turnover Housekeeping • Instant notification of patient departure • Visualization of entire enterprise • Fast means of tracking workflow • Easy view of staff productivity
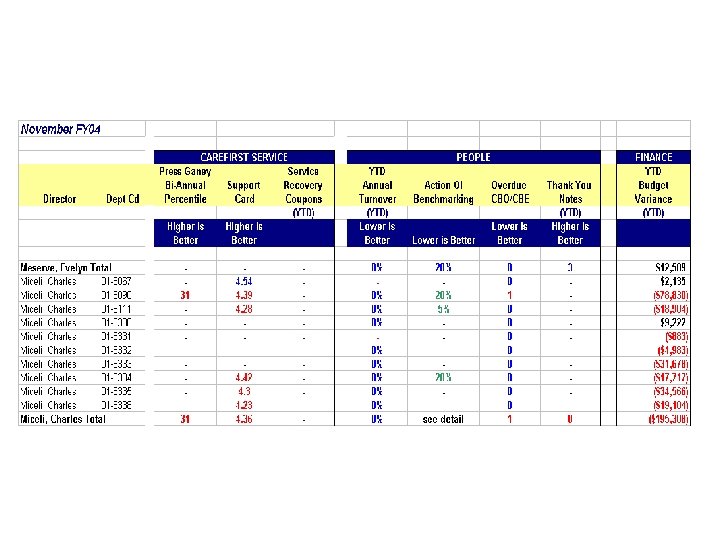
 Action OI data compares productivity of the 158 and 164 job codes (approx 45 FTE's would match their data) Based on those two job codes, we are performing 50% better than top 25%ile. We are at 2. 91 hrs per adj discharge, 25 th%ile is 4. 41 hrs per adj discharge. Top 2%: 5% Benchmarking Performance Action OI Current FTE run rate is in the 90 th percentile based on clinical activity
 Real World Dashboard
 GEMS 25 Mission & Deliverables Create a digital nervous system whereby information needed for business decisions is available real-time and on-line. 3 CTQ’s • Global Consistency • Weekly Rigor (Roadmap to be Daily) • Automated (Drill-down capability) How do we know if we’ve won? • • • 3 Day Close! One Set of Numbers Operating Meetings Leverage the Web Information Available on “Pull” Basis People Like to be at Work Decisions Made Easy General Electric Company Confidential and Proprietary Information
 E-Training, Communication, & Documentation GEMS 25 The GEMS 25 Vision Productivity Process Content WHAT IF Wizards Data Mining Dashboards/ Metrics Analysis Alerts Reporting Packages Partnering & Decision Making My GEMS 25 Reporting GEMS 25 Data mart Aggregated measures and hierarchies data Measures Library Standardized definition of each measure and library of business rules General Electric Company Confidential and Proprietary Information
 GEMS 25 Why? • Fast communication • Peaks interest • Gen 1 easy to do • Creates High Level design upfront Follow-on • Simplify some more • Automate ==> REAL-TIME • Add Drillable layers What’s not Allowed: • Webify Gen 1 and walkaway • Webify with no Six Sigma Rigor • Launch with bad data Impact on GEMS Identify =>Webify=>Simplify Low “Quick Hit” approach - High To Webify or Not to Webify Ease of Implementation Hard • Quick Hit - Launch & Learn • Simplify and Automate • Each Metric has a Staff Sponsor Change the Way We Think. . . Launch & Learn General Electric Company Confidential and Proprietary Information
 e. Finance Transformation GEMS 25 Five Processes Account For 59% Of Total Finance FTEs Staff Time Allocation By Category Medical Systems’ Spends 70% of our Decision Support in Data Collection vs. Analysis Allocation of Decision Support time Medical Systems Top Decile GEMS 25 Enables: • Self Service and Drill Down Capability • Capacity for Value-added Analytical Activities • Finance to Become a Better Strategic Business Partner General Electric Company Confidential and Proprietary Information
 GEMS 25 GEMS IT Cockpit Organization Needs Vary … Drive Culture General Electric Company Confidential and Proprietary Information
 GEMS 25 GEMS Environmental Health & Safety Cockpit Organization Needs Vary … Drive Culture General Electric Company Confidential and Proprietary Information
 GEMS 25 Managing Information How will you lead your business? …the Ys What are your critical few? …the Xs Where do you get your data? …Operating Mechanisms “The Web”, digital cockpit, Quickplace, email When do you need it? …Timing Daily, Weekly, Monthly, Quarterly How Can the Right Visibility Make You a More Successful Leader? General Electric Company Confidential and Proprietary Information
 GEMS 25 The Contemporary GE Leader Forward Looking … Action Oriented … Analytical Self-Service … Imagine Real-time monthly pro-forma for the year Automated e-mail trigger for cost overruns Predictive Orders and Sales Spontaneous CSO notification for critical customers GEMS 25 … enabling your future! General Electric Company Confidential and Proprietary Information
 GEMS 25 Observations/Learning's • CEO needs to stay engaged throughout… “Joe looks at it” • Need Strong Implementation Leader … Functional • Identify Critical Few Metrics • Balance Tops Down with Customer & Organization Input • Over communicate … create a digitization Vision • Spotlight leaders that are changing the way they work • Data integrity is key but operational leaders need to own it • Will probably take longer than planned… stay the course Overcome Cultural Barriers with Consistent Commitment, Relevance & Strong Leadership General Electric Company Confidential and Proprietary Information
 Why are we doing all this stuff?
 Warming Smoldering Igniting Burning CMME The BLUE Line displays the Operating Margin for each Fiscal Year RED Line is Expense GREEN Line is Revenue, After FY 08 the RED line is Above the GREEN Line. Expenses are greater than Revenue = Burning Platform Assumptions • The incremental revenue from the 3 big Payors(Tufts, Harvard and Blue Cross) is $7 million less in FY 08 than in FY 07 • Our Payor Mix is changing where more of our reimbursement will be paid at or below cost. • Salary rates will still continue to increase due to labor shortages THE BURNING PLATFORM WHAT HAPPENS WITHOUT OUR INTERVENTION !!
 Warming Smoldering Igniting Burning THE BURNING PLATFORM WHAT HAPPENS WITHOUT OUR INTERVENTION !! CMME Assumptions • The incremental revenue from the 3 big Payors(Tufts, Harvard and Blue Cross) is $7 million less in FY 08 than in FY 07 • Our Payor Mix is changing where more of our reimbursement will be paid at or below cost. • Salary rates will still continue to increase due to labor shortages Revenue and Expense Lines Intersect Negatively after FY 08
 Warming Smoldering Igniting THE BURNING PLATFORM WHAT HAPPENS WITHOUT OUR INTERVENTION !! Burning CMME Assumptions • The incremental revenue from the 3 big Payors(Tufts, Harvard and Blue Cross) is $7 million less in FY 08 than in FY 07 • Our Payor Mix is changing where more of our reimbursement will be paid at or below cost. • Salary rates will still continue to increase due to labor shortages
 The “GAP” is sensitive to early action? The Cost CMME Management/Margin Enhancement effort is aimed at early intervention. By achieving our annual margin targets we avoid the “compounding” effect. The GAP progression without intervention