

53cf7186808b1168d2a7ab9de0598b72.ppt
- Количество слайдов: 66
 TODAY • Population Geography of LA ØGrowth ØFertility ØMortality ØAge structure • Urbanization in LA ØSpatial patterns ØCauses & consequences © T. M. Whitmore
 Latin America & Caribbean ~ 569 m") • • • Population (2007 estimates) Latin America & Caribbean ~ 569 m (8. 7% of global total) USA ~ 302 m (4. 6 % of global total) World ~ 6, 525 m Caribbean ~ 40 m Central America (with Mexico) ~ 148 m Mexico ~ 106. 5 m South America (with Brazil ~ 381 m) Brazil ~ 189 m Mexico + Brazil ~ 295. 5 m (> ½ of LA; ~ © T. M. Whitmore USA)
• • • Population (2007 estimates) Latin America & Caribbean ~ 569 m (8. 7% of global total) USA ~ 302 m (4. 6 % of global total) World ~ 6, 525 m Caribbean ~ 40 m Central America (with Mexico) ~ 148 m Mexico ~ 106. 5 m South America (with Brazil ~ 381 m) Brazil ~ 189 m Mexico + Brazil ~ 295. 5 m (> ½ of LA; ~ © T. M. Whitmore USA)
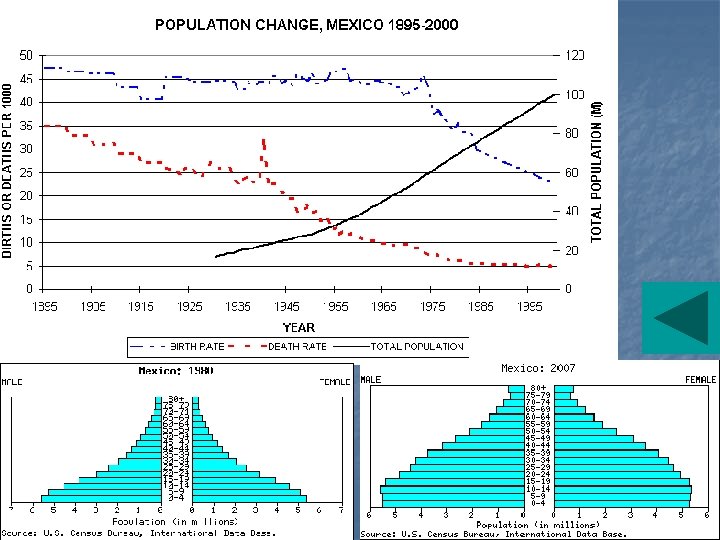
 ØMeaning of “crude” in demography") Demography: Growth related • Rate of Natural Increase (RNI) ØMeaning of “crude” in demography ØCrude Birth Rate (CBR): live births/1000 pop in a given year ØCrude Death Rate (CDR): deaths/1000 pop in a given year ØCBR - CDR = RNI § typically given as %/yr § assumes no net migration in a given year © T. M. Whitmore
Demography: Growth related • Rate of Natural Increase (RNI) ØMeaning of “crude” in demography ØCrude Birth Rate (CBR): live births/1000 pop in a given year ØCrude Death Rate (CDR): deaths/1000 pop in a given year ØCBR - CDR = RNI § typically given as %/yr § assumes no net migration in a given year © T. M. Whitmore
/yr • Latin America ~ 1. 5%/yr • USA ~") Rate of Natural Increase (RNI)/yr • Latin America ~ 1. 5%/yr • USA ~ 0. 6%/yr • World ~ 1. 2%/yr • More Developed World ~ 0. 1%/yr • Lesser developed world ~ 1. 5% - 1. 8%/yr • Historical trends in LA: 1950 s - 1980 s ØDeclining but less rapidly now © T. M. Whitmore
Rate of Natural Increase (RNI)/yr • Latin America ~ 1. 5%/yr • USA ~ 0. 6%/yr • World ~ 1. 2%/yr • More Developed World ~ 0. 1%/yr • Lesser developed world ~ 1. 5% - 1. 8%/yr • Historical trends in LA: 1950 s - 1980 s ØDeclining but less rapidly now © T. M. Whitmore
 Population projections for 2025 • Latin America 700 m • USA 350 m • World 7490 m • Caribbean 48 m • Mexico 129 m • South America 465 m • Brazil 229 m • Mexico + Brazil 358 m (~ = USA) © T. M. Whitmore
 • • • Rate of Natural Increase II Caribbean ~ 1. 1%/yr Central America (including Mexico) ~ 1. 8% Mexico ~ 1. 7 %/yr South America (including Brazil) ~ 1. 5%/yr ØBrazil ~ 1. 4%/yr Notable extremes ØHIGH (~ 2. 5%/yr): § Guatemala, Honduras, Nicaragua, § Haiti § Bolivia ØLOW (~ 1%/yr or less): § Costa Rica § Cuba, Puerto Rico © T. M. Whitmore § Uruguay, Chile, Argentina
 • = Average total number of births to a •") Total Fertility Rate (TFR) • = Average total number of births to a • woman in her lifetime (superior to CBR) ~ 2. 1 => parents only replacing themselves (called replacement level fertility) Øneed the extra 0. 1 due to childhood deaths © T. M. Whitmore
Total Fertility Rate (TFR) • = Average total number of births to a • woman in her lifetime (superior to CBR) ~ 2. 1 => parents only replacing themselves (called replacement level fertility) Øneed the extra 0. 1 due to childhood deaths © T. M. Whitmore
 • Latin America ~ 2. 5 • USA ~ 2. 1 •") Fertility (TFR) • Latin America ~ 2. 5 • USA ~ 2. 1 • World ~ 2. 7 • More Developed World ~ 1. 6 • Lesser developed world ~ 2. 9 - 3. 3 • Caribbean ~ 2. 5 • Central America (including Mexico) ~ 2. 7 • Mexico ~ 2. 4 • South America (including Brazil) ~ 2. 4 • Brazil ~ 2. 3 © T. M. Whitmore
Fertility (TFR) • Latin America ~ 2. 5 • USA ~ 2. 1 • World ~ 2. 7 • More Developed World ~ 1. 6 • Lesser developed world ~ 2. 9 - 3. 3 • Caribbean ~ 2. 5 • Central America (including Mexico) ~ 2. 7 • Mexico ~ 2. 4 • South America (including Brazil) ~ 2. 4 • Brazil ~ 2. 3 © T. M. Whitmore
 § Guatemala (> 4), Honduras,") Fertility II • Notable extremes ØHIGH (TFR > 3) § Guatemala (> 4), Honduras, Nicaragua § Haiti (>4. 5) § Bolivia, Ecuador ØLOW (< 2. 5) § Costa Rica, Mexico § Cuba, Puerto Rico § Uruguay, Brazil, Argentina © T. M. Whitmore
Fertility II • Notable extremes ØHIGH (TFR > 3) § Guatemala (> 4), Honduras, Nicaragua § Haiti (>4. 5) § Bolivia, Ecuador ØLOW (< 2. 5) § Costa Rica, Mexico § Cuba, Puerto Rico § Uruguay, Brazil, Argentina © T. M. Whitmore
 Mortality ØMeasured by “life expectancy at birth” (Eo)") • • Death related (mortality) Mortality ØMeasured by “life expectancy at birth” (Eo) Ø= AVERAGE projected span of life at the date for a pop Infant Mortality Rate (IMR) Ø# deaths of infants (< 1 yr)/1000 live births in a given yr © T. M. Whitmore
• • Death related (mortality) Mortality ØMeasured by “life expectancy at birth” (Eo) Ø= AVERAGE projected span of life at the date for a pop Infant Mortality Rate (IMR) Ø# deaths of infants (< 1 yr)/1000 live births in a given yr © T. M. Whitmore
 Latin America ~ 73 yrs") • • • Life expectancy at birth (Eo) Latin America ~ 73 yrs USA ~ 78 World ~ 68 More Developed World ~ 77 Lesser developed world ~ 64 – 66 Caribbean ~ 71 Central America (including Mexico) ~ 74 Mexico ~ 75 South America (including Brazil) ~ 72 Brazil ~ 72 Individual extremes © T. M. Whitmore
• • • Life expectancy at birth (Eo) Latin America ~ 73 yrs USA ~ 78 World ~ 68 More Developed World ~ 77 Lesser developed world ~ 64 – 66 Caribbean ~ 71 Central America (including Mexico) ~ 74 Mexico ~ 75 South America (including Brazil) ~ 72 Brazil ~ 72 Individual extremes © T. M. Whitmore
 Closely correlated with Eo & very") • • • Infant Mortality Rate (IMR) Closely correlated with Eo & very diagnostic of social underdevelopment and poverty Latin America ~ 24 (per 1000 live births -or 2. 9%) USA ~ 6. 5 World ~ 52 More Developed World ~ 6. 0 Lesser developed world ~ 57 – 61 Caribbean ~ 38 Central America (including Mexico) ~ 23 Mexico ~ 21 South America (including Brazil) ~ 24 Brazil ~ 27 Individual extremes © T. M. Whitmore
• • • Infant Mortality Rate (IMR) Closely correlated with Eo & very diagnostic of social underdevelopment and poverty Latin America ~ 24 (per 1000 live births -or 2. 9%) USA ~ 6. 5 World ~ 52 More Developed World ~ 6. 0 Lesser developed world ~ 57 – 61 Caribbean ~ 38 Central America (including Mexico) ~ 23 Mexico ~ 21 South America (including Brazil) ~ 24 Brazil ~ 27 Individual extremes © T. M. Whitmore
 Population age structure - youth • Youthful pops: % of pop < 15 years old • USA 20% • World 28% • • ØLesser developed World 31% - 34% ØMore Developed World ~ 17% Latin America 30% ØCentral America with Mexico 33% ØCaribbean 28% ØSouth America 29% Latin American extremes & © T. M. Whitmore consequences
 • USA 12% •") Population age structure - aged • Aged pops: (> 65) • USA 12% • World 7% • • ØLesser developed World 5 -6% Latin America 6% ØCentral America with Mexico 5% ØCaribbean 8% ØSouth America 6% Latin American extremes & © T. M. Whitmore consequences
Population age structure - aged • Aged pops: (> 65) • USA 12% • World 7% • • ØLesser developed World 5 -6% Latin America 6% ØCentral America with Mexico 5% ØCaribbean 8% ØSouth America 6% Latin American extremes & © T. M. Whitmore consequences
 Population age structures • Population pyramid • Concept of dependency ratio • • • Ø(pop aged 0 -15 + pop aged 65+) *100/ Pop age 15 -65 USA dependency ratio Ø 100*(20% +12%)/68% = 47 Developing world dependency ratio Ø 100*(34% + 5%)/61% = 64 Latin America dependency ratio Ø 100*(30% + 6%)/64% = 56 © T. M. Whitmore
 © T. M. Whitmore
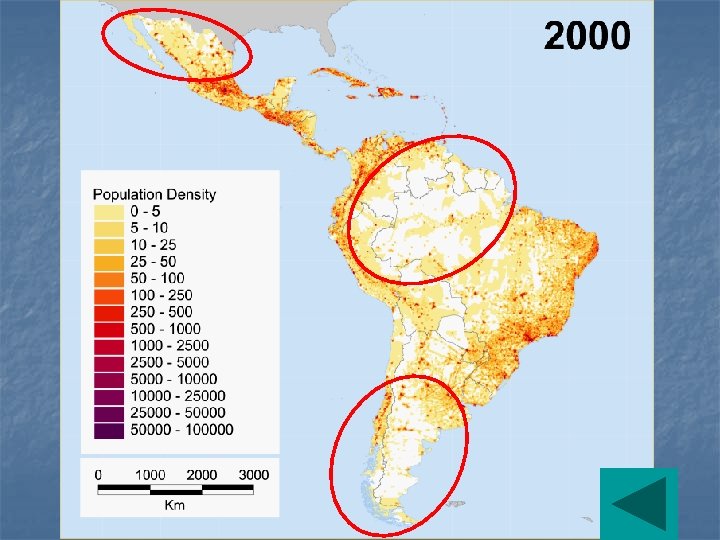
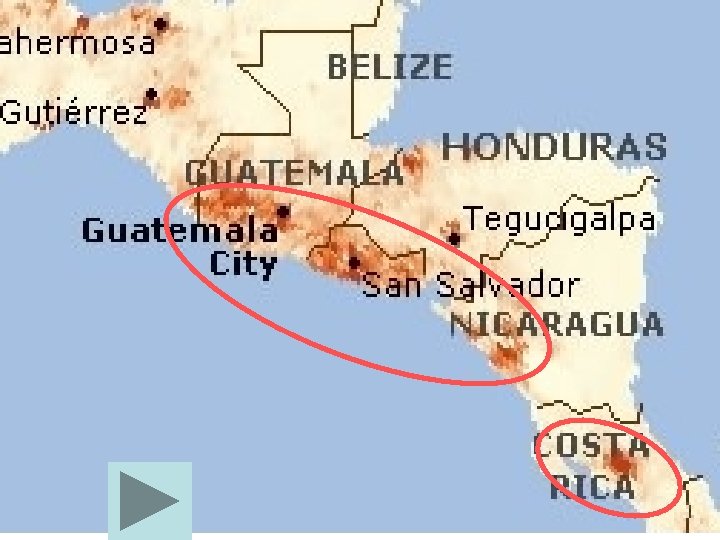
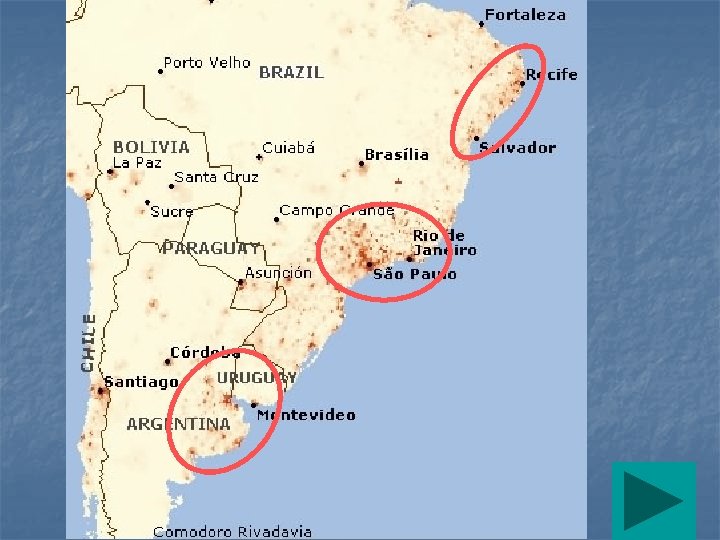
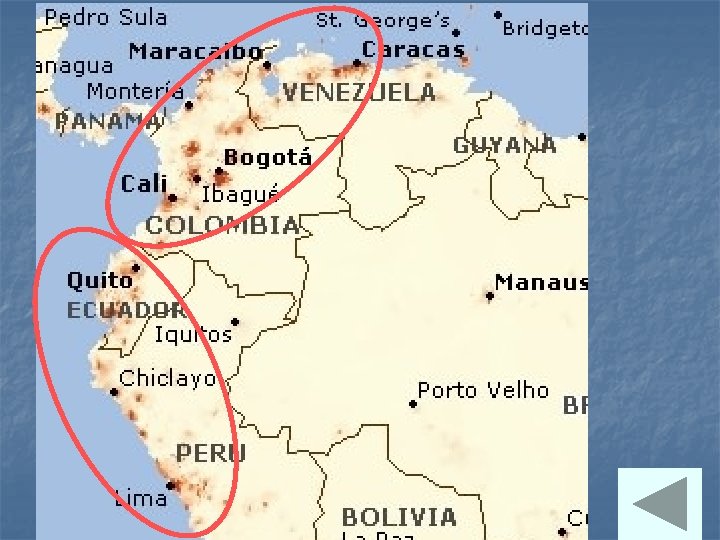
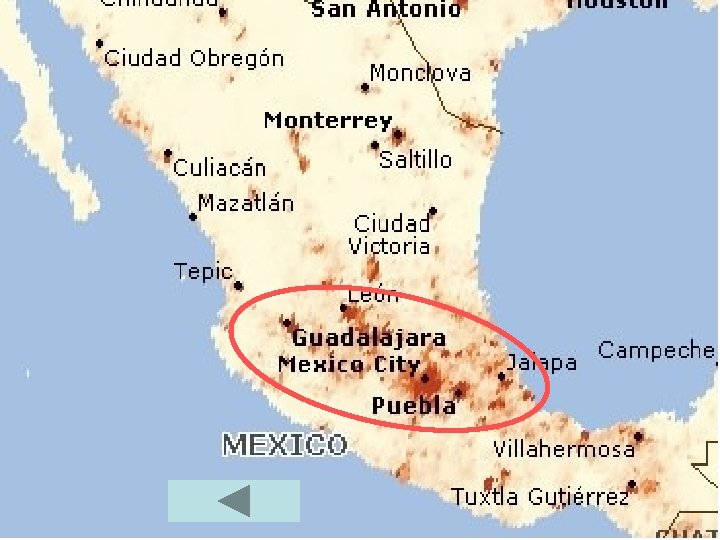
 Geographic distribution of population • High density zones • Low density zones ØSouth America’s “empty heart” ØArid zones in N Mexico & Southern Cone © T. M. Whitmore
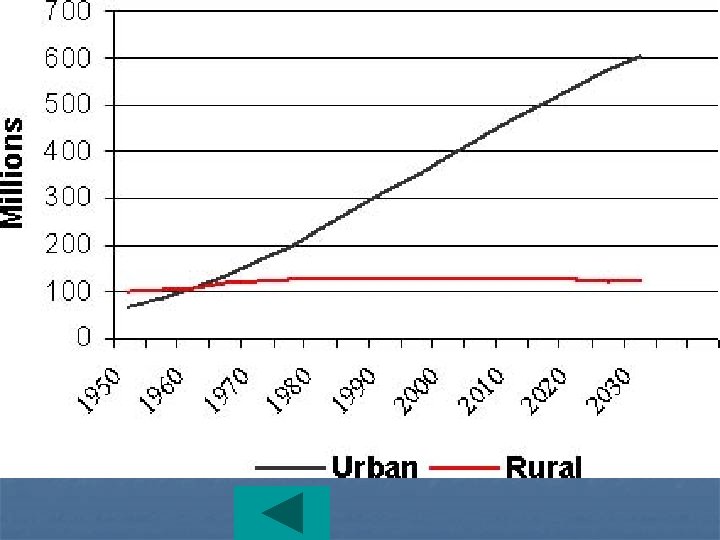
 Urbanization • Proportion of a country’s pop living in cities • • ØWorld = 49% ØGlobal South = 42 -43% ØGlobal North = 75% ØUSA = 79% ØLA = 76% Extremes in LA Large city urbanization in LA (% in cities > 1 million) © T. M. Whitmore
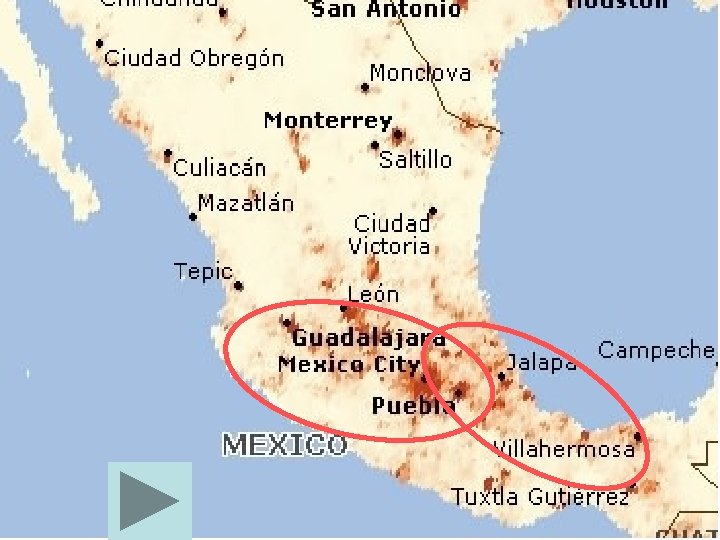
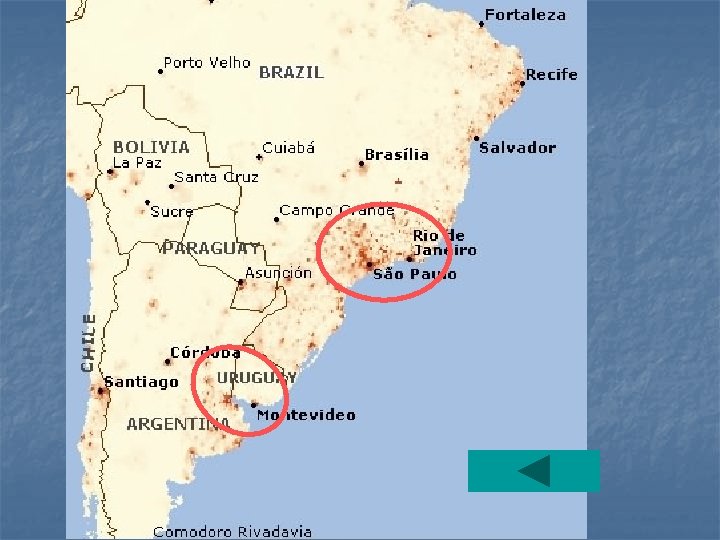
 Urbanization II • Mega-cities • ØEmerging Megalopolis zones § Central Mexico § South Brazil triangle & Río de la Plata Concept of primacy ØSingle city in a country that dominates in pop, culture, economic development, etc. ØExamples: § Santo Domingo § Guatemala City § Mexico City § Lima © T. M. Whitmore
") LA cities in World’s top 100 (19 of the top 100)
LA cities in World’s top 100 (19 of the top 100)
 Lima 10 x larger >15 x larger >20 x larger
 Roots of urban growth • Demographic ØR—to—Urban migration ØNatural increase • Economic ØIndustrialization ØRural stagnation • Organizations ØBanks and governments © T. M. Whitmore
 Benefits from urban growth • Efficient provision of social services • Cities are centers of information flow • • • and knowledge Concentrated (and better educated? ) labor pool Physical infrastructure often better Cities concentrate “human capital” Cities are a huge internal markets Easier linkages between industries Cities are often “better off” © T. M. Whitmore
 • Housing Urban growth I ØFirst destination of poor migrants is the inner city slums ØElite often still in posh neighborhoods in inner city ØOften close juxtaposition of rich and poor © T. M. Whitmore
 Elite housing, Santo Domingo © T. M. Whitmore
 Mexico City country club
 Mexican stock exchange
 Wealthy homes in Morelia, Mexico © T. M. Whitmore
 Elite house Cuidad Juarez © Pearson Education – Prentice Hall
 © W. H. Freeman & Co.
 “slum” housing • ØCalled:") Urban growth II • Planned developments • Self-help (often squatter) “slum” housing • ØCalled: favelas (Brazil), colonias proletarias, cuidades perdidas, etc. ØSeen as places of permanence Ø 25 -40% of total pop in some cities ØInitially settlements lack infrastructure ØA main characteristic is improvement New purchased housing © T. M. Whitmore
Urban growth II • Planned developments • Self-help (often squatter) “slum” housing • ØCalled: favelas (Brazil), colonias proletarias, cuidades perdidas, etc. ØSeen as places of permanence Ø 25 -40% of total pop in some cities ØInitially settlements lack infrastructure ØA main characteristic is improvement New purchased housing © T. M. Whitmore
 Planned new housing area in Mexico City
 Nezahualcoyotl: Planned housing area in Mexico City
 Nezahualcoyotl - 3 millon people
 Squatter housing in Mexico City
 Mexico City inner city
 Squatters outside Lima © Pearson Education – Prentice Hall
 © W. H. Freeman & Co.
 Self-help housing, Santo Domingo, DR © T. M. Whitmore
 Self-help housing, Santo Domingo © T. M. Whitmore
 © T. M. Whitmore Self-help housing, Santo Domingo
 Self-help housing, Santo Domingo © T. M. Whitmore
 Self-help housing, Lima © T. M. Whitmore
 Self-help housing, Saltillo, Mexico © T. M. Whitmore
 housing in Ecuador © Brad Jokish") Return migrant (remittance funded) housing in Ecuador © Brad Jokish
Return migrant (remittance funded) housing in Ecuador © Brad Jokish
 © T. M. Whitmore
 Formal sector housing, Saltillo, Mexico © T. M. Whitmore
 Formal sector housing, Tegucigalpa © T. M. Whitmore
 Formal sector housing, Tegucigalpa © T. M. Whitmore
 300+ low income homes in Ixtapaluca, Mexico - complex has more than 10, 000!
 Urban growth III • Subsidy and Sink effects • Congestion • Pollution • Loss of urban open space • Poor provision of basic services • Export of problems • Poverty generally • Employment not always good © T. M. Whitmore
 Mexico City on a rare clear day
 More typical Mexico City day
 Urban water, Santo Domingo © T. M. Whitmore
 Urban water, Santo Domingo © T. M. Whitmore
 Subsidence in Mexico City © T. M. Whitmore
 Subsidence in Mexico City © T. M. Whitmore