fbb7019bc0d5b2c69df0f8631c3b3342.ppt
- Количество слайдов: 23
 Timing and Profiling ECE 454 Computer Systems Programming Cristiana Amza Topics: n Measuring and Profiling
 “It is a capital mistake to theorize before one has data. Insensibly one begins to twist facts to suit theories instead of theories to suit facts. ” - Sherlock Holmes – 2–
 Measuring Programs and Computers – 3–
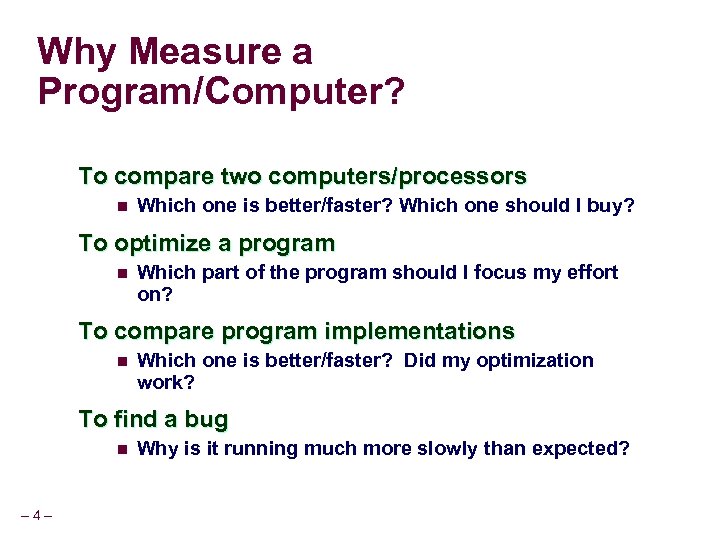 Why Measure a Program/Computer? To compare two computers/processors n Which one is better/faster? Which one should I buy? To optimize a program n Which part of the program should I focus my effort on? To compare program implementations n Which one is better/faster? Did my optimization work? To find a bug n – 4– Why is it running much more slowly than expected?
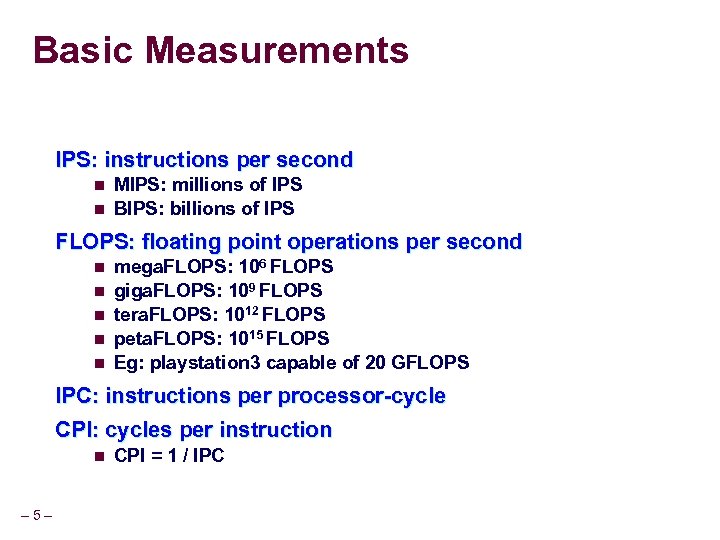 Basic Measurements IPS: instructions per second n n MIPS: millions of IPS BIPS: billions of IPS FLOPS: floating point operations per second n n n mega. FLOPS: 106 FLOPS giga. FLOPS: 109 FLOPS tera. FLOPS: 1012 FLOPS peta. FLOPS: 1015 FLOPS Eg: playstation 3 capable of 20 GFLOPS IPC: instructions per processor-cycle CPI: cycles per instruction n – 5– CPI = 1 / IPC
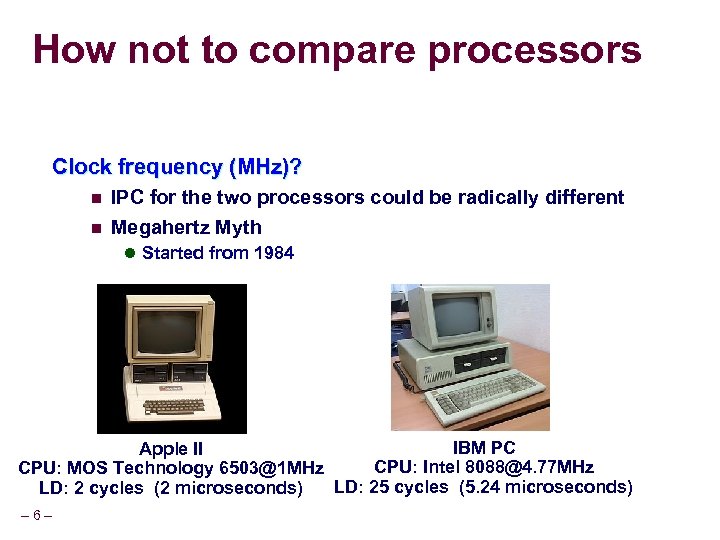 How not to compare processors Clock frequency (MHz)? n IPC for the two processors could be radically different n Megahertz Myth l Started from 1984 IBM PC Apple II CPU: Intel 8088@4. 77 MHz CPU: MOS Technology 6503@1 MHz LD: 25 cycles (5. 24 microseconds) LD: 2 cycles (2 microseconds) – 6–
 How not to compare processors Clock frequency (MHz)? n IPC for the two processors could be radically different CPI/IPC? n n dependent on instruction sets used dependent on efficiency of code generated by compiler FLOPS? n n – 7– only if FLOPS are important for the expected applications also dependent on instruction set used
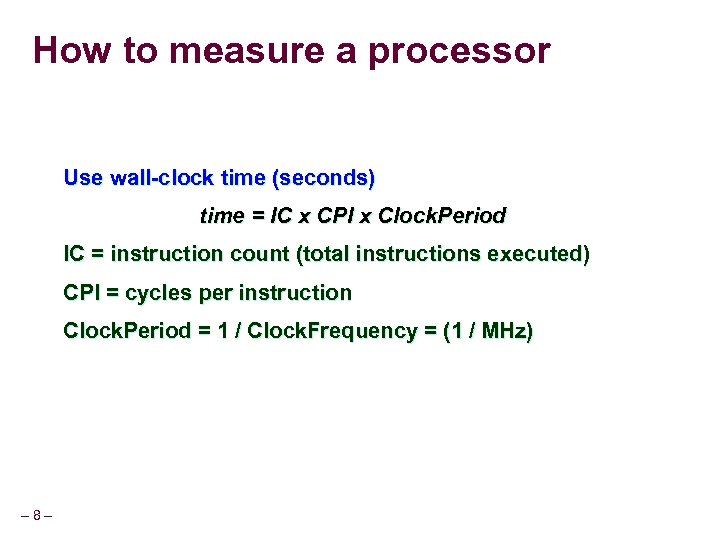 How to measure a processor Use wall-clock time (seconds) time = IC x CPI x Clock. Period IC = instruction count (total instructions executed) CPI = cycles per instruction Clock. Period = 1 / Clock. Frequency = (1 / MHz) – 8–
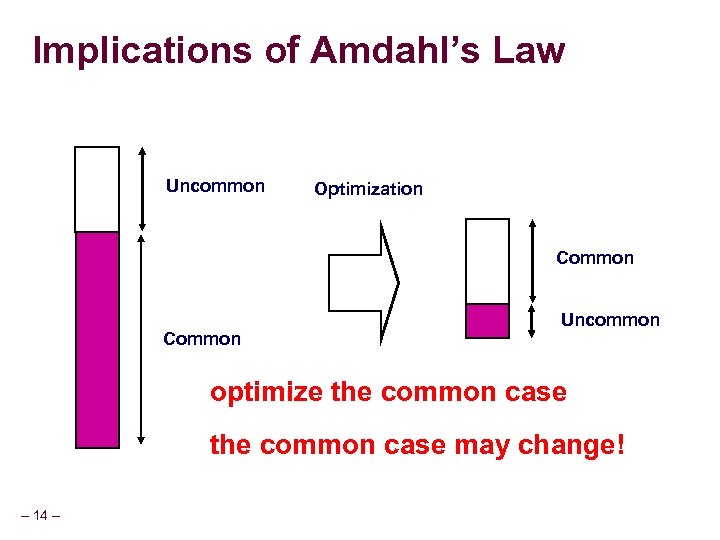
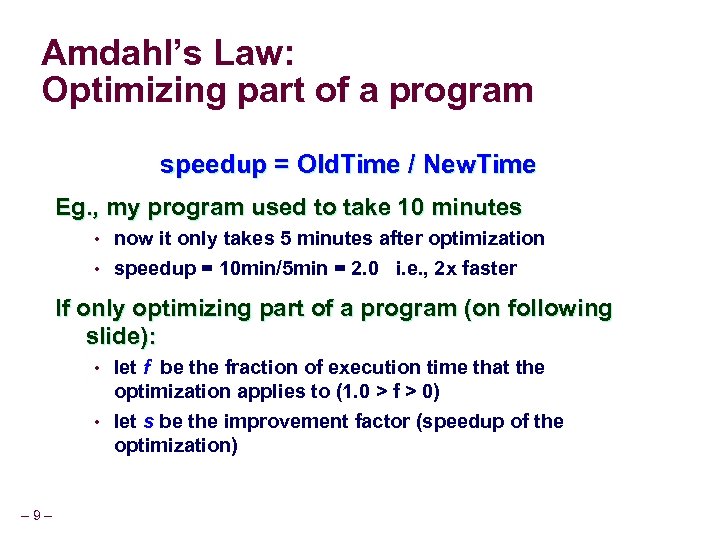 Amdahl’s Law: Optimizing part of a program speedup = Old. Time / New. Time Eg. , my program used to take 10 minutes • • now it only takes 5 minutes after optimization speedup = 10 min/5 min = 2. 0 i. e. , 2 x faster If only optimizing part of a program (on following slide): • • – 9– let f be the fraction of execution time that the optimization applies to (1. 0 > f > 0) let s be the improvement factor (speedup of the optimization)
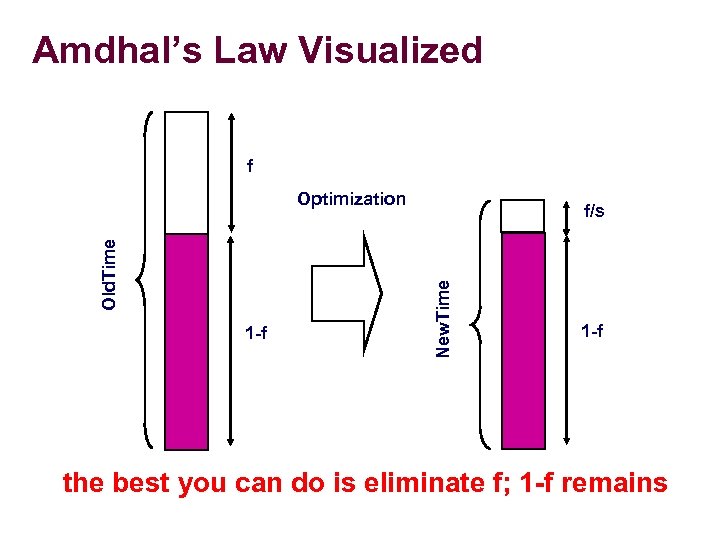 Amdhal’s Law Visualized f 1 -f f/s New. Time Old. Time Optimization 1 -f the best you can do is eliminate f; 1 -f remains
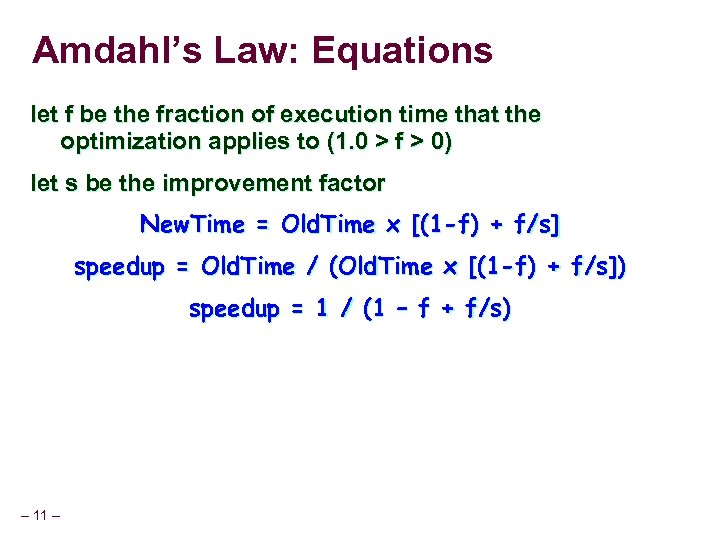 Amdahl’s Law: Equations let f be the fraction of execution time that the optimization applies to (1. 0 > f > 0) let s be the improvement factor New. Time = Old. Time x [(1 -f) + f/s] speedup = Old. Time / (Old. Time x [(1 -f) + f/s]) speedup = 1 / (1 – f + f/s) – 11 –
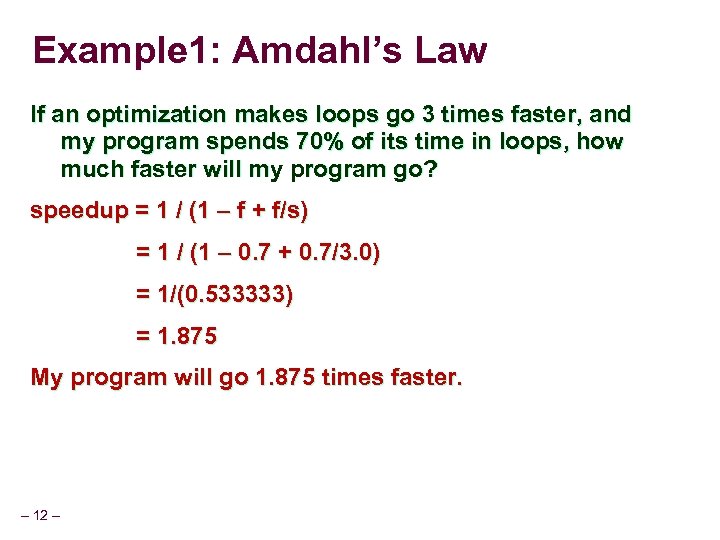 Example 1: Amdahl’s Law If an optimization makes loops go 3 times faster, and my program spends 70% of its time in loops, how much faster will my program go? speedup = 1 / (1 – f + f/s) = 1 / (1 – 0. 7 + 0. 7/3. 0) = 1/(0. 533333) = 1. 875 My program will go 1. 875 times faster. – 12 –
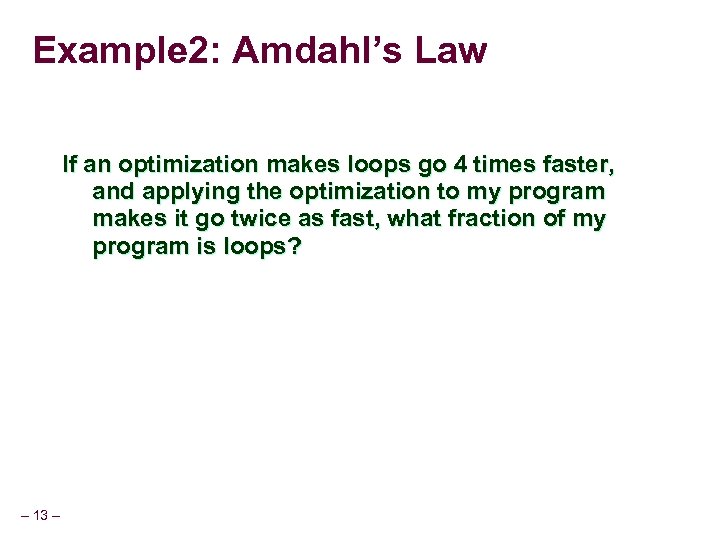 Example 2: Amdahl’s Law If an optimization makes loops go 4 times faster, and applying the optimization to my program makes it go twice as fast, what fraction of my program is loops? – 13 –
 Implications of Amdahl’s Law Uncommon Optimization Common Uncommon optimize the common case may change! – 14 –
 Tools for Measuring and Understanding Software – 15 –
 Tools for Measuring/Understanding § Software Timers § C library and OS-level timers § Hardware Timers and Performance Counters § Built into the processor chip § Instrumentation § § § Decorates your program with code that counts & measures gprof gcov GNU: “Gnu is Not Unix” --- Founded by Richard Stallman – 16 –
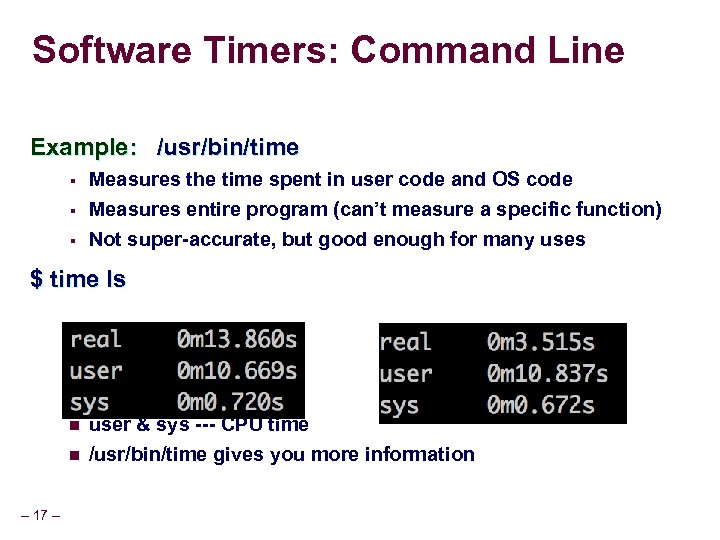 Software Timers: Command Line Example: /usr/bin/time § Measures the time spent in user code and OS code § Measures entire program (can’t measure a specific function) Not super-accurate, but good enough for many uses § $ time ls n n – 17 – user & sys --- CPU time /usr/bin/time gives you more information
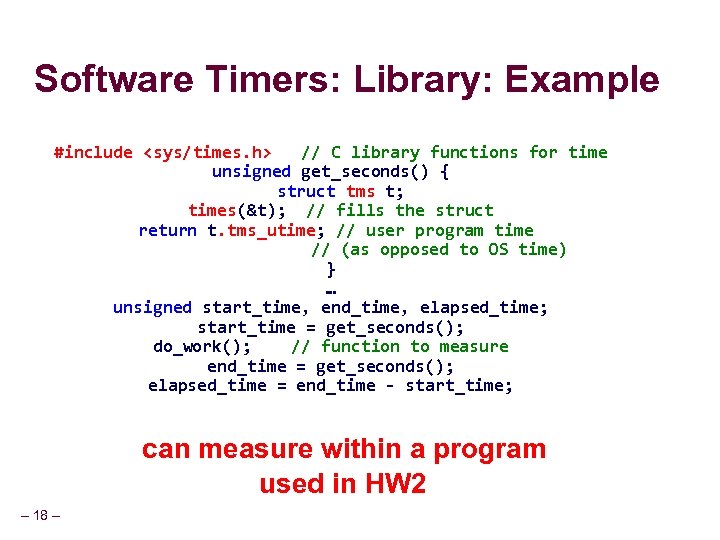 Software Timers: Library: Example #include
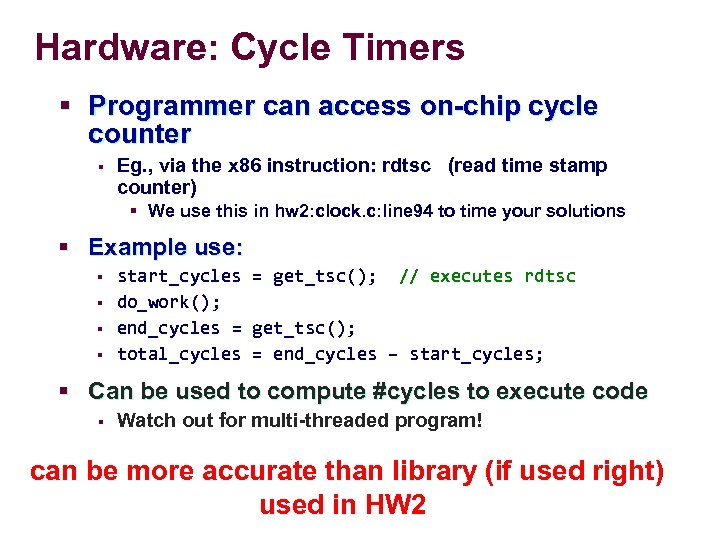 Hardware: Cycle Timers § Programmer can access on-chip cycle counter § Eg. , via the x 86 instruction: rdtsc (read time stamp counter) § We use this in hw 2: clock. c: line 94 to time your solutions § Example use: § § start_cycles = get_tsc(); // executes rdtsc do_work(); end_cycles = get_tsc(); total_cycles = end_cycles – start_cycles; § Can be used to compute #cycles to execute code § Watch out for multi-threaded program! can be more accurate than library (if used right) used in HW 2
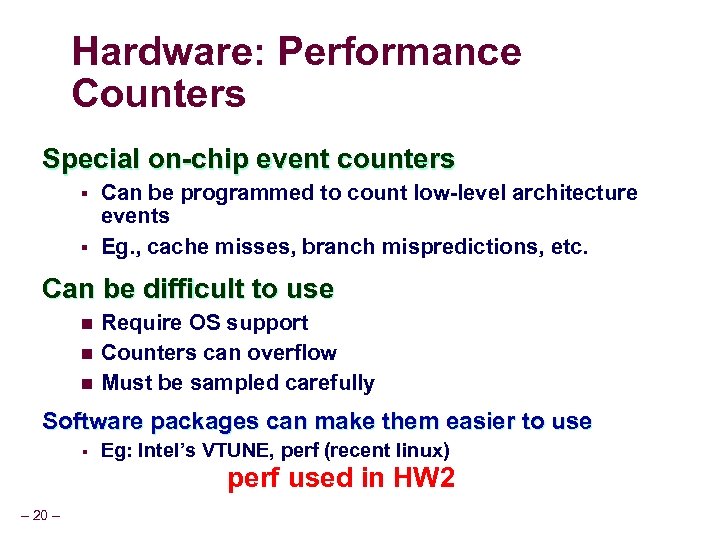 Hardware: Performance Counters Special on-chip event counters § § Can be programmed to count low-level architecture events Eg. , cache misses, branch mispredictions, etc. Can be difficult to use n n n Require OS support Counters can overflow Must be sampled carefully Software packages can make them easier to use § Eg: Intel’s VTUNE, perf (recent linux) perf used in HW 2 – 20 –
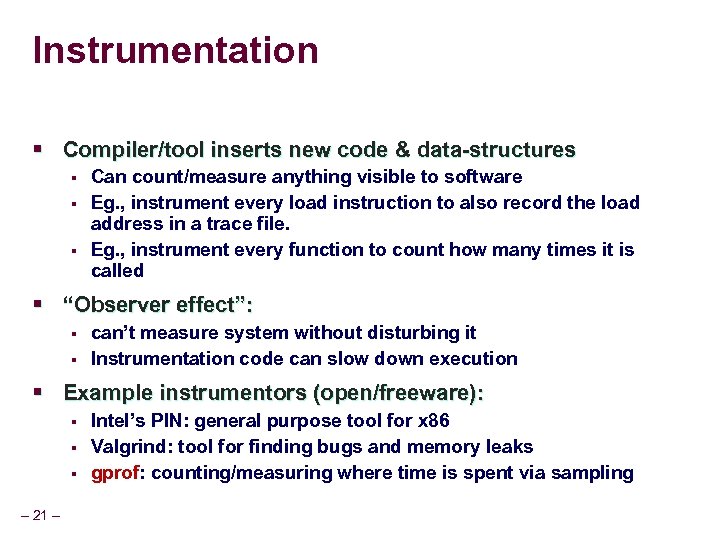 Instrumentation § Compiler/tool inserts new code & data-structures § § § Can count/measure anything visible to software Eg. , instrument every load instruction to also record the load address in a trace file. Eg. , instrument every function to count how many times it is called § “Observer effect”: § § can’t measure system without disturbing it Instrumentation code can slow down execution § Example instrumentors (open/freeware): § § § – 21 – Intel’s PIN: general purpose tool for x 86 Valgrind: tool for finding bugs and memory leaks gprof: counting/measuring where time is spent via sampling
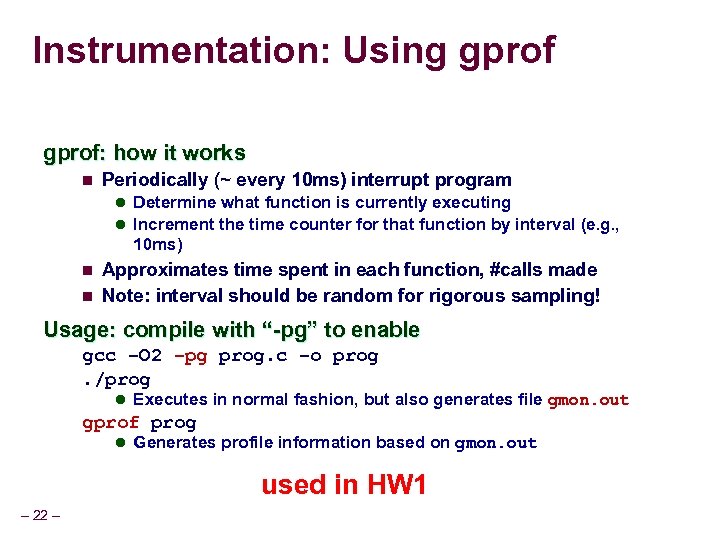 Instrumentation: Using gprof: how it works n Periodically (~ every 10 ms) interrupt program l Determine what function is currently executing l Increment the time counter for that function by interval (e. g. , 10 ms) n n Approximates time spent in each function, #calls made Note: interval should be random for rigorous sampling! Usage: compile with “-pg” to enable gcc –O 2 –pg prog. c –o prog. /prog l Executes in normal fashion, but also generates file gmon. out gprof prog l Generates profile information based on gmon. out used in HW 1 – 22 –
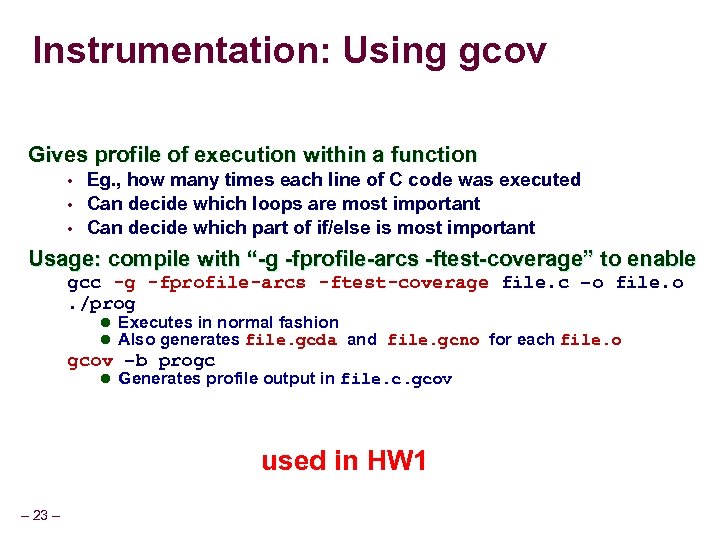 Instrumentation: Using gcov Gives profile of execution within a function • • • Eg. , how many times each line of C code was executed Can decide which loops are most important Can decide which part of if/else is most important Usage: compile with “-g -fprofile-arcs -ftest-coverage” to enable gcc -g -fprofile-arcs -ftest-coverage file. c –o file. o. /prog l Executes in normal fashion l Also generates file. gcda and file. gcno for each file. o gcov –b progc l Generates profile output in file. c. gcov used in HW 1 – 23 –


