

71dbbc44c3f3b4a878251035a5477a94.ppt
- Количество слайдов: 53
 Thoughts on ENERGY John Kramlich Professor of Mechanical Engineering Phil Malte Professor of Mechanical Engineering
 QUESTIONS to ANSWER • US Energy: Where are we now? • Where are we going? • How about the local scene?
 Transportation Petroleum Coal Natural Gas Nuclear") US Energy in Quads (1. 0 E+15 Btu) Transportation Petroleum Coal Natural Gas Nuclear Hydro Total Heating Electricity Total
US Energy in Quads (1. 0 E+15 Btu) Transportation Petroleum Coal Natural Gas Nuclear Hydro Total Heating Electricity Total
 Transportation Petroleum Coal Natural Gas Nuclear") US Energy in Quads (1. 0 E+15 Btu) Transportation Petroleum Coal Natural Gas Nuclear Hydro Total Heating Electricity Total 24 12 1 21 -Import 16 -Domestic
US Energy in Quads (1. 0 E+15 Btu) Transportation Petroleum Coal Natural Gas Nuclear Hydro Total Heating Electricity Total 24 12 1 21 -Import 16 -Domestic
 Transportation Heating Electricity Total Petroleum 24") US Energy in Quads (1. 0 E+15 Btu) Transportation Heating Electricity Total Petroleum 24 12 1 21 -Import 16 -Domestic Coal 0 0 20 24 Natural Gas Nuclear Hydro Total
US Energy in Quads (1. 0 E+15 Btu) Transportation Heating Electricity Total Petroleum 24 12 1 21 -Import 16 -Domestic Coal 0 0 20 24 Natural Gas Nuclear Hydro Total
 Transportation Heating Electricity Total Petroleum 24") US Energy in Quads (1. 0 E+15 Btu) Transportation Heating Electricity Total Petroleum 24 12 1 21 -Import 16 -Domestic Coal 0 0 20 24 Natural Gas 1 18 3 22 Nuclear Hydro Total
US Energy in Quads (1. 0 E+15 Btu) Transportation Heating Electricity Total Petroleum 24 12 1 21 -Import 16 -Domestic Coal 0 0 20 24 Natural Gas 1 18 3 22 Nuclear Hydro Total
 Transportation Heating Electricity Total Petroleum 24") US Energy in Quads (1. 0 E+15 Btu) Transportation Heating Electricity Total Petroleum 24 12 1 21 -Import 16 -Domestic Coal 0 0 20 24 Natural Gas 1 18 3 22 Nuclear 0 0 7 7 Hydro 0 0 3 3 Total 25 30 34
US Energy in Quads (1. 0 E+15 Btu) Transportation Heating Electricity Total Petroleum 24 12 1 21 -Import 16 -Domestic Coal 0 0 20 24 Natural Gas 1 18 3 22 Nuclear 0 0 7 7 Hydro 0 0 3 3 Total 25 30 34
 Quads
Quads
 Transportation Heating Electricity Total Petroleum 24") US Energy in Quads (1. 0 E+15 Btu) Transportation Heating Electricity Total Petroleum 24 12 1 21 -Import 16 -Domestic Coal 0 0 20 24 Natural Gas 1 18 3 22 Nuclear 0 0 7 7 Hydro 0 0 3 3 Total 25 30 34
US Energy in Quads (1. 0 E+15 Btu) Transportation Heating Electricity Total Petroleum 24 12 1 21 -Import 16 -Domestic Coal 0 0 20 24 Natural Gas 1 18 3 22 Nuclear 0 0 7 7 Hydro 0 0 3 3 Total 25 30 34
 GASOLINE ENGINE EFFICIENCY FUEL 100% Engine 35% Start/stop, running cold, running off “sweet spot” (hard acceleration), oversized engines, throttle losses 20% Well-to-wheels 15 -17% Why? We ask a lot from a car
 Hybrid Gasoline-Electric
 •") Hybrid Advantages • Ideal: Engine runs near one RPM and torque (engines oversized) • Regenerative braking • Hard acceleration covered by battery • Avoids big losses of city driving • Since wind friction goes with speed squared, highway mileage often lower than city (35 mph best!)
Hybrid Advantages • Ideal: Engine runs near one RPM and torque (engines oversized) • Regenerative braking • Hard acceleration covered by battery • Avoids big losses of city driving • Since wind friction goes with speed squared, highway mileage often lower than city (35 mph best!)
 Fuel Cell Propulsion
 The Fuel Cell: An Externally-Fueled Battery
 Fuel Cell Issues • Platinum for cell • Expensive machining • Expensive membrane • Auto: 35$/k. W • Fuel cell: 300$/k. W • Must find ways to get cost down or may not compete
 Hydrogen Issues
 Hydrogen Issues • Make H 2 in fuel plant? Natural gas to H 2 leads to a significant loss in fuel value (recover only ~60% of original energy). • Store H 2 on vehicle? Safety? Space? • Make H 2 from gasoline? Carry a chemical plant on your car?
 “Well-to-Wheel” Efficiencies Fuel Prod Eng W-W CO 2 g/km Ems Gas-now 85% 18% 15% 220 Low Gas-adv 85% 23% 20 % 170 Ultra/S Hybrid 85% 36% 31% 110 Ultra/S FC-HC 60% 50% 30% 110 Super FC-Me. OH 50% 36% 18% 110 Super
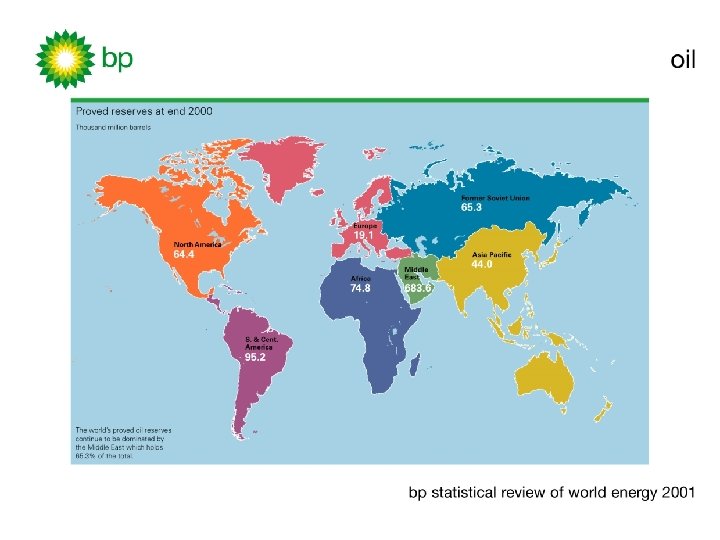
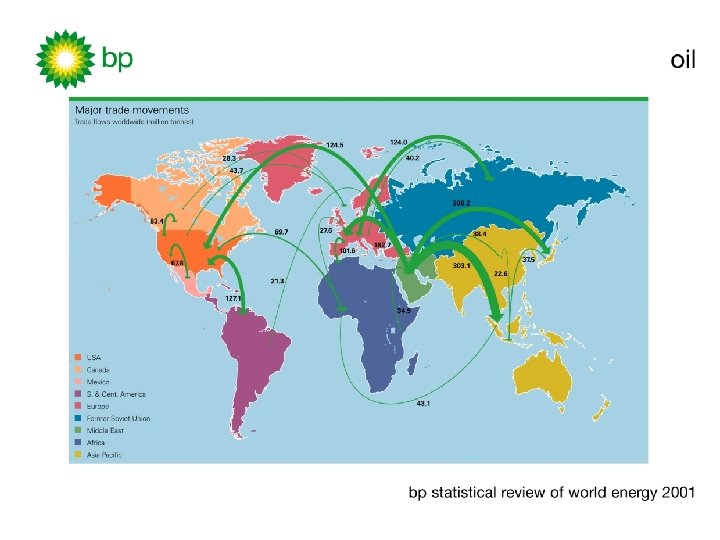
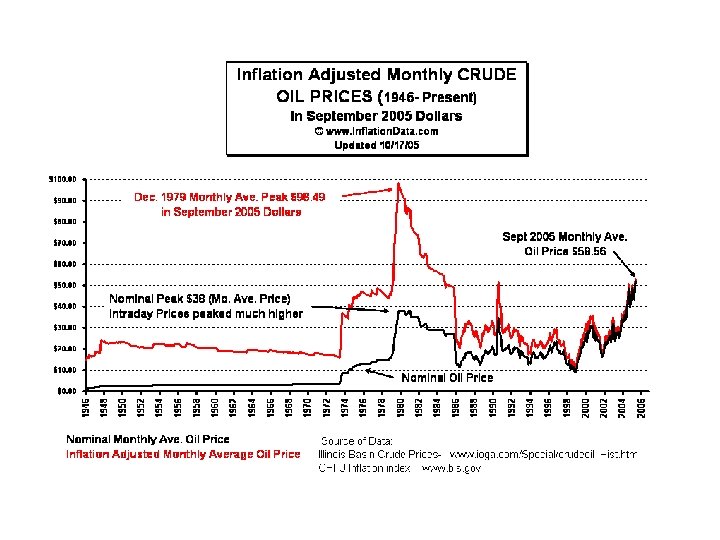
 Running Out of Oil? • Record of Consumption and Production in USA • Resource • Cheap versus Expensive Oil
 Oil in the USA
 Crude Oil ~1000 World (25% recvy) Shale Oil") Resource (economically recoverable billions of barrels) Crude Oil ~1000 World (25% recvy) Shale Oil ~17000 World: 25 gal/ton Shale Oil ~3000 US+Canada: 25 Tar Sands 100 -1000 US, Canada, Venzl ANWR 6 -16 3 -8% of US use Use Rate 7 bbo/yr USA Use Rate 25 bbo/yr WORLD
Resource (economically recoverable billions of barrels) Crude Oil ~1000 World (25% recvy) Shale Oil ~17000 World: 25 gal/ton Shale Oil ~3000 US+Canada: 25 Tar Sands 100 -1000 US, Canada, Venzl ANWR 6 -16 3 -8% of US use Use Rate 7 bbo/yr USA Use Rate 25 bbo/yr WORLD
 Message • The supply of Cheap-to-Recover crude oil is limited – there is about a 40 years supply at the present consumption rate. • The world is becoming increasingly dependent on Middle Eastern crude oil. • There is a lot of Expensive-to-Recover oil – monetarily and environmentally expensive. • Should transportation move away from oil?
 Transportation Heating Electricity Total Petroleum 24") US Energy in Quads (1. 0 E+15 Btu) Transportation Heating Electricity Total Petroleum 24 12 1 21 -Import 16 -Domestic Coal 0 0 20 24 Natural Gas 1 18 3 22 Nuclear 0 0 7 7 Hydro 0 0 3 3 Total 25 30 34
US Energy in Quads (1. 0 E+15 Btu) Transportation Heating Electricity Total Petroleum 24 12 1 21 -Import 16 -Domestic Coal 0 0 20 24 Natural Gas 1 18 3 22 Nuclear 0 0 7 7 Hydro 0 0 3 3 Total 25 30 34
 Conventional Power Plant
 Simple Gas Turbine Fuel Generator Air Pump Hot Exhaust Burner Turbine
 Modern Combined Cycle Power Plant
 CO 2 Cleanup?
 Transportation Heating Electricity Total Petroleum 24") US Energy in Quads (1. 0 E+15 Btu) Transportation Heating Electricity Total Petroleum 24 12 1 21 -Import 16 -Domestic Coal 0 0 20 24 Natural Gas 1 18 3 22 Nuclear 0 0 7 7 Hydro 0 0 3 3 Total 25 30 34
US Energy in Quads (1. 0 E+15 Btu) Transportation Heating Electricity Total Petroleum 24 12 1 21 -Import 16 -Domestic Coal 0 0 20 24 Natural Gas 1 18 3 22 Nuclear 0 0 7 7 Hydro 0 0 3 3 Total 25 30 34
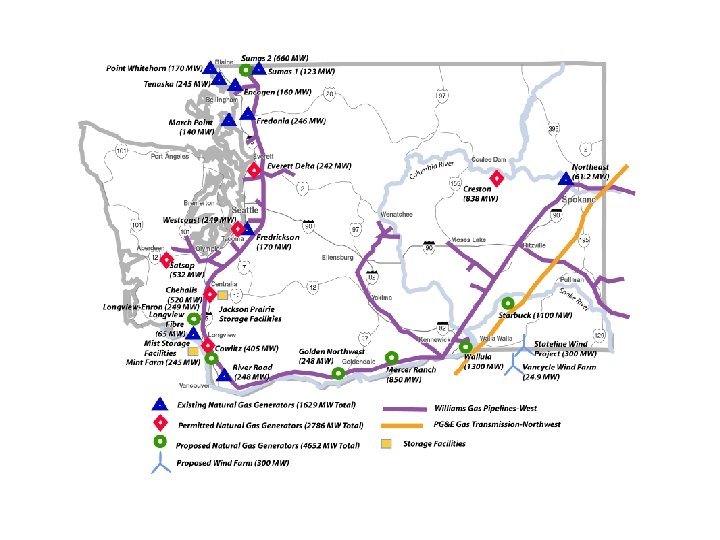
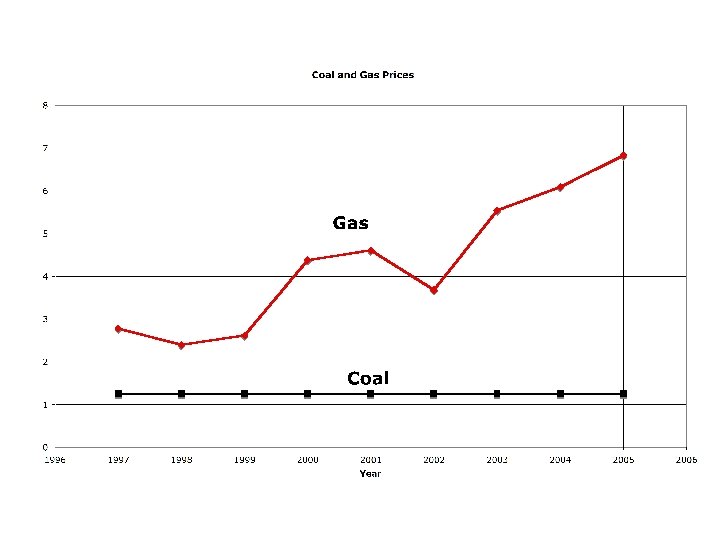
 Natural Gas in USA
 Natural Gas for Electricity 4% average yearly growth rate
 May be priced out of some markets
 Transportation Heating Electricity Total Petroleum 24") US Energy in Quads (1. 0 E+15 Btu) Transportation Heating Electricity Total Petroleum 24 12 1 21 -Import 16 -Domestic Coal 0 0 20 24 Natural Gas 1 18 3 22 Nuclear 0 0 7 7 Hydro 0 0 3 3 Total 25 30 34
US Energy in Quads (1. 0 E+15 Btu) Transportation Heating Electricity Total Petroleum 24 12 1 21 -Import 16 -Domestic Coal 0 0 20 24 Natural Gas 1 18 3 22 Nuclear 0 0 7 7 Hydro 0 0 3 3 Total 25 30 34
 Hydropower
 Turbine/ Generator Set
![Some Engineering Energy = g[mass of water thru turbine] X [height of dam] •](https://present5.com/presentation/71dbbc44c3f3b4a878251035a5477a94/image-40.jpg "Some Engineering Energy = g[mass of water thru turbine] X [height of dam] •") Some Engineering Energy = g[mass of water thru turbine] X [height of dam] • Low reservoirs reduce effective height • Reduced river flows cut mass available • 300 W projection-TV operated for one hour = one ton of water through Grand Coulee Dam.
Some Engineering Energy = g[mass of water thru turbine] X [height of dam] • Low reservoirs reduce effective height • Reduced river flows cut mass available • 300 W projection-TV operated for one hour = one ton of water through Grand Coulee Dam.
") Washington Electric Power Capacities and Actual Use (1998)
Washington Electric Power Capacities and Actual Use (1998)
 The Big Five
 What Next?
 A Tale of Two Houses • Malte • 3500 ft 2 • Gas furnace, hot water, range-top • Balance electric • PSE • • • Kramlich 2000 ft 2 All electric Heat pump furnace SCL
 Annual Energy Consumption
 Heat Pump • Heat is present in all air • But heat flows only from hot to cold • So heat in outside air won’t directly warm your house • Use electricity to “pump” heat from outside into your house • Better than just using electricity alone to get heat • Multiplies value of electricity
 Message • Larger house requires more energy. • Electricity gives more heat (per unit energy input) than gas if a heat pump is used. • But: Electricity costs more, which is a reflection of its greater utility.
 12 kw System = $90,") Solar PV? • • Panel+BOS Costs = $750/kw-peak (grid-tied) 12 kw System = $90, 000 Capacity Factor = 12% (20% in AZ) Power generated = 12, 600 k. W-hr/year (Kramlich: 18, 000 -24, 000, Malte: 11, 000 -15, 000) • Simple Cost over 30 year life = 24¢/k. W-hr • Arizona: 14¢/k. W-hr
Solar PV? • • Panel+BOS Costs = $750/kw-peak (grid-tied) 12 kw System = $90, 000 Capacity Factor = 12% (20% in AZ) Power generated = 12, 600 k. W-hr/year (Kramlich: 18, 000 -24, 000, Malte: 11, 000 -15, 000) • Simple Cost over 30 year life = 24¢/k. W-hr • Arizona: 14¢/k. W-hr
 Vansycle Project: Wallula
 Stateline Project, Wallula • 450 Turbines • 300 MW max • 70, 000 homes
 Seattle City Light and Stateline • 10/18/01 in PI: – 50 MW now – 150 MW future – 175 MW maybe – $48. 50/MWH • Stateline first phase: 265 MW peak from 400 turbines
 WRAP UP FUEL USA WORLD TREND Oil 39% 34% Nat Gas 23% 20% Coal 22% 20% ? Nuclear 8% 6% ? Hydro 4% 6% ? Biomass 4% 14% ? Solar&Wind Electricity
 Renewable/Global Warming • If CO 2 avoidance key: Nuclear, biomass, CO 2 sequestration, solar, wind, tidal, hydro • If renewable is also key, remove nuclear, unless fusion is solved • Current: Solar=0. 069 Q, Wind=0. 12 Q. Biomass=2. 9 out of 100