

b984f29921d519d7a9f4a0ab03503b69.ppt
- Количество слайдов: 95


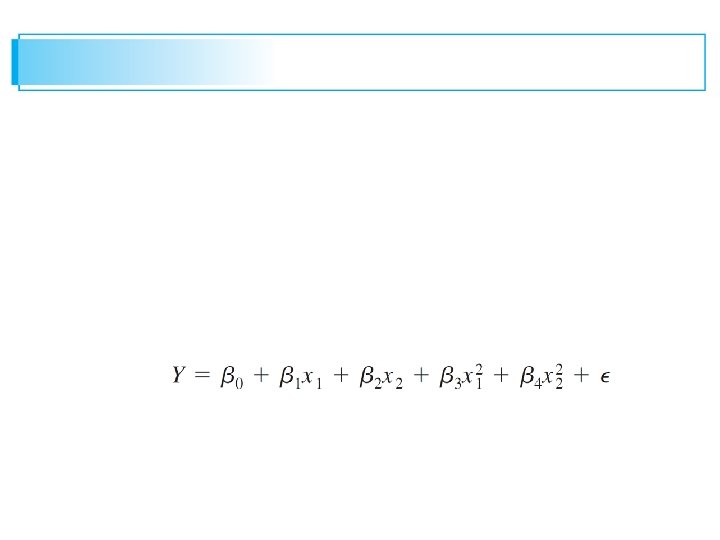
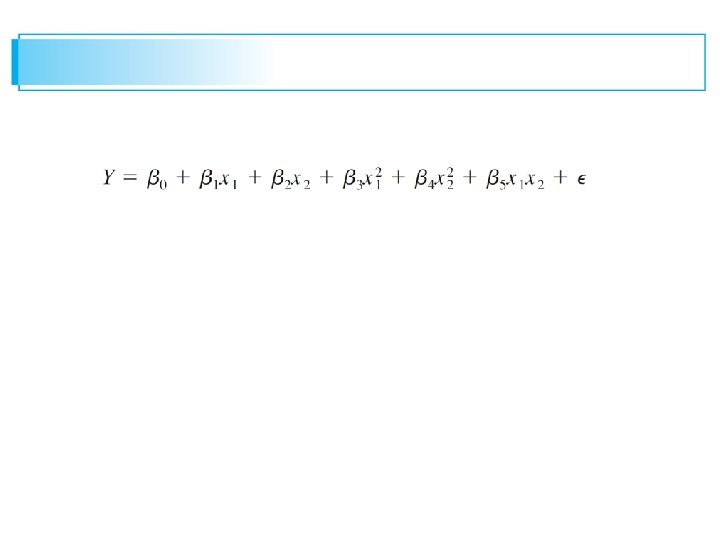
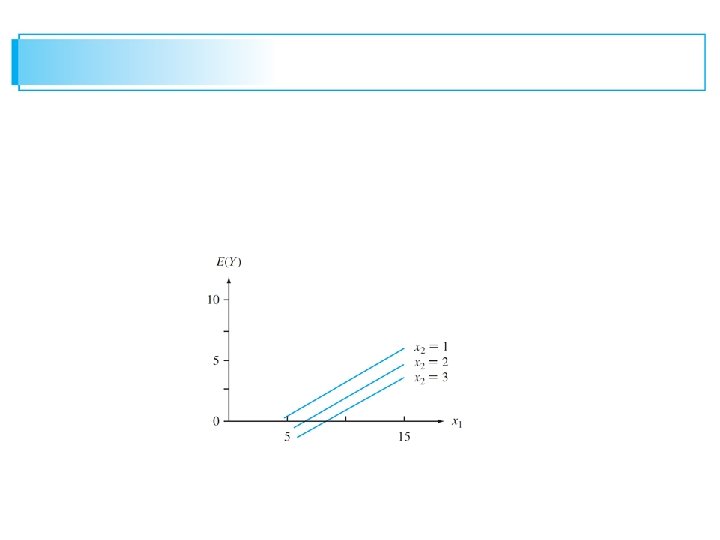
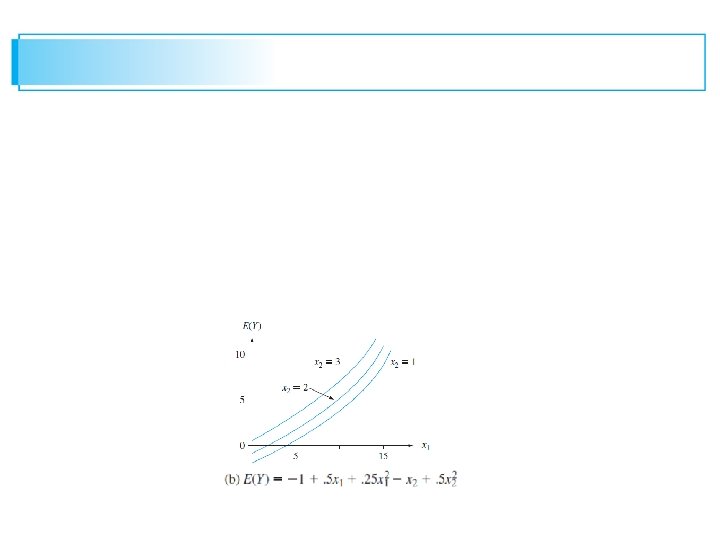
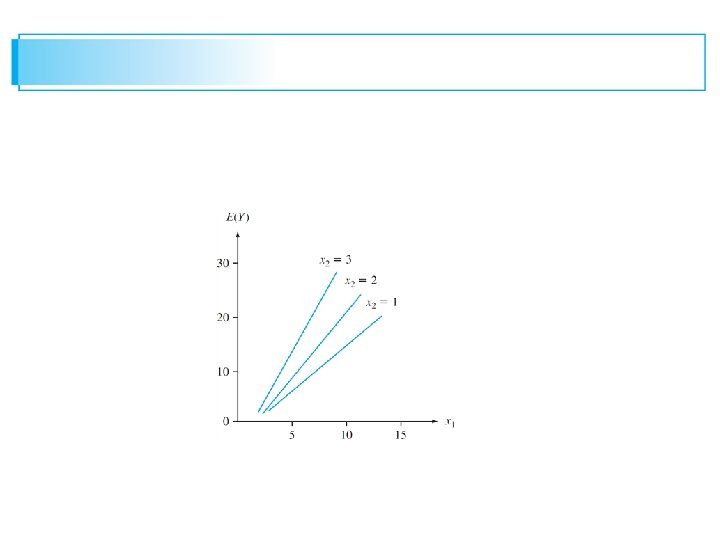

 This implies that the contours of the regression function are both curved and not parallel to one another, as illustrated in Figure 13. 13(d).


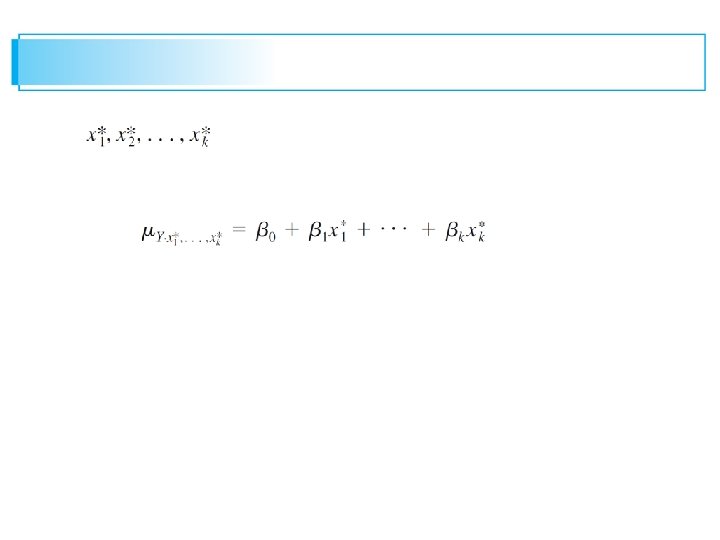
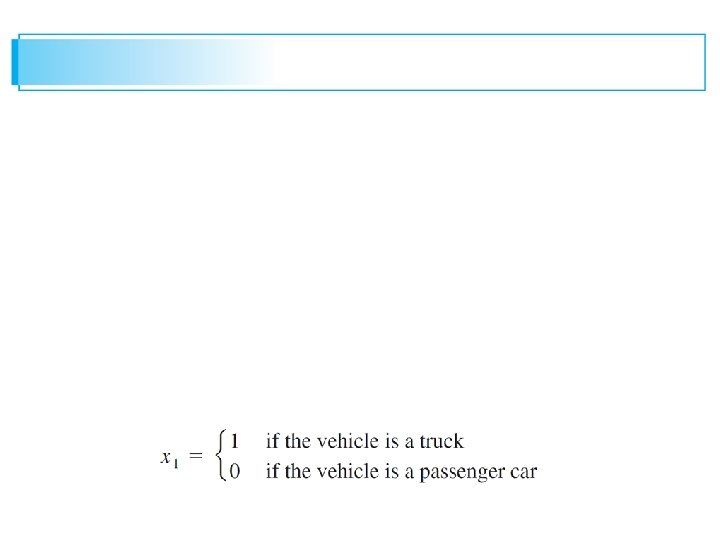
 predictor variables") Thus far we have explicitly considered the inclusion of only quantitative (numerical) predictor variables in a multiple regression model. Using simple numerical coding, qualitative (categorical) variables, such as bearing material (aluminum or copper/lead) or type of wood (pine, oak, or walnut), can also be incorporated into a model.
Thus far we have explicitly considered the inclusion of only quantitative (numerical) predictor variables in a multiple regression model. Using simple numerical coding, qualitative (categorical) variables, such as bearing material (aluminum or copper/lead) or type of wood (pine, oak, or walnut), can also be incorporated into a model.


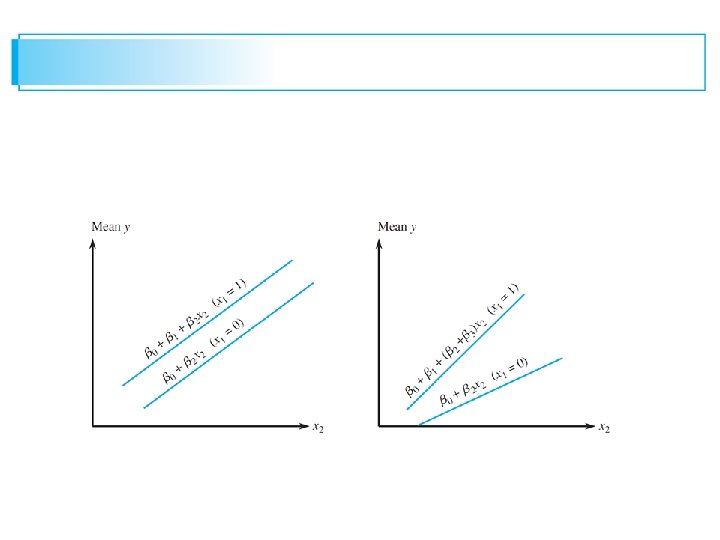
 For each model, the graph of the mean time versus distance is a straight line for either type of vehicle, as illustrated in Figure 13. 14.
 model, but in general they") The two lines are parallel for the first (no-interaction) model, but in general they will have different slopes when the second model is correct. For this latter model, the change in mean travel time associated with a 1 -mile increase in distance depends on which type of vehicle is involved—the two variables “vehicle type” and “travel time” interact. Indeed, data collected by the authors of the cited article suggested the presence of interaction.
The two lines are parallel for the first (no-interaction) model, but in general they will have different slopes when the second model is correct. For this latter model, the change in mean travel time associated with a 1 -mile increase in distance depends on which type of vehicle is involved—the two variables “vehicle type” and “travel time” interact. Indeed, data collected by the authors of the cited article suggested the presence of interaction.


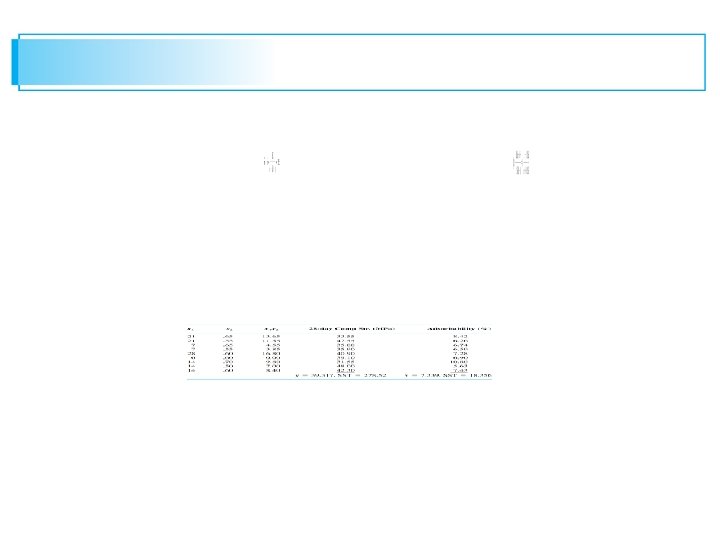
 The following data was generated to be consistent with the information given in the article:
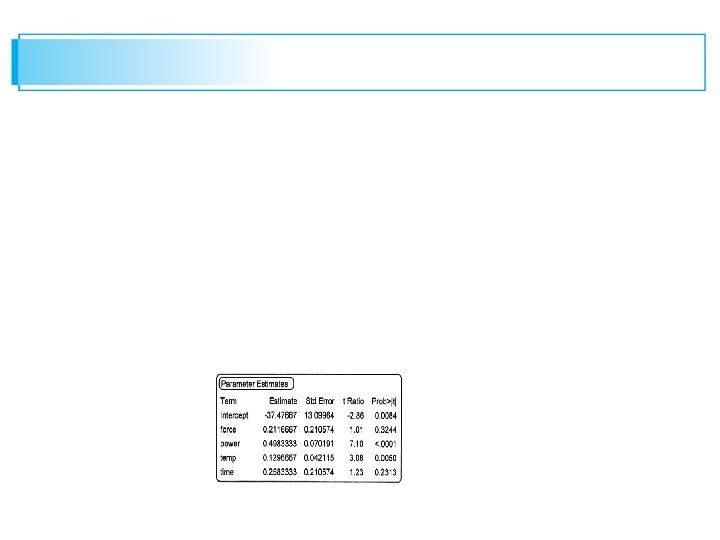
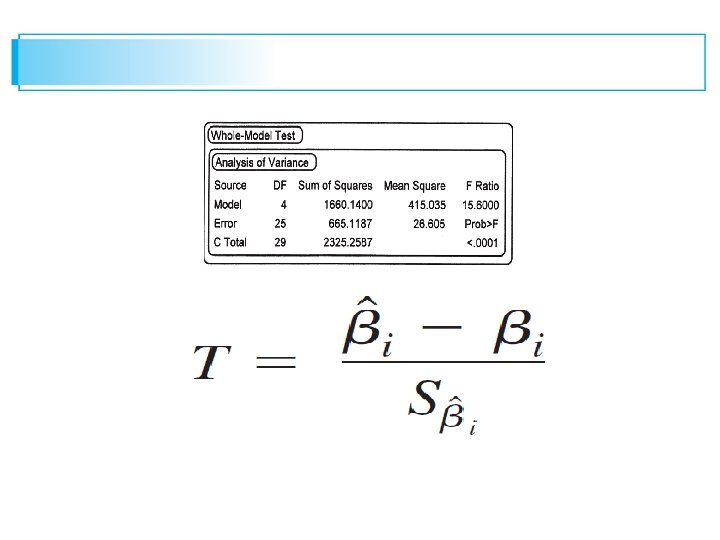
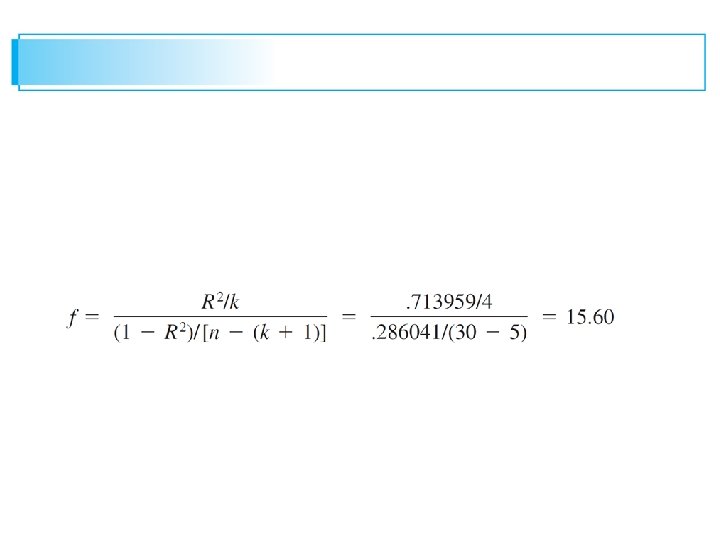
 A statistical computer package gave the following least squares estimates: – 37. 48 . 2117 . 4983 . 1297 . 2583 Thus we estimate that. 1297 gm is the average change in strength associated with a 1 -degree increase in temperature when the other three predictors are held fixed; the other estimated coefficients are interpreted in a similar manner.


 However, if = 16. 00, then we estimate that a $16 increase in sale price is associated with each extra square foot of gross area after adjusting for the effects of the other four predictors.


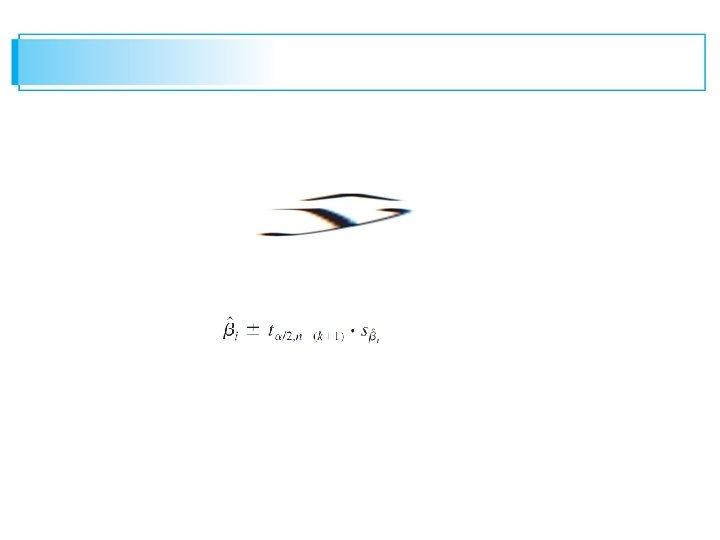
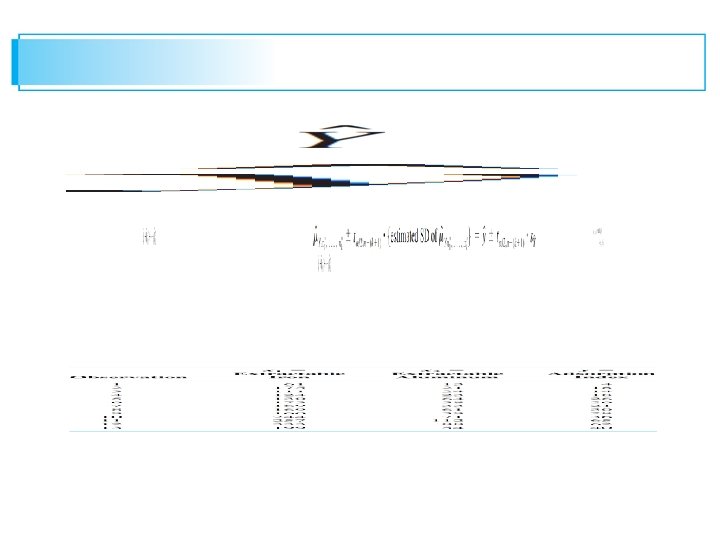
 Simultaneous intervals for which the simultaneous confidence or prediction level is controlled can be obtained by applying the Bonferroni technique.

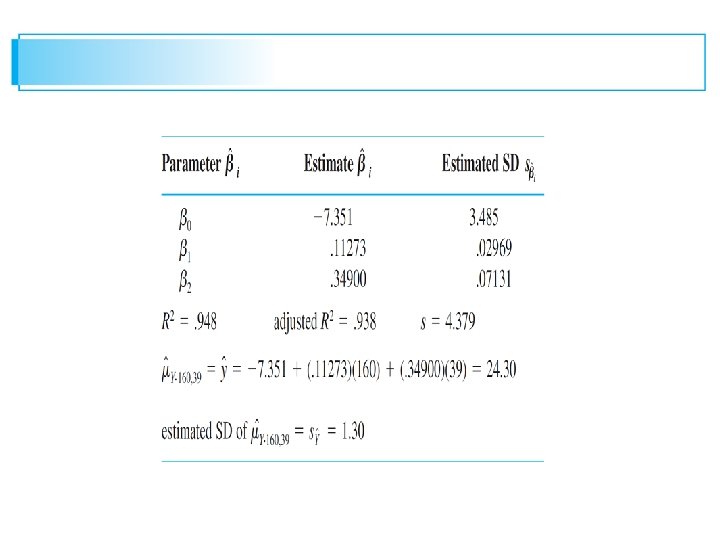


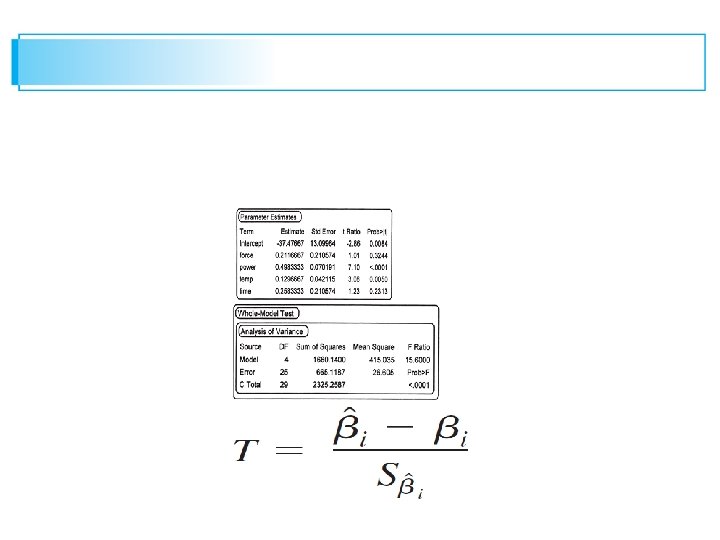


 Figure 13. 17 shows the other suggested plots for the adsorption data.
 Given that there are only 13 observations in the data set, there is not much evidence of a pattern in any of the first three plots other than randomness. The point at the bottom of each of these three plots corresponds to the observation with the large residual. We will say more about such observations subsequently. For the moment, there is no compelling reason for remedial action.