

8f7e78fe3b0c21725a6d8ddbcdf976e8.ppt
- Количество слайдов: 40
 The Wisconsin Poverty Report: AN UPDATE and a Look at Poverty Need and Policy in Wisconsin and Nationwide Tim Smeeding Director and Distinguished Professor of Public Affairs A Report from the Institute for Research on Poverty December 2009
 First Wisconsin Poverty Report l l Released in April 2009 Looked at poverty data and change in SNAP/Food. Share enrollments to identify areas of greatest need Copies available at http: //www. irp. wisc. edu IRP Team (including Joanna Marks, Julia Isaacs) now working on improving the poverty measure and preparing a full report for June 2010 as a national model
 Outline of Presentation l l Poverty Situation in WI—through a looking glass darkly Growing Need (jobs, men, fathers, poverty) Alleviation of need – food stamps/Food. Share and ARRA: 2009 and 2010 as crucial years Summing up for WI: where are we going next?
 I. State poverty rates: How does Wisconsin compare in 2008 ? l l l US: 13. 2% Illinois: 12. 2% Iowa: 11. 5% Michigan: 14. 4% Minnesota: 9. 6% Wisconsin: 10. 4% Source: 2008 American Community Survey.
 What has Changed from 2007 to 2008? l l US Poverty Rate in 2008: 13. 2% (US Poverty Rate in 2007: 13. 0%) l WI Poverty Rate in 2008: 10. 4% (WI Poverty Rate in 2007: 10. 8%) l No statistically significant changes. Why? l Sources: 2007 and 2008 American Community Surveys.
 Timing of the 2008 ACS l l Each ACS family interviewed once during calendar year (Jan-Dec 2008) about income in prior 12 months. Thus, the ‘annual income’ data covers 23 sets of months, January 2007 -Nov 2008 (next slide). Recession began December 2007, meaning much of family income data in 2008 ACS reflects pre-recession income in 2007 and early 2008. Impact in Wisconsin not felt until early 2009.
 American Community Survey and the Recession 2007 Ja n Fe b M ar Ap r M ay Ju n Ju l 2008 Au g Se p O ct N ov D ec Ja n Fe b M ar Ap r M ay Ju n Ju l Au g Se p O ct N ov D ec ↑ December 2007: Official start of the national recession ← Income interview lag in → Example: A person surveyed December 2008 will report income for December 2007 -November 2008
 But when will the recession induced higher poverty figures show up? l l 2009 statistics to be released Aug/Sept 2010 What can we expect? BIG increases, greater than 1 and maybe 2 percentage points next year in income poverty
 What’s New Since the First Report: A Quick 2008 ACS-WI Update l l New data from 2008 American Community Survey (ACS) released this fall : poverty rates by county or multi-county area State poverty rate in 2008: 10. 4% Poverty maps: Red (highest, >12%); Dark Grey (10 -12%); Light Grey (8 -10%); White (lowest, <8%) Using Federal poverty definition today, but updating with better (NAS) approach over the next year
 2008 Poverty Rates: 10 Largest Counties County 2008 Poverty Rate Milwaukee 17. 8% Dane (Madison) 12. 3% Waukesha 3. 7% Brown (Green Bay) 8. 2% Racine 9. 5% Kenosha 9. 0% Rock (Janesville) 9. 5% Marathon (Wausau) 4. 3% Sheboygan 7. 9% La Crosse 13. 1%
 Poverty Rates: Multi-County Areas Multi-County Area 2008 Poverty Rate Ozaukee/Washington 4. 1% Jefferson/Walworth 12. 1% Chippewa/Eau Claire 8. 1% Calumet/Outagamie/Winneb. (Appleton) 7. 2% Columbia/Dodge/Sauk (Baraboo) 7. 5% 5 -county area (Menomonie) 10. 1% 5 -county area (Dodgeville) 10. 5% 6 -county area (Manitowoc) 10. 1% 7 -county area (Fond du Lac) 8. 0% 8 -county area (Sparta) 11. 1% 9 -county area (Stevens Point, Crandon) 10. 8% 10 -county area (Superior) 12. 0%
 Poverty Rate for 2008 by Wisconsin PUMAs/PUMA Groups For All Individuals
 Areas within Milwaukee County Area 2008 Poverty Rate Outer Northeast and East 17. 9% Inner North 25. 1% Central 40. 1% South 18. 6% Brown Deer, Glendale, Shorewood, Wauwatosa, Whitefish Bay, Other 5. 7% Southern Suburbs* 8. 4% Milwaukee (Overall) 17. 8% *Cudahy, Franklin, Greendale, Greenfield, Oak Creek, South Milwaukee, West Allis, Other
 Poverty Rates in Milwaukee Super-PUMAs, 2008
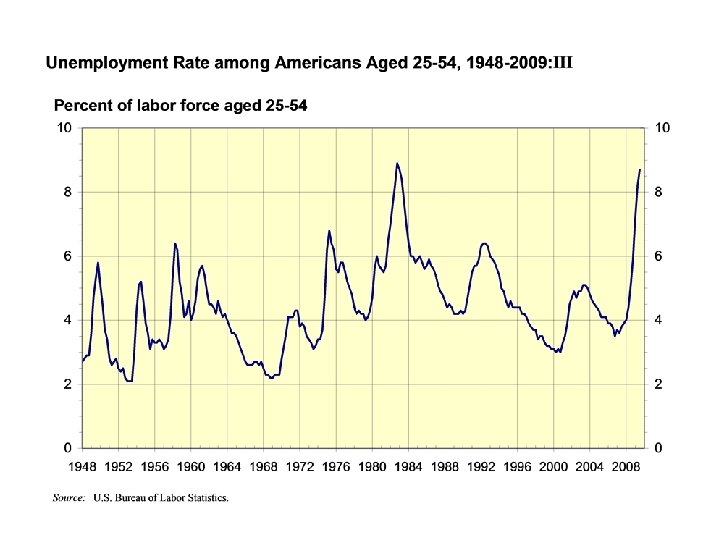
 II. Assessing and Meeting Needs l l The depths and impact of the recession (unemployment and lower employment) Effect on younger undereducated men Still growing role of food stamps in the US and Wisconsin in alleviating hunger The rest of the ARRA nationally – what helps whom and when?
 Sources Gary Burtless: “Recession and Redistribution: The Economy, Public Policy, and the Poor “ IRP Seminar November, 19, 2009, at http: //irp. wisc. edu/newsevents/seminars/Presentations/ 2009 -2010/Burtless-IRP-11 -19 -2009. pdfl Tim Smeeding: “Young Disadvantaged Men: Fathers, Families, Poverty and Policy” September 2009, IRP “Fathers” Conference Overview, Power. Point available from author l
 Unemployment Rate in Wisconsin by Month, 2004 -2009 December 2007 Source: Bureau of Labor Statistics. Note: October 2009 data are preliminary.
 , United States 27. 5 %
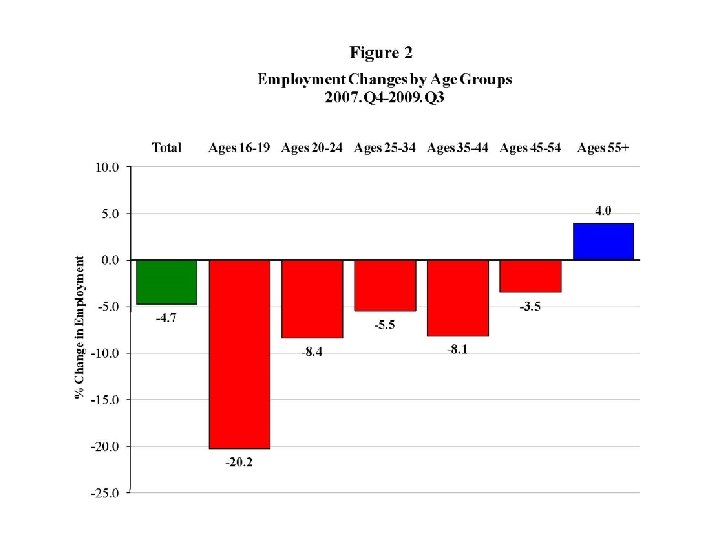
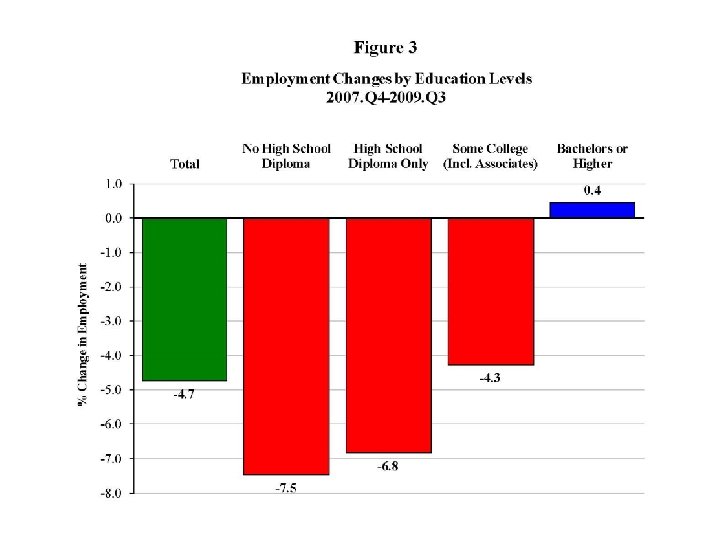
 Who are these young workers who are getting clobbered? Mostly young undereducated men and most of them out of wedlock fathers l Plagued by three reinforcing forces: bad economy and joblessness multiple out of wedlock childbearing high incarceration risk l Result lots of poor kids with absent fathers who are earning enough to support them (or to pay child support) l
 Percent of Young Men Who are Fathers By Age 22 All Men") Fatherhood (2002) Percent of Young Men Who are Fathers By Age 22 All Men Less than HS High degree only BA+ Fathers earning less than $20, 000 21% 38% 32% 3% By Age 30 56% 73% 64% 38% 62%
Fatherhood (2002) Percent of Young Men Who are Fathers By Age 22 All Men Less than HS High degree only BA+ Fathers earning less than $20, 000 21% 38% 32% 3% By Age 30 56% 73% 64% 38% 62%
 Birth Patterns of Women And Men by Level of Education, Women in 1960– 1964, Cohort Observed in 2004 Sources: Ellwood, Wilde and Batchelder, 2009; Berger and Langton.
 Total Kids with Poor Life Chances? Over a ‘lifetime’ (women and men up to age 40 in 2004), total number of kids (total fertility) in each mother’s education grouping (similar education or less for fathers): Dropouts HS only Some college BA+ 16 percent 32 percent (includes GED) 28 percent 24 percent 48 percent of all kids in the USA today come from parents with low educational backgrounds; parents who are more likely to be unemployed, lowly paid and poor
 Bottom lines in needs assessment for US and WI l l l Long term unemployment at all-time high in US; recovering a bit in WI but still high ‘Biggest losers’, younger undereducated fathers (and also to a lesser extent mothers) and children of same. Personal income fell 8 percent in aggregate , (12 -2007 to 9 -2009) but in terms of distribution , fell most for the younger workers at the bottom of the income ladder
 What has been done about poverty nationwide and in WI? l l SNAP/Food. Share to the rescue again Nationwide now serving 1 in 8 people in USA; nearly 1 in 4 children in USA And only slightly fewer in Wisconsin (1 in 9 people here — 650, 000 of 5. 509 million; 40 percent of kids in Milwaukee alone) With both sets of participants still rising ARRA – what is being spent where, how and on whom?
 Changes in US SNAP receipt from 2007 to June 2009 (map from New York Times, 11/29/09)
 Number of Wisconsin Food Share Recipients by Month, 2000 -2009 December 2007 Source: Wisconsin Department of Health Services. Data are through October 2009.
 National Economic crisis: Impact and remedies l Most anti-recession government actions are familiar: – – – l Temporary tax reductions Extensions of unemployment benefits Increased government investment in buildings, roads, technology But this time there are unusual federal actions: – – – Generous health insurance subsidies to individuals Massive grants to state governments for education and Medicaid/SCHIP Emphasis on protecting education & training
 US ARRA Special programs for the unemployed l Unemployment benefit extensions of up to 73 weeks -- giving a total of 99 weeks protection – l l Length of extension tied to state unemployment rate , not local unemployment rate Federal gov’t. pays all extra cost $25 / week hike in benefits (8%) $2, 400 of yearly benefits are tax free 65% federal subsidy for continued health insurance – An all-time first
 Special ARRA programs for the poor l l 14 percent increase in monthly food stamp allotments in April 2009 Aid to the states for social assistance-TANF for children (but need to buy down) Doubling of budget for training the unemployed and hard-to-employ Large increases in EITC and refundable Child Tax Credit
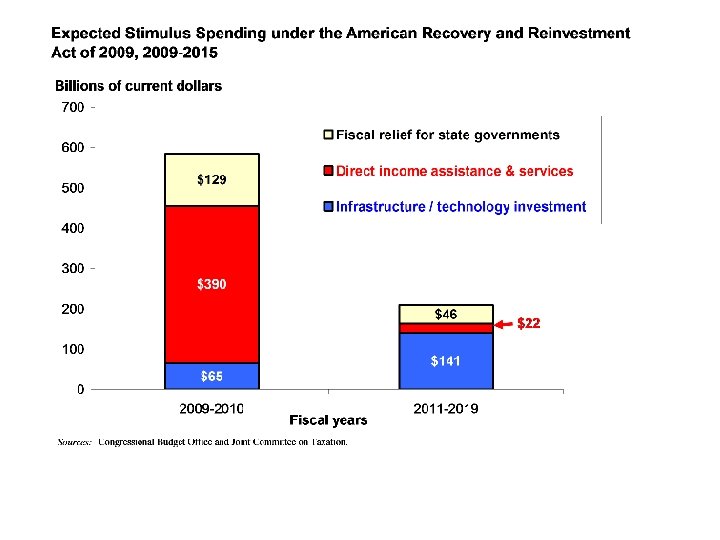
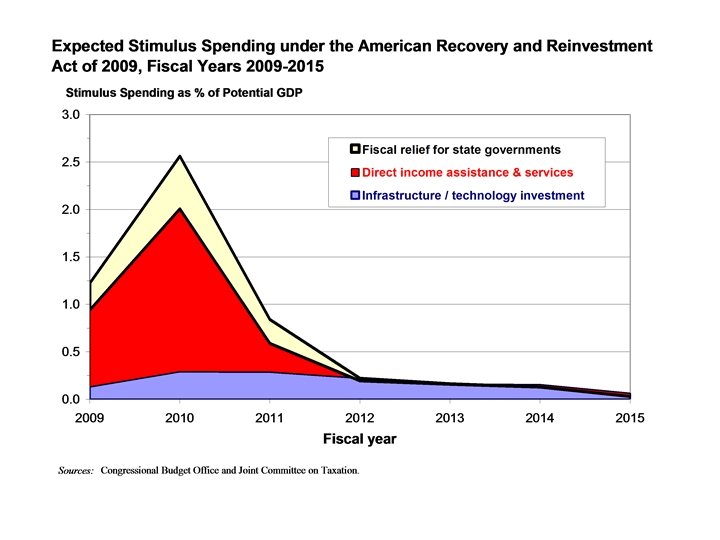
 ARRA Aid comes in three types 1. Fiscal relief for states 2. Direct income assistance and services 3. Infrastructure (those ‘shovel ready’ projects everyone has been talking about) l Timing and patterns of each are very interesting and non-intuitive
 Economic Crisis & Social Protection Impact and remedies in perspective l What is old: – l What is new: – – – l Automatic stabilization of lower taxes and higher benefits and standard gov’t. reactions – such as tax cuts; UI increases and infrastructure spending projects Health insurance for the unemployed Massive federal aid for state governments Unusual focus on protecting education & training What Congress avoided: – Huge investment in public works (They’re too slow)
 III. Pulling the Picture Together l l l Even with small poverty changes from 20072008, we can see if any patterns are beginning to emerge and they will intensify in 2009 New estimates including better income and poverty measures may show different patterns, but – Major need appears steady or growing in La Crosse and Milwaukee; also growing in Dane and Jefferson/Walworth Counties
 Pulling It Together: Wisconsin Poverty in 2007 & 2008 by County/Region High Poverty in 08 (12% or more) Average Poverty in 2008 (8 -12%) High Poverty in 2007 (12% or more) La Crosse County Milwaukee County Kenosha County Rock County 9 central WI counties (Stevens Point, Crandon) 10 -county area (Superior) Average Poverty in 2007 (8% to 12%) Dane County Brown County Racine County 5 -county area (Dodgeville) 5 -county area (Menomonie) Chippewa/Eau Claire Counties 6 -county area (Manitowoc) 7 -county area (Fond du Lac) 8 -county area (Sparta) Low Poverty in 2007 (less than 8%) Jefferson/Walworth Region Low Poverty in 2008 (Less than 8%) Columbia/Dodge/Sauk (Baraboo) Calumet/ Outagamie/ Winnebago Marathon County Ozaukee/Washington (West Bend) Sheboygan County Waukesha County
 Next Steps: This Morning and Beyond l Listening to people around Wisconsin to develop a unique measure of poverty for our state l Next report in June 2010 as national model built on new NAS guidelines l Build a better tool for assessing economic, program and policy impacts
 Thanks Send your reactions to me, please: Tim Smeeding Director, Institute for Research on Poverty smeeding@lafollette. wisc. edu