46ad02b85c1e357e1939476d057c7efd.ppt
- Количество слайдов: 27
 The United States Market System Consumers and the Law of Demand; Firms and the Law of Supply, Market Equilibrium, and Market Structure
 LAW OF DEMAND Demand: How much of a product consumers are both willing and able to purchase at each possible price during a given period Law of Demand: the quantity demanded varies inversely with the price Consumers try to maximize their utility (satisfaction) which affects demand: (satisfy unlimited wants w/ scarce resources) -the more utility you receive from a good the higher price you will pay for it and vice versa - Substitution Effect: Change in prices of related goods can effect the demand Ex: - Money Income v. Real Income - Use your money income to maximize real income
 Law of demand Marginal Utility ? ? Law of Diminishing Marginal Utility: the more of a good an individual consumes the less marginal utility (satisfaction) you gain -impact? (since each unit is worth less to you, you are therefore willing to pay less for it) - buy one, get second ½ off - first slice, second slice, third slice of pizza Individual Demand v. Market Demand = demand of an individual consumer = sum of the demands of all individual consumers in a market
 Demand Schedule and Curve Shows the relationship between price and quantity demanded for a given period
 Demand Schedule Price of Root Beer. 10. 20. 30. 40. 50 Demand Curve Amount John would buy per month 25 20 15 10 5
 Market Demand Graph the demand curve of lbs. of beef per week of the following members of the Social Studies Department: Mr. Foley Mr. Rae Mr. Rupertus Lbs. Price 1 $8 0 $8 2 $6 0 $6 1 $6 3 $4 1 $4 2 $4 4 $2 2 $2 3 $2 Market Demand of Beef
 Graph both the individual demands and market demands for Aquinas’ students demand of birthday balloons per school year. Student A # of Balloons Price 30 $1 25 $1. 50 20 $2 15 $2. 50 10 $3 5 $3. 50 0 $4 Student C # of Balloons Price 15 $1 10 $1. 50 5 $2 1 $2. 50 0 $3. 50 0 $4 Student B # of Balloons Price 40 $1 35 $1. 50 30 $2 25 $2. 50 20 $3 15 $3. 50 10 $4 Student D # of Balloons Price 25 $1 20 $1. 50 15 $2 10 $2. 50 5 $3 1 $3. 50 0 $4
 # of Balloons Price
 Graph both the individual demands and market demand for gallons of gas per week. Individual A # of Gallons Price 20 $2 17 $2. 50 14 $3 11 $3. 50 8 $4 5 $4. 50 2 $5 Individual B # of Gallons Price 12 $2 10 $2. 50 8 $3 6 $3. 50 4 $4 2 $4. 50 0 $5 Individual C # of Gallons Price 30 $2 26 $2. 50 22 $3 18 $3. 50 16 $4 12 $4. 50 8 $5
 Gallons of Gas Price
 Elasticity of Demand How businesses determine if they should lower prices to increase profits (Is it worth it? ) demand is elastic! -it will be beneficial to lower the price as enough additional units will be sold to raise revenue demand is inelastic -revenue will fall if price is lowered as the quantity sold will not increase enough to make up for the drop in price
 Elasticity of Demand Elasticity can depend on: 1. Availability of substitutes - more competition=more elastic Ex: Dollar Menus (Mc. Donald’s, BK, Wendy’s) 2. Cost of the item – the greater portion of a person’s income the object is, the more elastic Ex: Housing Prices (when prices drop, demand increases dramatically) 3. How long the price change lasts – elasticity is greater in the long run than in the short run – consumers have more time to adjust
 Other Factors That Affect Demand Besides Price and Quantity, Demand is affected by: 1. Changes in consumer income – i. e. if income increases - increases demand for normal goods and decreases demand for inferior goods Ex: ppl. buy Tide, instead of the Wal-Mart brand 2. Changes in the price of related goods – - If the price of substitutes drops, demand drops Ex: ? - If the price of complements drop the demand increases and vice versa Ex: ? 3. Changes in the size or composition of the population 4. Changes in consumer expectations about future income and future prices 5. Changes in consumer tastes
,") Law of Supply Producers try to maximize profits (Profit= Total Revenue – Total Cost), in order to do so, they control the supply Total Cost = Fixed Costs + Variable Costs Supply = How much a good producers are willing and able to offer for sale period at each possible price Firms will increase their supply if… their marginal revenue for each unit sold is more than the marginal cost is takes to produce Marginal Revenue = market value of the unit Marginal Cost = Change in Total Cost/ Change in Quantity Apply to “Cost, Cost” wksh.
Law of Supply Producers try to maximize profits (Profit= Total Revenue – Total Cost), in order to do so, they control the supply Total Cost = Fixed Costs + Variable Costs Supply = How much a good producers are willing and able to offer for sale period at each possible price Firms will increase their supply if… their marginal revenue for each unit sold is more than the marginal cost is takes to produce Marginal Revenue = market value of the unit Marginal Cost = Change in Total Cost/ Change in Quantity Apply to “Cost, Cost” wksh.
 Supply Curve Law of Supply: the quantity supplied is usually directly related to the price
 Supply Schedule and Curve 1. Graph the supply curve for each of the following t-shirt companies. 2. Then graph the market supply curve. Tee-rriffic Quantity Price 30 $5 40 $6 50 $7 60 $8 70 $9 Tom’s Terrific T’s Quantity Price 50 $5 60 $6 70 $7 80 $8 90 $9 Tee-Time Quantity Price 60 $5 70 $6 80 $7 90 $8 100 $9
 Elasticity of Supply • Used to determine whether a company will respond to an increase in price by increasing supply • Companies want to supply more at higher prices – but will consumers buy more? -elastic producers are more willing to raise production because it will increase total profits -inelastic producers will NOT produce (supply) more products because a change in supply will not increase profits
 Other Factors that Affect Supply Besides the price, supply is affected by: 1. The cost of the resources used to make the good (if the cost of resources drops, supply increases) Ex: 2. The price of other goods these resources can make (if the price of other goods increases, supply to decreases) Ex: 3. Changes in the technology used to make the good – if technology improves production, supply can be increase Ex: 4. Producer expectation about future shifts in prices Ex: 5. The number of sellers in the market Ex:
 Market Equilibrium Consumers and Producers therefore work opposite one another -if the price goes up, consumer demand decreases but producer supply increases -Market forces resolve this conflict by working towards equilibrium Market Equilibrium = -the quantity that consumers are willing to buy equals the quantity that producers are willing and able to sell at a given price -there is no incentive for a change in quantity or price In order to reach equilibrium: -If there is a surplus (at a given price, the amount supplied exceeds the quantity demanded) prices are forced down -If there is a shortage (at a given price, the quantity demanded exceeds the amount supplied) prices go up
 Equilibrium Price • Demand Curves and Supply Curves meet at an equilibrium point which leads to an equilibrium price and quantity • What is this an example of? • Although in competition, both producers and consumers can win in a free-market!
 Equilibrium Price Graph the supply and demand curve using the information below. Quantity Demanded Price Quantity Supplied 50. 10 10 40. 20 20 30. 30 30 20. 40 40 10. 50 50 What is the equilibrium price? What is the equilibrium quantity? Why can’t the supplier demand $. 50? Why can’t the buyer pay only $. 10?
 EQUILIBRIUM PRICE Graph the supply and demand curve using the information below. Quantity Demanded Price Quantity Supplied 180 $5 30 150 $10 60 120 $15 90 90 $20 120 60 $25 150 30 $30 180 What is the equilibrium price? What is the equilibrium quantity?
 Shifts in Demand Curve When there are shifts in supply and demand, adjustments need to be made in the market in order to reach a new equilibrium point If the demand increases (demand curve shifts rightwards) – a shortage is created and producers raise prices and quantities If the demand decreases (leftwards)– a surplus is created and prices and producers reduce prices and quantities
 - producers") Shifts in Supply Curve If the supply increases (supply curve shifts rightwards) - producers will reduce prices and increase quantities If the supply decreases (leftwards) – producers will increase prices and decrease quantities
Shifts in Supply Curve If the supply increases (supply curve shifts rightwards) - producers will reduce prices and increase quantities If the supply decreases (leftwards) – producers will increase prices and decrease quantities
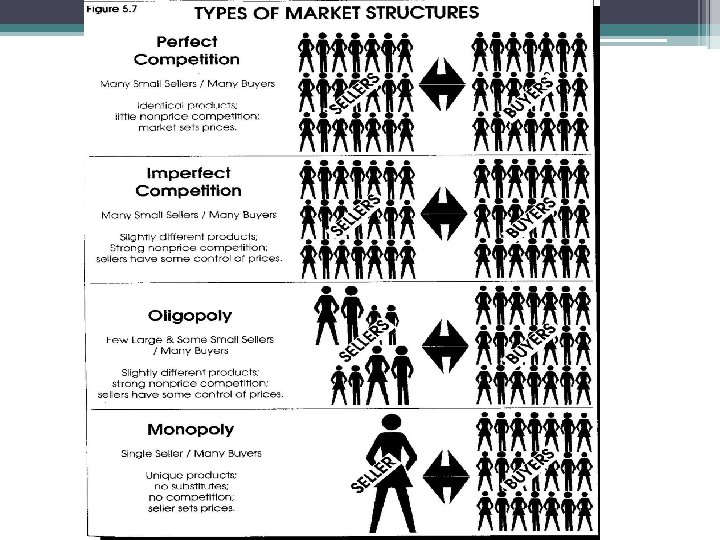
 Market Structure Market structure includes the number of buyers and sellers, the uniformity of the item, the ease of entry into the market and the amount of competition between firms How much of a role the laws of supply and demand have over a specific market depends largely on the structure of the market Four market structures exist in the United States: 1. Perfect Competition 2. Monopoly 3. Monopolistic Competition 4. Oligopoly In order to encourage a competitive market, the US government has antitrust laws
 Market Structure Number of Uniformity Buyers of Product and Sellers Ease of entry into Market Control over prices and supply Examples in the United States Perfect Competition Many buyers and sellers Complete uniformity No barriers to entry No control Farmers – - 1 firm Bushel of tiny part Wheat of market Monopoly One seller, many buyers Unique product, no substitutes Large barriers to entry Complete control Electric Company, Post Office Monopolistic Competition Many buyers and sellers Some differentiation in products No barriers to entry Limited Control – Market Forces Convenience and Grocery Stores, Clothing Oligopoly Few sellers, many buyers Some differentiation in products Substantial barriers to entry Some Control Automobiles, Electronics